Races in Silver City, Georgia (GA) Detailed Stats
Ancestries, Foreign-born residents, place of birth
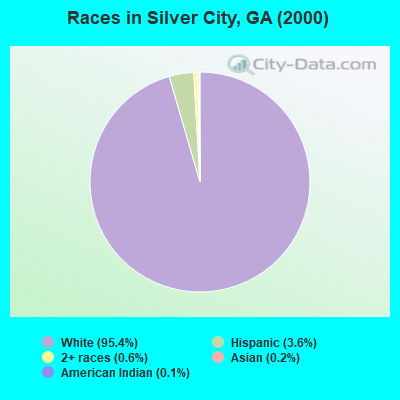
Race distribution in Silver City

- 9,15895.4%White alone
- 3453.6%Hispanic
- 550.6%Two or more races
- 210.2%Asian alone
- 110.1%American Indian alone
- 40.04%Black alone
- 20.02%Native Hawaiian and Other
Pacific Islander alone - 10.01%Other race alone
2000
2022
-
- 5,128,66162.6%White alone
- 2,331,46528.5%Black alone
- 435,2275.3%Hispanic
- 171,5132.1%Asian alone
- 87,3641.1%Two or more races
- 17,6700.2%American Indian alone
- 11,2750.1%Other race alone
- 3,2780.04%Native Hawaiian and Other
Pacific Islander alone

-
- 5,415,65749.6%White alone
- 3,349,24030.7%Black alone
- 1,132,60410.4%Hispanic
- 479,1564.4%Asian alone
- 462,9234.2%Two or more races
- 54,4160.5%Other race alone
- 11,9230.1%American Indian alone
- 6,9570.06%Native Hawaiian and Other
Pacific Islander alone

Income and house value in Silver City
- Median household income in 2022
- $106,046White non-Hispanic householders
- $59,524Asian householders
- $126,687Some other race householders
- $178,959Two or more races householders
- $135,362Hispanic or Latino race householders
- Median 2022 house value
- $421,757White Non-Hispanic householders
- $829,637Asian householders
- over $1,000,000Native Hawaiian and other Pacific Islander householders
- $196,096Some other race householders
- $480,888Two or more races householders
- $479,379Hispanic or Latino householders
Household income for White non-Hispanic householders

Household income for Asian householders

Household income for Native Hawaiian and other Pacific Islander householders

Household income for Two or more races householders

Household income for Hispanic or Latino race householders

Zip code: 30040