Races in Siler City, North Carolina (NC) Detailed Stats
Data:
Races - White alone (%)
Races - White alone (% change since 2000)
Races - Black alone (%)
Races - Black alone (% change since 2000)
Races - American Indian alone (%)
Races - American Indian alone (% change since 2000)
Races - Asian alone (%)
Races - Asian alone (% change since 2000)
Races - Hispanic (%)
Races - Hispanic (% change since 2000)
Races - Native Hawaiian and Other Pacific Islander alone (%)
Races - Native Hawaiian and Other Pacific Islander alone (% change since 2000)
Races - Two or more races(%)
Races - Two or more races(% change since 2000)
Races - Other race alone (%)
Races - Other race alone (% change since 2000)
Racial diversity
Place of birth - Born in state of residence (%)
Place of birth - Born in state of residence (%) - White
Place of birth - Born in state of residence (%) - Black or African American
Place of birth - Born in state of residence (%) - Asian
Place of birth - Born in state of residence (%) - Hispanic or Latino
Place of birth - Born in state of residence (%) - American Indian and Alaska Native
Place of birth - Born in state of residence (%) - Multirace
Place of birth - Born in state of residence (%) - Other Race
Place of birth - Born in other state (%)
Place of birth - Born in other state (%) - White
Place of birth - Born in other state (%) - Black or African American
Place of birth - Born in other state (%) - Asian
Place of birth - Born in other state (%) - Hispanic or Latino
Place of birth - Born in other state (%) - American Indian and Alaska Native
Place of birth - Born in other state (%) - Multirace
Place of birth - Born in other state (%) - Other Race
Place of birth - Native, outside of US (%)
Place of birth - Native, outside of US (%) - White
Place of birth - Native, outside of US (%) - Black or African American
Place of birth - Native, outside of US (%) - Asian
Place of birth - Native, outside of US (%) - Hispanic or Latino
Place of birth - Native, outside of US (%) - American Indian and Alaska Native
Place of birth - Native, outside of US (%) - Multirace
Place of birth - Native, outside of US (%) - Other Race
Place of birth - Foreign born (%)
Place of birth - Foreign born (%) - White
Place of birth - Foreign born (%) - Black or African American
Place of birth - Foreign born (%) - Asian
Place of birth - Foreign born (%) - Hispanic or Latino
Place of birth - Foreign born (%) - American Indian and Alaska Native
Place of birth - Foreign born (%) - Multirace
Place of birth - Foreign born (%) - Other Race
Residents speaking English at home (%)
Residents speaking English at home - Born in the United States (%)
Residents speaking English at home - Native, born elsewhere (%)
Residents speaking English at home - Foreign born (%)
Residents speaking Spanish at home (%)
Residents speaking Spanish at home - Born in the United States (%)
Residents speaking Spanish at home - Native, born elsewhere (%)
Residents speaking Spanish at home - Foreign born (%)
Residents speaking other language at home (%)
Residents speaking other language at home - Born in the United States (%)
Residents speaking other language at home - Native, born elsewhere (%)
Residents speaking other language at home - Foreign born (%)
Marital status - Never married (%)
Marital status - Now married (%)
Marital status - Separated (%)
Marital status - Widowed (%)
Marital status - Divorced (%)
Ancestries Reported - Arab (%)
Ancestries Reported - Czech (%)
Ancestries Reported - Danish (%)
Ancestries Reported - Dutch (%)
Ancestries Reported - English (%)
Ancestries Reported - French (%)
Ancestries Reported - French Canadian (%)
Ancestries Reported - German (%)
Ancestries Reported - Greek (%)
Ancestries Reported - Hungarian (%)
Ancestries Reported - Irish (%)
Ancestries Reported - Italian (%)
Ancestries Reported - Lithuanian (%)
Ancestries Reported - Norwegian (%)
Ancestries Reported - Polish (%)
Ancestries Reported - Portuguese (%)
Ancestries Reported - Russian (%)
Ancestries Reported - Scotch-Irish (%)
Ancestries Reported - Scottish (%)
Ancestries Reported - Slovak (%)
Ancestries Reported - Subsaharan African (%)
Ancestries Reported - Swedish (%)
Ancestries Reported - Swiss (%)
Ancestries Reported - Ukrainian (%)
Ancestries Reported - United States (%)
Ancestries Reported - Welsh (%)
Ancestries Reported - West Indian (%)
Ancestries Reported - Other (%)
Geographical mobility - Same house 1 year ago (%)
Geographical mobility - Same house 1 year ago (%) - White
Geographical mobility - Same house 1 year ago (%) - Black or African American
Geographical mobility - Same house 1 year ago (%) - Asian
Geographical mobility - Same house 1 year ago (%) - Hispanic or Latino
Geographical mobility - Same house 1 year ago (%) - American Indian and Alaska Native
Geographical mobility - Same house 1 year ago (%) - Multirace
Geographical mobility - Same house 1 year ago (%) - Other Race
Geographical mobility - Moved within same county (%)
Geographical mobility - Moved within same county (%) - White
Geographical mobility - Moved within same county (%) - Black or African American
Geographical mobility - Moved within same county (%) - Asian
Geographical mobility - Moved within same county (%) - Hispanic or Latino
Geographical mobility - Moved within same county (%) - American Indian and Alaska Native
Geographical mobility - Moved within same county (%) - Multirace
Geographical mobility - Moved within same county (%) - Other Race
Geographical mobility - Moved from different county within same state (%)
Geographical mobility - Moved from different county within same state (%) - White
Geographical mobility - Moved from different county within same state (%) - Black or African American
Geographical mobility - Moved from different county within same state (%) - Asian
Geographical mobility - Moved from different county within same state (%) - Hispanic or Latino
Geographical mobility - Moved from different county within same state (%) - American Indian and Alaska Native
Geographical mobility - Moved from different county within same state (%) - Multirace
Geographical mobility - Moved from different county within same state (%) - Other Race
Geographical mobility - Moved from different state (%)
Geographical mobility - Moved from different state (%) - White
Geographical mobility - Moved from different state (%) - Black or African American
Geographical mobility - Moved from different state (%) - Asian
Geographical mobility - Moved from different state (%) - Hispanic or Latino
Geographical mobility - Moved from different state (%) - American Indian and Alaska Native
Geographical mobility - Moved from different state (%) - Multirace
Geographical mobility - Moved from different state (%) - Other Race
Geographical mobility - Moved from abroad (%)
Geographical mobility - Moved from abroad (%) - White
Geographical mobility - Moved from abroad (%) - Black or African American
Geographical mobility - Moved from abroad (%) - Asian
Geographical mobility - Moved from abroad (%) - Hispanic or Latino
Geographical mobility - Moved from abroad (%) - American Indian and Alaska Native
Geographical mobility - Moved from abroad (%) - Multirace
Geographical mobility - Moved from abroad (%) - Other Race
Place of birth for the foreign-born population - Ireland (%)
Place of birth for the foreign-born population - Denmark (%)
Place of birth for the foreign-born population - Norway (%)
Place of birth for the foreign-born population - Sweden (%)
Place of birth for the foreign-born population - United Kingdom (%)
Place of birth for the foreign-born population - England (%)
Place of birth for the foreign-born population - Scotland (%)
Place of birth for the foreign-born population - Other Northern Europe (%)
Place of birth for the foreign-born population - Austria (%)
Place of birth for the foreign-born population - Belgium (%)
Place of birth for the foreign-born population - France (%)
Place of birth for the foreign-born population - Germany (%)
Place of birth for the foreign-born population - Netherlands (%)
Place of birth for the foreign-born population - Switzerland (%)
Place of birth for the foreign-born population - Other Western Europe (%)
Place of birth for the foreign-born population - Greece (%)
Place of birth for the foreign-born population - Italy (%)
Place of birth for the foreign-born population - Portugal (%)
Place of birth for the foreign-born population - Spain (%)
Place of birth for the foreign-born population - Other Southern Europe (%)
Place of birth for the foreign-born population - Albania (%)
Place of birth for the foreign-born population - Belarus (%)
Place of birth for the foreign-born population - Bosnia and Herzegovina (%)
Place of birth for the foreign-born population - Bulgaria (%)
Place of birth for the foreign-born population - Croatia (%)
Place of birth for the foreign-born population - Czechoslovakia (%)
Place of birth for the foreign-born population - Hungary (%)
Place of birth for the foreign-born population - Latvia (%)
Place of birth for the foreign-born population - Lithuania (%)
Place of birth for the foreign-born population - North Macedonia (Macedonia) (%)
Place of birth for the foreign-born population - Moldova (%)
Place of birth for the foreign-born population - Poland (%)
Place of birth for the foreign-born population - Romania (%)
Place of birth for the foreign-born population - Russia (%)
Place of birth for the foreign-born population - Serbia (%)
Place of birth for the foreign-born population - Ukraine (%)
Place of birth for the foreign-born population - Other Eastern Europe (%)
Place of birth for the foreign-born population - China (%)
Place of birth for the foreign-born population - Hong Kong (%)
Place of birth for the foreign-born population - Taiwan (%)
Place of birth for the foreign-born population - Japan (%)
Place of birth for the foreign-born population - Korea (%)
Place of birth for the foreign-born population - Other Eastern Asia (%)
Place of birth for the foreign-born population - Afghanistan (%)
Place of birth for the foreign-born population - Bangladesh (%)
Place of birth for the foreign-born population - India (%)
Place of birth for the foreign-born population - Iran (%)
Place of birth for the foreign-born population - Kazakhstan (%)
Place of birth for the foreign-born population - Nepal (%)
Place of birth for the foreign-born population - Pakistan (%)
Place of birth for the foreign-born population - Sri Lanka (%)
Place of birth for the foreign-born population - Uzbekistan (%)
Place of birth for the foreign-born population - Other South Central Asia (%)
Place of birth for the foreign-born population - Burma (%)
Place of birth for the foreign-born population - Cambodia (%)
Place of birth for the foreign-born population - Indonesia (%)
Place of birth for the foreign-born population - Laos (%)
Place of birth for the foreign-born population - Malaysia (%)
Place of birth for the foreign-born population - Philippines (%)
Place of birth for the foreign-born population - Singapore (%)
Place of birth for the foreign-born population - Thailand (%)
Place of birth for the foreign-born population - Vietnam (%)
Place of birth for the foreign-born population - Other South Eastern Asia (%)
Place of birth for the foreign-born population - Armenia (%)
Place of birth for the foreign-born population - Iraq (%)
Place of birth for the foreign-born population - Israel (%)
Place of birth for the foreign-born population - Jordan (%)
Place of birth for the foreign-born population - Kuwait (%)
Place of birth for the foreign-born population - Lebanon (%)
Place of birth for the foreign-born population - Saudi Arabia (%)
Place of birth for the foreign-born population - Syria (%)
Place of birth for the foreign-born population - Turkey (%)
Place of birth for the foreign-born population - Yemen (%)
Place of birth for the foreign-born population - Other Western Asia (%)
Place of birth for the foreign-born population - Eritrea (%)
Place of birth for the foreign-born population - Ethiopia (%)
Place of birth for the foreign-born population - Kenya (%)
Place of birth for the foreign-born population - Somalia (%)
Place of birth for the foreign-born population - Uganda (%)
Place of birth for the foreign-born population - Zimbabwe (%)
Place of birth for the foreign-born population - Other Eastern Africa (%)
Place of birth for the foreign-born population - Cameroon (%)
Place of birth for the foreign-born population - Congo (%)
Place of birth for the foreign-born population - Democratic Republic of Congo (Zaire) (%)
Place of birth for the foreign-born population - Other Middle Africa (%)
Place of birth for the foreign-born population - Egypt (%)
Place of birth for the foreign-born population - Morocco (%)
Place of birth for the foreign-born population - Sudan (%)
Place of birth for the foreign-born population - Other Northern Africa (%)
Place of birth for the foreign-born population - South Africa (%)
Place of birth for the foreign-born population - Other Southern Africa (%)
Place of birth for the foreign-born population - Cabo Verde (%)
Place of birth for the foreign-born population - Ghana (%)
Place of birth for the foreign-born population - Liberia (%)
Place of birth for the foreign-born population - Nigeria (%)
Place of birth for the foreign-born population - Senegal (%)
Place of birth for the foreign-born population - Sierra Leone (%)
Place of birth for the foreign-born population - Other Western Africa (%)
Place of birth for the foreign-born population - Australia (%)
Place of birth for the foreign-born population - New Zealand (%)
Place of birth for the foreign-born population - Fiji (%)
Place of birth for the foreign-born population - Micronesia (%)
Place of birth for the foreign-born population - Bahamas (%)
Place of birth for the foreign-born population - Barbados (%)
Place of birth for the foreign-born population - Cuba (%)
Place of birth for the foreign-born population - Dominica (%)
Place of birth for the foreign-born population - Dominican Republic (%)
Place of birth for the foreign-born population - Grenada (%)
Place of birth for the foreign-born population - Haiti (%)
Place of birth for the foreign-born population - Jamaica (%)
Place of birth for the foreign-born population - St. Vincent and the Grenadines (%)
Place of birth for the foreign-born population - Trinidad and Tobago (%)
Place of birth for the foreign-born population - West Indies (%)
Place of birth for the foreign-born population - Other Caribbean (%)
Place of birth for the foreign-born population - Belize (%)
Place of birth for the foreign-born population - Costa Rica (%)
Place of birth for the foreign-born population - El Salvador (%)
Place of birth for the foreign-born population - Guatemala (%)
Place of birth for the foreign-born population - Honduras (%)
Place of birth for the foreign-born population - Mexico (%)
Place of birth for the foreign-born population - Nicaragua (%)
Place of birth for the foreign-born population - Panama (%)
Place of birth for the foreign-born population - Other Central America (%)
Place of birth for the foreign-born population - Argentina (%)
Place of birth for the foreign-born population - Bolivia (%)
Place of birth for the foreign-born population - Brazil (%)
Place of birth for the foreign-born population - Chile (%)
Place of birth for the foreign-born population - Colombia (%)
Place of birth for the foreign-born population - Ecuador (%)
Place of birth for the foreign-born population - Guyana (%)
Place of birth for the foreign-born population - Peru (%)
Place of birth for the foreign-born population - Uruguay (%)
Place of birth for the foreign-born population - Venezuela (%)
Place of birth for the foreign-born population - Other South America (%)
Place of birth for the foreign-born population - Canada (%)
Place of birth for the foreign-born population - Other Northern America (%)
Place of birth for the foreign-born population - Other (%)
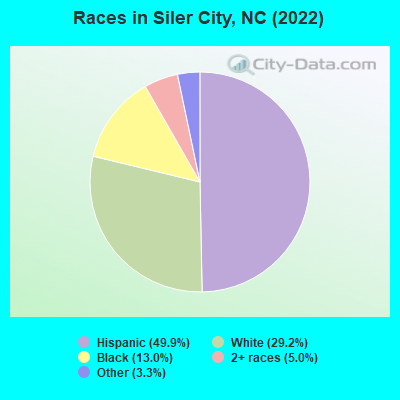
According to 2022 data, the most numerous races in Siler City, NC are White alone (2,386 residents), Black alone (1,062 residents), and Hispanic (4,072 residents). 50.2% of Siler City residents speak English at home. 30.8% of Siler City, NC residents are foreign-born (28.9% born in Latin America), which is 74.0% greater than the foreign-born rate of 8.0% across the entire state of North Carolina.
Race distribution in Siler City
2000 2022
5,647,155 70.2% White alone 1,723,301 21.4% Black alone 378,963 4.7% Hispanic 112,416 1.4% Asian alone 95,333 1.2% American Indian alone 79,965 1.0% Two or more races 9,015 0.1% Other race alone 3,165 0.04% Native Hawaiian and Other
6,497,519 60.7% White alone 2,155,650 20.1% Black alone 1,114,799 10.4% Hispanic 438,061 4.1% Two or more races 341,052 3.2% Asian alone 91,758 0.9% American Indian alone 50,180 0.5% Other race alone 9,954 0.09% Native Hawaiian and Other
Income and house value in Siler City Median household income in 2022 $54,519 White non-Hispanic householders$47,585 Black householders$47,537 Some other race householders$49,292 Two or more races householders$44,838 Hispanic or Latino race householdersMedian 2022 house value $172,001 White Non-Hispanic householders$149,832 Black or African American householders$188,033 American Indian or Alaska Native householders $544,307 Asian householders$113,611 Some other race householders$445,342 Two or more races householders$159,927 Hispanic or Latino householders
Median age by race in Siler City
46.4 Median age for White residents50.3 36.2 63.6 Median age for Black or African American residents42.9 57.6 -643,097,642.5 Median age for American Indian / Alaska Native residents-668,604,650.5 -682,971,013.8 -783,715,011.9 Median age for Asian residents-730,296,456.2 -767,412,934.6 -666,666,666.0 Median age for Native Hawaiian / Pacific Islander residents-666,666,666.0 -666,666,666.0 27.3 Median age for Other race residents26.1 32.9 12.1 Median age for Two or more races residents36.2 11.0 53.8 Median age for White alone residents55.5 48.4 30.8 Median age for Hispanic or Latino residents25.8 33.2
Owner/renter occupied households by race in Siler City
House owners and renters - White residents 789 53.4% Owner occupied688 46.6% Renter occupiedHouse owners and renters - Black or African American residents 456 60.5% Owner occupied297 39.5% Renter occupiedHouse owners and renters - Other race residents 587 54.2% Owner occupied496 45.8% Renter occupiedHouse owners and renters - Two or more races residents 122 69.3% Owner occupied54 30.7% Renter occupiedHouse owners and renters - White alone residents 617 54.0% Owner occupied525 46.0% Renter occupiedHouse owners and renters - Hispanic or Latino residents 489 43.8% Owner occupied627 56.2% Renter occupied
Language usage in Siler City
English speakers - Total 50.2% of residents of Siler City speak English at home.
43.5% of residents speak Spanish at home 1,704 50.4% Speak English very well1,675 49.6% Speak English less than very well1.2% of residents speak other language at home 55 58.5% Speak English very well39 41.5% Speak English less than very well
English speakers - Born in the United States 85.9% of residents of Siler City speak English at home.
9.0% of residents speak Spanish at home 80 89.9% Speak English very well9 10.1% Speak English less than very well
English speakers - Foreign-born 3.4% of residents of Siler City speak English at home.
96.7% of residents speak Spanish at home 445 21.3% Speak English very well1,641 78.7% Speak English less than very well1.8% of residents speak other language at home 38 100.0% Speak English less than very well
White (Caucasian) - Speak another language Native:
9.5% (269)Foreign-born:
83.5% (430)
Other race - Speak only English Native:
24.1% (367)Foreign-born:
5.2% (110)
Other race - Speak another language Native:
75.6% (1,152)Foreign-born:
89.0% (1,896)
Two or more races - Speak another language Native:
72.5% (388)Foreign-born:
100.0% (354)
Hispanic or Latino - Speak only English Native:
10.6% (185)Foreign-born:
4.3% (98)
Hispanic or Latino - Speak another language Native:
84.3% (1,474)Foreign-born:
95.6% (2,175)
Foreign-born residents in Siler City 2,514 residents are foreign born (28.9% Latin America ).
This city:
30.8%North Carolina:
8.3%
Marital status for residents in Siler City Marital status - White (Caucasian) population 15 years and over
Males 31.2% Never married39.6% Now married3.3% Separated8.4% Widowed17.5% DivorcedFemales 29.6% Never married30.8% Now married3.6% Separated16.8% Widowed19.2% DivorcedWomen who gave birth in the past 12 months Now married:
46.6% (63)Unmarried:
53.4% (73)
Women who did not give birth in the past 12 months Now married:
39.3% (327)Unmarried:
60.7% (504)
Marital status - Black or African American population 15 years and over
Males 30.8% Never married56.8% Now married7.7% Separated3.8% Widowed0.9% DivorcedFemales 33.0% Never married25.6% Now married1.3% Separated9.0% Widowed31.1% DivorcedWomen who gave birth in the past 12 months Now married:
0.0% (0)Unmarried:
100.0% (51)
Women who did not give birth in the past 12 months Now married:
0.0% (0)Unmarried:
100.0% (51)
Marital status - Other race population 15 years and over
Males 51.0% Never married36.4% Now married11.0% Separated0.0% Widowed1.7% DivorcedFemales 63.2% Never married30.7% Now married2.8% Separated0.0% Widowed3.4% DivorcedWomen who gave birth in the past 12 months Now married:
0.0% (0)Unmarried:
100.0% (30)
Women who did not give birth in the past 12 months Now married:
29.8% (298)Unmarried:
70.2% (699)
Marital status - Two or more races population 15 years and over
Males 57.1% Never married40.1% Now married0.0% Separated0.0% Widowed2.7% DivorcedFemales 59.1% Never married14.8% Now married11.1% Separated13.4% Widowed1.7% DivorcedWomen who gave birth in the past 12 months Now married:
100.0% (15)Unmarried:
0.0% (0)
Women who did not give birth in the past 12 months Now married:
9.5% (26)Unmarried:
90.5% (248)
Marital status - White alone, not Hispanic / Latino population 15 years and over
Males 30.8% Never married34.9% Now married0.0% Separated10.9% Widowed23.5% DivorcedFemales 22.0% Never married30.8% Now married4.3% Separated22.5% Widowed20.4% DivorcedWomen who did not give birth in the past 12 months Now married:
46.4% (286)Unmarried:
53.6% (331)
Marital status - Hispanic or Latino population 15 years and over
Males 49.6% Never married44.5% Now married3.1% Separated1.1% Widowed1.6% DivorcedFemales 61.2% Never married30.4% Now married1.8% Separated0.0% Widowed6.6% DivorcedWomen who gave birth in the past 12 months Now married:
46.6% (66)Unmarried:
53.4% (76)
Women who did not give birth in the past 12 months Now married:
24.1% (293)Unmarried:
75.9% (922)
Ancestries in Siler City
410 8.4% English289 5.9% American28 0.6% Irish23 0.5% Scotch-Irish18 0.4% German14 0.3% European9 0.2% African1 0.02% Italian
Children Nativity (place of birth) in Siler City
Children under 6 years - Living with two parents Both parents native 121 100.0% NativeBoth parents foreign-born 136 100.0% NativeOne native, one foreign-born parent 10 100.0% NativeChildren under 6 years - Living with one parent Native parent 116 100.0% NativeForeign-born parent 82 85.0% Native14 15.0% Foreign-bornChildren 6 to 17 years - Living with two parents Both parents native 173 100.0% NativeBoth parents foreign-born 420 61.4% Native264 38.6% Foreign-bornOne native, one foreign-born parent 30 100.0% NativeChildren 6 to 17 years - Living with one parent Native parent 219 100.0% NativeForeign-born parent 353 52.7% Native317 47.3% Foreign-born
Grandparents responsible for own grandchildren in Siler City
Grandparents (30 to 59 years) White / Caucasian 41 100.0% Not responsible for grandchildrenBlack or African American 82 100.0% Not responsible for grandchildrenHispanic or Latino 64 100.0% Not responsible for grandchildren
Grandparents (60 years and over) White / Caucasian 7 100.0% Not responsible for grandchildrenBlack or African American 8 100.0% Not responsible for grandchildrenHispanic or Latino 2 100.0% Not responsible for grandchildren