Races in Shelton, Washington (WA) Detailed Stats
Ancestries, Foreign-born residents, place of birth
Settings
X


Recent posts about races in Shelton, Washington on our local forum with over 2,400,000 registered users:

Latest news about races in Shelton, WA collected exclusively by city-data.com from local newspapers, TV, and radio stations
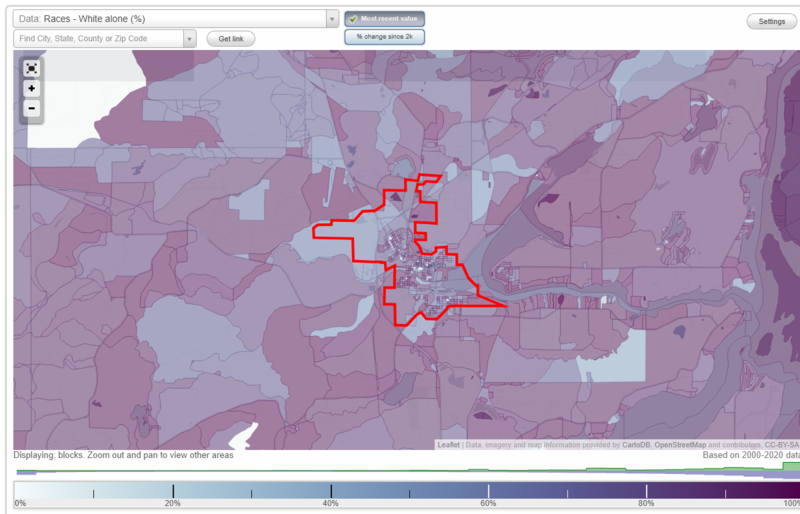
According to 2022 data, the most numerous races in Shelton, WA are White alone (6,729 residents), Hispanic (3,014 residents), and Asian alone (95 residents). 74.6% of Shelton residents speak English at home. 16.8% of Shelton, WA residents are foreign-born (14.3% born in Latin America), which is 10.9% greater than the foreign-born rate of 15.0% across the entire state of Washington.
Race distribution in Shelton
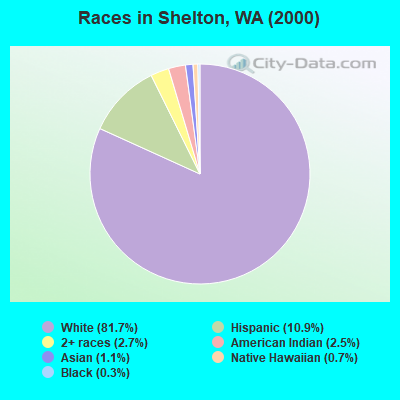
2000
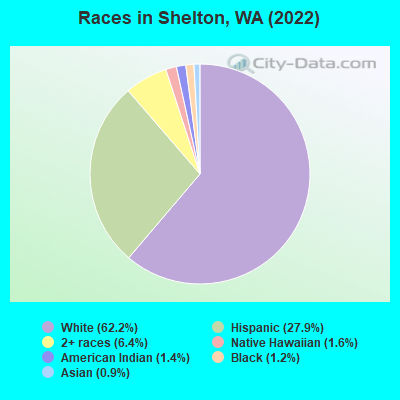
2022

- 6,89981.7%White alone
- 91810.9%Hispanic
- 2252.7%Two or more races
- 2102.5%American Indian alone
- 971.1%Asian alone
- 560.7%Native Hawaiian and Other
Pacific Islander alone - 290.3%Black alone
- 80.09%Other race alone
-
- 6,72962.2%White alone
- 3,01427.9%Hispanic
- 6946.4%Two or more races
- 1731.6%Native Hawaiian and Other
Pacific Islander alone - 1471.4%American Indian alone
- 1331.2%Black alone
- 950.9%Asian alone
2000
2022
-
- 4,652,49078.9%White alone
- 441,5097.5%Hispanic
- 319,4015.4%Asian alone
- 184,6313.1%Black alone
- 175,9263.0%Two or more races
- 85,3961.4%American Indian alone
- 22,7790.4%Native Hawaiian and Other
Pacific Islander alone - 11,9890.2%Other race alone

-
- 4,941,45663.5%White alone
- 1,093,31314.0%Hispanic
- 755,8329.7%Asian alone
- 523,4486.7%Two or more races
- 299,5373.8%Black alone
- 69,0240.9%American Indian alone
- 52,2310.7%Native Hawaiian and Other
Pacific Islander alone - 50,9450.7%Other race alone

Income and house value in Shelton
- Median household income in 2022
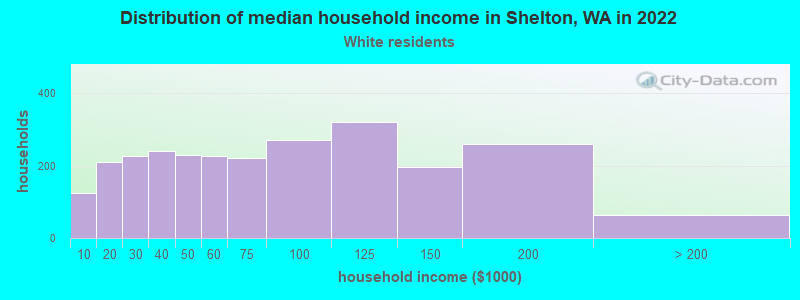
- $63,787White non-Hispanic householders
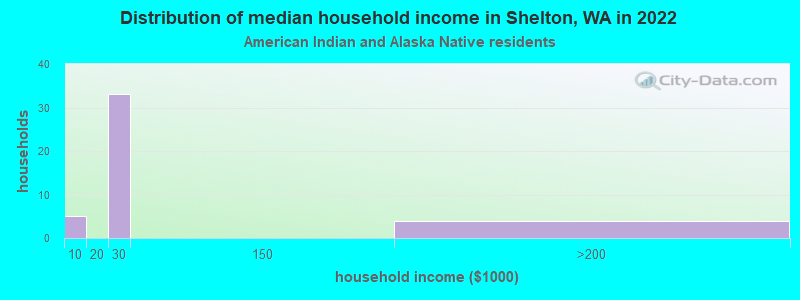
- $49,056American Indian and Alaska Native householders
- $50,609Some other race householders
- $61,148Hispanic or Latino race householders
- Median 2022 house value
- $345,316White Non-Hispanic householders
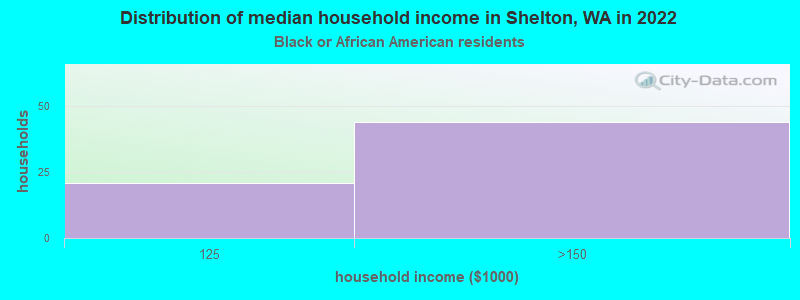
- over $1,000,000Black or African American householders
- $348,618American Indian or Alaska Native householders
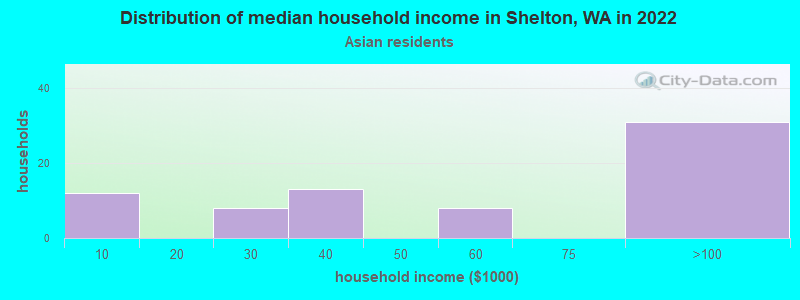
- $364,031Asian householders
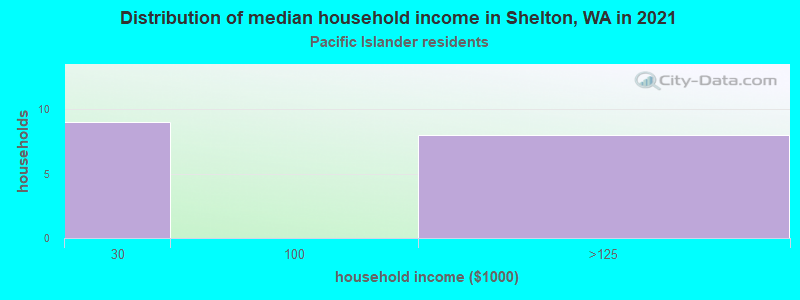
- $596,321Native Hawaiian and other Pacific Islander householders
- $348,618Some other race householders
- $348,618Two or more races householders
- $314,490Hispanic or Latino householders
Household income for White non-Hispanic householders
Household income for Black householders
Household income for American Indian and Alaska Native householders
Household income for Asian householders
Household income for Native Hawaiian and other Pacific Islander householders
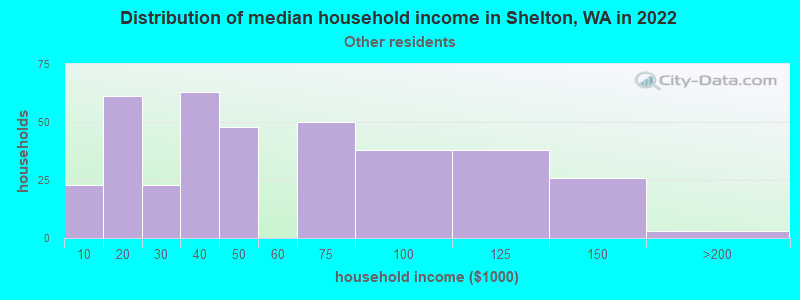
Household income for Some other race householders
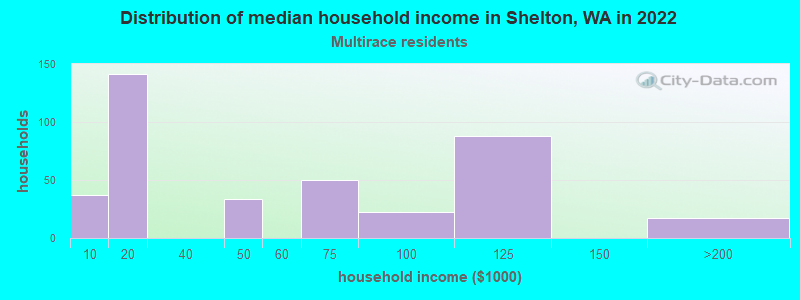
Household income for Two or more races householders
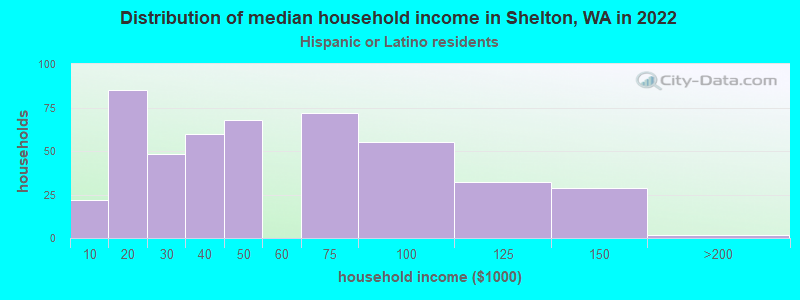
Household income for Hispanic or Latino race householders
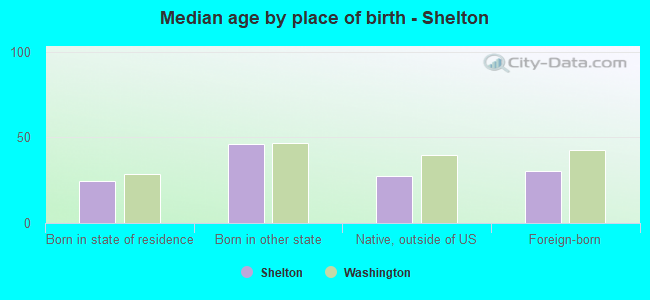
Median age by race in Shelton
- 37.4Median age for White residents
- 36.5Males
- 38.9Females
- 57.2Median age for Black or African American residents
- -693,476,317.4Males
- -860,273,971.7Females
- 13.5Median age for American Indian / Alaska Native residents
- 6.5Males
- 18.4Females
- 67.4Median age for Asian residents
- 36.0Males
- 75.3Females
- 19.7Median age for Native Hawaiian / Pacific Islander residents
- 11.9Males
- 19.6Females
- 16.1Median age for Other race residents
- 16.3Males
- 13.5Females
- 36.7Median age for Two or more races residents
- 31.1Males
- 45.5Females
- 38.4Median age for White alone residents
- 37.9Males
- 39.6Females
- 20.8Median age for Hispanic or Latino residents
- 20.1Males
- 18.2Females
Owner/renter occupied households by race in Shelton
- House owners and renters - White residents
- 1,69867.3%Owner occupied
- 82632.7%Renter occupied
- House owners and renters - Black or African American residents
- 99100.0%Owner occupied
- House owners and renters - American Indian / Alaska Native residents
- 1013.3%Owner occupied
- 6586.7%Renter occupied
- House owners and renters - Asian residents
- 4057.9%Owner occupied
- 2942.1%Renter occupied
- House owners and renters - Native Hawaiian / Pacific Islander residents
- 3884.8%Owner occupied
- 715.2%Renter occupied
- House owners and renters - Other race residents
- 5210.6%Owner occupied
- 44489.4%Renter occupied
- House owners and renters - Two or more races residents
- 7124.1%Owner occupied
- 22375.9%Renter occupied
- House owners and renters - White alone residents
- 1,70767.8%Owner occupied
- 81232.2%Renter occupied
- House owners and renters - Hispanic or Latino residents
- 5710.6%Owner occupied
- 48689.4%Renter occupied
Language usage in Shelton
- English speakers - Total
- 74.6% of residents of Shelton speak English at home.
- 25.8% of residents speak Spanish at home
- 65125.5%Speak English very well
- 1,89774.5%Speak English less than very well
- 5.3% of residents speak other language at home
- 35367.6%Speak English very well
- 16932.4%Speak English less than very well
- English speakers - Born in the United States
- 91.9% of residents of Shelton speak English at home.
- 7.8% of residents speak Spanish at home
- 22989.1%Speak English very well
- 2810.9%Speak English less than very well
- 0.9% of residents speak other language at home
- 31100.0%Speak English very well
- English speakers - Native, born elsewhere
- 37.6% of residents of Shelton speak English at home.
- 51.8% of residents speak Spanish at home
- 7686.4%Speak English very well
- 1213.6%Speak English less than very well
- English speakers - Foreign-born
- 5.1% of residents of Shelton speak English at home.
- 88.4% of residents speak Spanish at home
- 1237.3%Speak English very well
- 1,55692.7%Speak English less than very well
- 16.5% of residents speak other language at home
- 19863.1%Speak English very well
- 11636.9%Speak English less than very well
White (Caucasian) - Speak only English
| Native: | 94.2% (6,303) |
| Foreign-born: | 30.1% (60) |
White (Caucasian) - Speak another language
| Native: | 6.3% (421) |
| Foreign-born: | 79.0% (157) |
Asian - Speak only English
| Native: | 62.6% (8) |
| Foreign-born: | 49.7% (48) |
Asian - Speak another language
| Native: | 37.3% (4) |
| Foreign-born: | 52.3% (51) |
Native Hawaiian / Pacific Islander - Speak another language
| Native: | 100.0% (63) |
| Foreign-born: | 96.0% (84) |
Other race - Speak only English
| Native: | 3.5% (9) |
| Foreign-born: | 0.5% (8) |
Other race - Speak another language
| Native: | 100.0% (269) |
| Foreign-born: | 96.3% (1,517) |
Two or more races - Speak another language
| Native: | 12.1% (116) |
| Foreign-born: | 100.0% (190) |
White alone - Speak only English
| Native: | 97.2% (6,192) |
| Foreign-born: | 73.2% (62) |
White alone - Speak another language
| Native: | 3.4% (217) |
| Foreign-born: | 20.0% (17) |
Hispanic or Latino - Speak only English
| Native: | 21.9% (171) |
| Foreign-born: | 0.8% (14) |
Hispanic or Latino - Speak another language
| Native: | 92.4% (720) |
| Foreign-born: | 98.2% (1,738) |
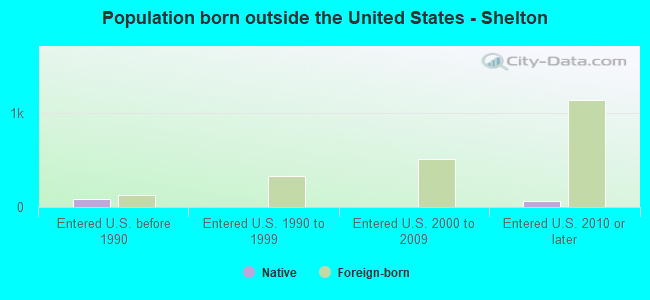
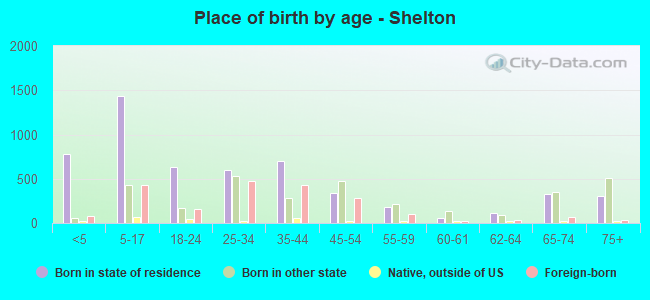
Foreign-born residents in Shelton
1,822 residents are foreign born (14.3% Latin America).
| This city: | 16.8% |
| Washington: | 14.9% |
Marital status for residents in Shelton
Marital status - White (Caucasian) population 15 years and over
- Males
- 45.6%Never married
- 38.0%Now married
- 0.1%Separated
- 3.1%Widowed
- 13.2%Divorced
- Females
- 32.1%Never married
- 31.3%Now married
- 2.8%Separated
- 16.6%Widowed
- 17.1%Divorced
Women who gave birth in the past 12 months
| Now married: | 61.7% (97) |
| Unmarried: | 38.3% (60) |
Women who did not give birth in the past 12 months
| Now married: | 36.5% (537) |
| Unmarried: | 63.5% (933) |
Marital status - Black or African American population 15 years and over
- Males
- 31.2%Never married
- 68.8%Now married
- 0.0%Separated
- 0.0%Widowed
- 0.0%Divorced
- Females
- 20.0%Never married
- 80.0%Now married
- 0.0%Separated
- 0.0%Widowed
- 0.0%Divorced
Women who did not give birth in the past 12 months
| Now married: | 80.0% (24) |
| Unmarried: | 20.0% (6) |
Marital status - American Indian / Alaska Native population 15 years and over
- Males
- 0.0%Never married
- 76.2%Now married
- 11.9%Separated
- 0.0%Widowed
- 11.9%Divorced
- Females
- 45.2%Never married
- 49.2%Now married
- 0.0%Separated
- 0.0%Widowed
- 5.6%Divorced
Women who did not give birth in the past 12 months
| Now married: | 48.6% (64) |
| Unmarried: | 51.4% (67) |
Marital status - Asian population 15 years and over
- Males
- 100.0%Never married
- 0.0%Now married
- 0.0%Separated
- 0.0%Widowed
- 0.0%Divorced
- Females
- 5.3%Never married
- 12.0%Now married
- 0.0%Separated
- 69.3%Widowed
- 13.3%Divorced
Women who did not give birth in the past 12 months
| Now married: | 69.2% (10) |
| Unmarried: | 30.8% (4) |
Marital status - Native Hawaiian / Pacific Islander population 15 years and over
- Males
- 37.5%Never married
- 62.5%Now married
- 0.0%Separated
- 0.0%Widowed
- 0.0%Divorced
- Females
- 44.3%Never married
- 55.7%Now married
- 0.0%Separated
- 0.0%Widowed
- 0.0%Divorced
Women who did not give birth in the past 12 months
| Now married: | 47.8% (34) |
| Unmarried: | 52.2% (38) |
Marital status - Other race population 15 years and over
- Males
- 58.6%Never married
- 32.2%Now married
- 1.3%Separated
- 0.0%Widowed
- 7.9%Divorced
- Females
- 59.3%Never married
- 40.0%Now married
- 0.0%Separated
- 0.0%Widowed
- 0.7%Divorced
Women who gave birth in the past 12 months
| Now married: | 28.8% (20) |
| Unmarried: | 71.2% (49) |
Women who did not give birth in the past 12 months
| Now married: | 37.9% (139) |
| Unmarried: | 62.1% (227) |
Marital status - Two or more races population 15 years and over
- Males
- 56.0%Never married
- 31.2%Now married
- 0.0%Separated
- 0.0%Widowed
- 12.8%Divorced
- Females
- 30.6%Never married
- 18.2%Now married
- 20.4%Separated
- 8.5%Widowed
- 22.3%Divorced
Women who did not give birth in the past 12 months
| Now married: | 43.5% (134) |
| Unmarried: | 56.5% (174) |
Marital status - White alone, not Hispanic / Latino population 15 years and over
- Males
- 43.2%Never married
- 39.2%Now married
- 0.1%Separated
- 3.3%Widowed
- 14.2%Divorced
- Females
- 30.2%Never married
- 31.5%Now married
- 2.9%Separated
- 17.4%Widowed
- 17.9%Divorced
Women who gave birth in the past 12 months
| Now married: | 61.7% (97) |
| Unmarried: | 38.3% (61) |
Women who did not give birth in the past 12 months
| Now married: | 37.6% (514) |
| Unmarried: | 62.4% (853) |
Marital status - Hispanic or Latino population 15 years and over
- Males
- 61.6%Never married
- 32.5%Now married
- 0.8%Separated
- 0.0%Widowed
- 5.1%Divorced
- Females
- 59.3%Never married
- 35.1%Now married
- 0.0%Separated
- 2.9%Widowed
- 2.7%Divorced
Women who gave birth in the past 12 months
| Now married: | 28.8% (18) |
| Unmarried: | 71.2% (43) |
Women who did not give birth in the past 12 months
| Now married: | 34.6% (215) |
| Unmarried: | 65.4% (407) |
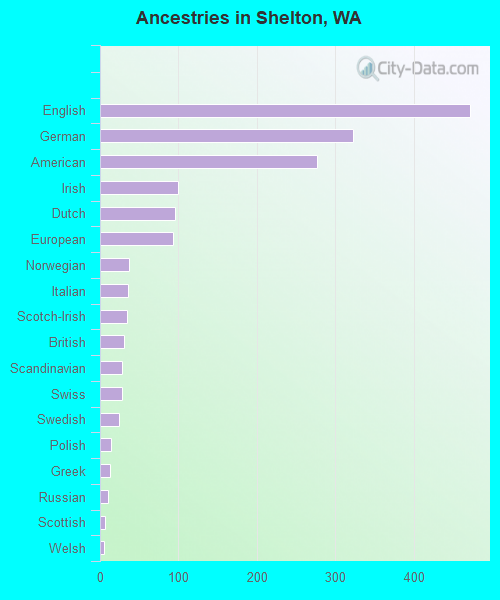
Ancestries in Shelton

- 47210.2%English
- 3226.9%German
- 2765.9%American
- 1002.2%Irish
- 952.0%Dutch
- 932.0%European
- 370.8%Norwegian
- 360.8%Italian
- 340.7%Scotch-Irish
- 300.6%British
- 280.6%Scandinavian
- 280.6%Swiss
- 240.5%Swedish
- 140.3%Polish
- 130.3%Greek
- 100.2%Russian
- 70.2%Scottish
- 50.1%Welsh
- 40.09%French Canadian
- 20.04%Danish
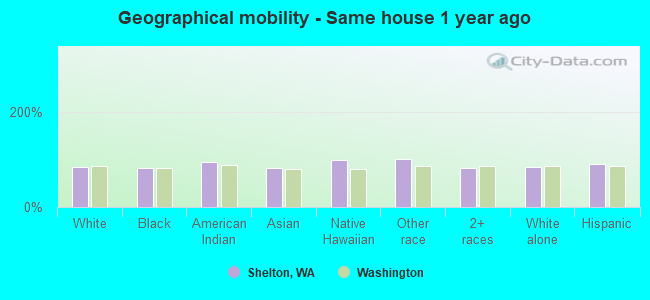
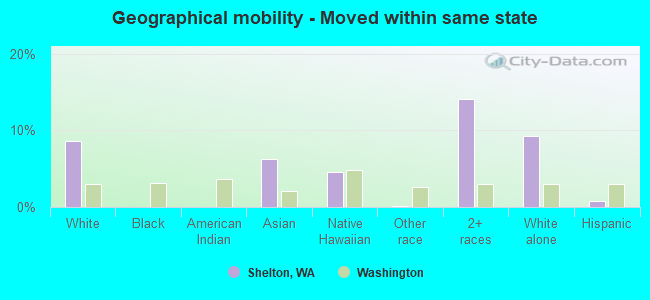
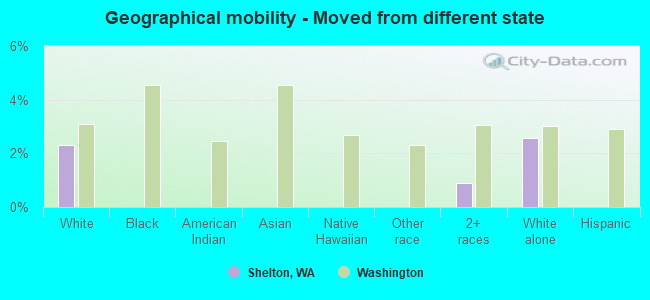
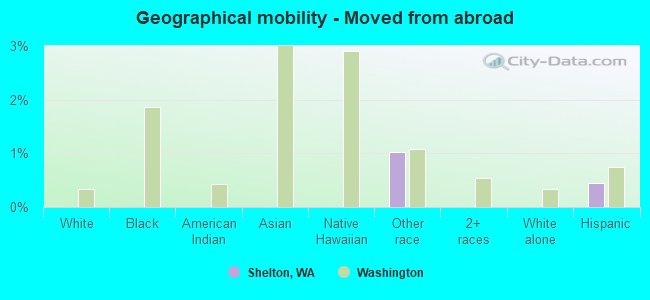
Geographical mobility in Shelton

- Same house 1 year ago
- 5,91083.6%White (Caucasian)
- 6682.4%Black or African American
- 27994.5%American Indian / Alaska Native
- 9082.0%Asian
- 17399.1%Native Hawaiian / Pacific Islander
- 1,717100.0%Other race
- 1,05280.7%Two or more races
- 5,48682.7%White alone, not Hispanic / Latino
- 2,60090.8%Hispanic or Latino
-
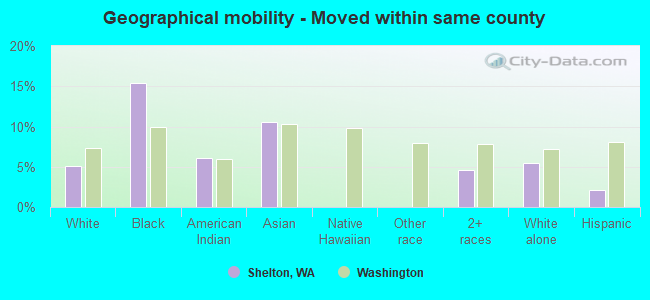
- Moved within same county
- 3595.1%White / Caucasian
- 1215.4%Black or African American
- 186.1%American Indian / Alaska Native
- 1210.6%Asian
- 10.0%Other race
- 594.6%Two or more races
- 3665.5%White alone, not Hispanic / Latino
- 612.1%Hispanic or Latino
-
- Moved within same state
- 6118.7%White / Caucasian
- 76.2%Asian
- 84.6%Native Hawaiian / Pacific Islander
- 30.2%Other race
- 18314.0%Two or more races
- 6189.3%White alone, not Hispanic / Latino
- 210.7%Hispanic or Latino
-
- Moved from different state
- 1642.3%White / Caucasian
- 110.9%Two or more races
- 1722.6%White alone, not Hispanic / Latino
-
- Moved from abroad
- 171.0%Other race
- 130.5%Hispanic or Latino
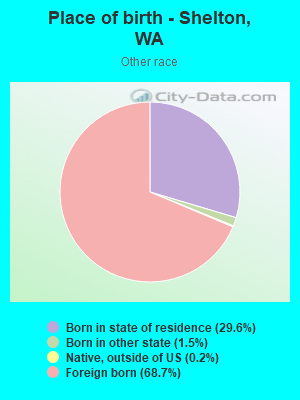
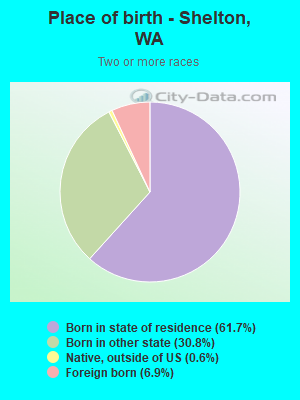
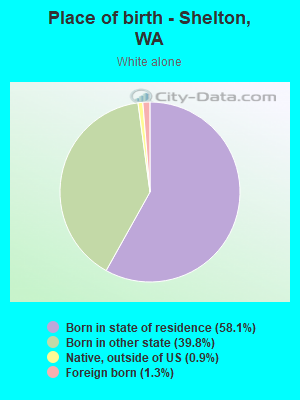
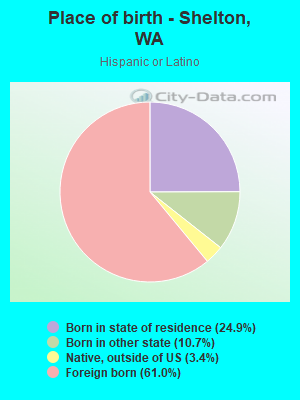
Children Nativity (place of birth) in Shelton
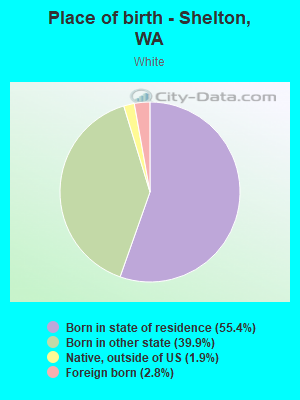
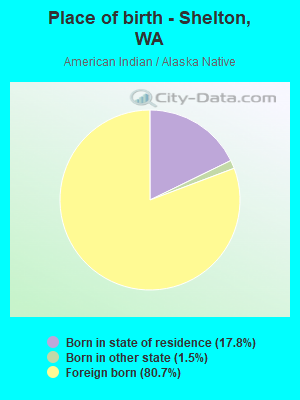
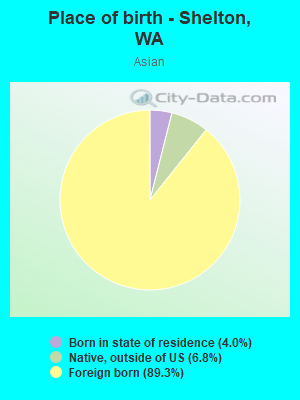
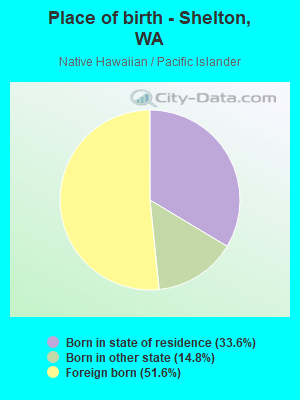
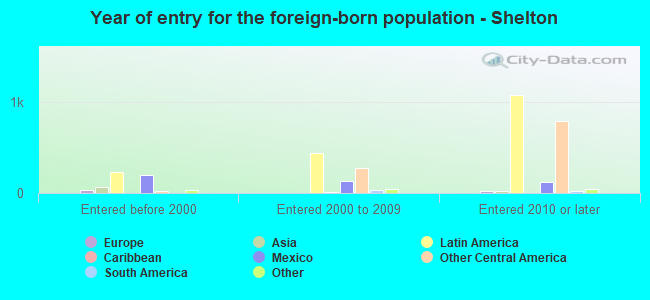
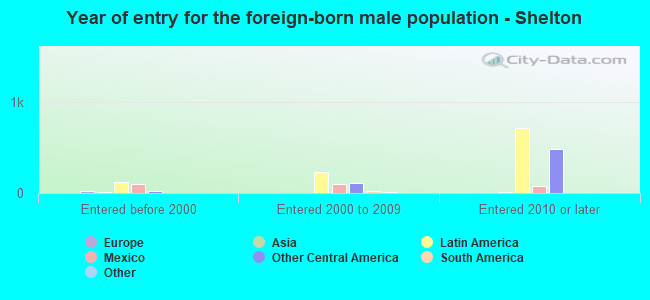
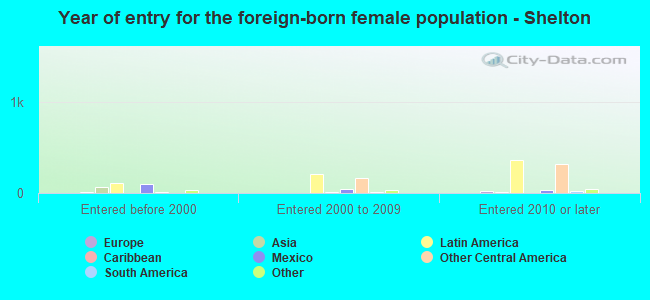
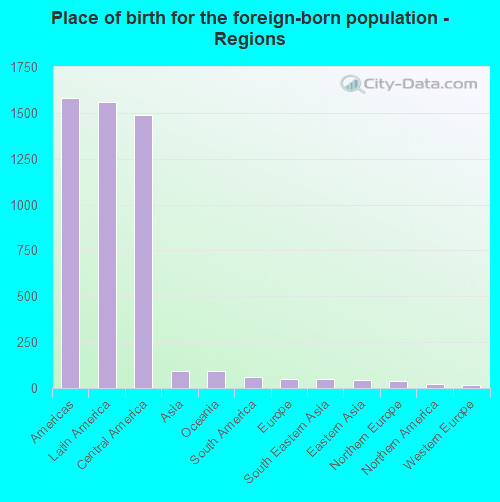
Place of birth for residents in Shelton
![Place of birth for the foreign-born population - Regions]()
- 1,583Americas
- 1,561Latin America
- 1,487Central America
- 94Asia
- 92Oceania
- 61South America
- 51Europe
- 50South Eastern Asia
- 43Eastern Asia
- 36Northern Europe
- 22Northern America
- 15Western Europe
- 12Caribbean
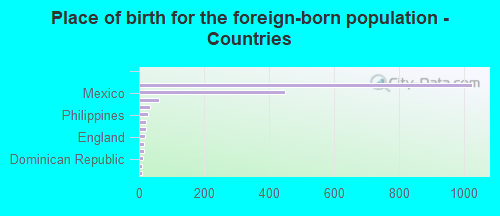
![Place of birth for the foreign-born population - Countries]()
- 1,026Guatemala
- 450Mexico
- 61Colombia
- 33Korea
- 28Philippines
- 22Vietnam
- 22Canada
- 20England
- 15United Kingdom
- 15Germany
- 12Dominican Republic
- 10Japan
- 10Panama
Grandparents responsible for own grandchildren in Shelton
Zip codes: 98584.