Races in Sharon, Pennsylvania (PA) Detailed Stats
Ancestries, Foreign-born residents, place of birth
Settings
X


Recent posts about races in Sharon, Pennsylvania on our local forum with over 2,400,000 registered users:
 | Local Entertainer Sharon Needles Cast on "RuPaul's Drag Race" (136 replies) |
| living in Sharon, PA inquiry (5 replies) |
| A field guide to Pittsburgh houses (46 replies) |
| Downtown Holiday Shopping. (27 replies) |
| Western Pennsylvania (Sharon and Ambridge) (6 replies) |
| Gay couple finally moving to PA! (94 replies) |
Latest news about races in Sharon, PA collected exclusively by city-data.com from local newspapers, TV, and radio stations
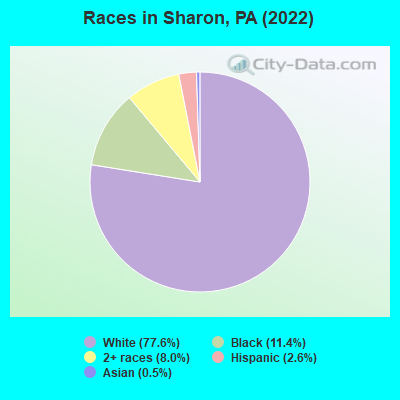
According to 2022 data, the most numerous races in Sharon, PA are White alone (10,071 residents), Black alone (1,483 residents), and Hispanic (335 residents). 97.1% of Sharon residents speak English at home. 2.9% of Sharon, PA residents are foreign-born (1.5% born in Europe, 0.7% born in Latin America, 0.3% born in North America), which is 140.4% less than the foreign-born rate of 7.0% across the entire state of Pennsylvania.
Race distribution in Sharon
2000
2022

- 14,02885.9%White alone
- 1,76410.8%Black alone
- 3041.9%Two or more races
- 1440.9%Hispanic
- 320.2%Asian alone
- 290.2%American Indian alone
- 230.1%Other race alone
- 40.02%Native Hawaiian and Other
Pacific Islander alone

-
- 10,07177.6%White alone
- 1,48311.4%Black alone
- 1,0388.0%Two or more races
- 3352.6%Hispanic
- 600.5%Asian alone
- 110.08%American Indian alone
2000
2022
-
- 10,322,45584.1%White alone
- 1,202,4379.8%Black alone
- 394,0883.2%Hispanic
- 218,2961.8%Asian alone
- 113,0970.9%Two or more races
- 13,0860.1%Other race alone
- 14,9040.1%American Indian alone
- 2,6910.02%Native Hawaiian and Other
Pacific Islander alone

-
- 9,487,22873.1%White alone
- 1,311,58110.1%Black alone
- 1,115,9978.6%Hispanic
- 493,9423.8%Two or more races
- 487,1243.8%Asian alone
- 63,5820.5%Other race alone
- 10,1300.08%American Indian alone
- 2,4240.02%Native Hawaiian and Other
Pacific Islander alone

Income and house value in Sharon
- Median household income in 2022
- $42,907White non-Hispanic householders
- $28,190Black householders
- $25,338Some other race householders
- $46,682Two or more races householders
- Median 2022 house value
- $78,050White Non-Hispanic householders
- $46,222Black or African American householders
- $151,942Asian householders
- $51,980Some other race householders
- $61,256Two or more races householders
- $59,017Hispanic or Latino householders
Household income for White non-Hispanic householders

Household income for Black householders

Household income for Asian householders

Household income for Some other race householders

Household income for Two or more races householders

Household income for Hispanic or Latino race householders

Median age by race in Sharon
- 46.8Median age for White residents
- 43.1Males
- 50.2Females
- 29.7Median age for Black or African American residents
- 39.6Males
- 35.5Females
- -809,427,608.6Median age for American Indian / Alaska Native residents
- -714,583,332.6Males
- -669,972,451.1Females
- 55.1Median age for Asian residents
- -680,115,273.1Males
- 55.3Females
- -680,432,644.4Median age for Native Hawaiian / Pacific Islander residents
- -666,666,666.0Males
- -747,474,746.7Females
- 33.5Median age for Other race residents
- -673,355,629.2Males
- 59.1Females
- 20.5Median age for Two or more races residents
- 27.5Males
- 10.4Females
- 47.0Median age for White alone residents
- 43.1Males
- 50.2Females
- 22.4Median age for Hispanic or Latino residents
- 18.3Males
- 24.1Females
Owner/renter occupied households by race in Sharon
- House owners and renters - White residents
- 3,20567.7%Owner occupied
- 1,53132.3%Renter occupied
- House owners and renters - Black or African American residents
- 719.3%Owner occupied
- 69190.7%Renter occupied
- House owners and renters - American Indian / Alaska Native residents
- 9100.0%Renter occupied
- House owners and renters - Asian residents
- 21100.0%Owner occupied
- House owners and renters - Other race residents
- 2571.5%Owner occupied
- 1028.5%Renter occupied
- House owners and renters - Two or more races residents
- 14640.8%Owner occupied
- 21259.2%Renter occupied
- House owners and renters - White alone residents
- 3,20867.9%Owner occupied
- 1,51632.1%Renter occupied
- House owners and renters - Hispanic or Latino residents
- 9452.9%Owner occupied
- 8447.1%Renter occupied
Language usage in Sharon
- English speakers - Total
- 97.1% of residents of Sharon speak English at home.
- 1.0% of residents speak Spanish at home
- 5241.3%Speak English very well
- 7458.7%Speak English less than very well
- 1.5% of residents speak other language at home
- 9651.6%Speak English very well
- 9048.4%Speak English less than very well
- English speakers - Born in the United States
- 98.6% of residents of Sharon speak English at home.
- 1.0% of residents speak Spanish at home
- 25100.0%Speak English very well
- 1.2% of residents speak other language at home
- 31100.0%Speak English very well
- English speakers - Native, born elsewhere
- 68.0% of residents of Sharon speak English at home.
- 7.2% of residents speak Spanish at home
- 7100.0%Speak English less than very well
- English speakers - Foreign-born
- 62.5% of residents of Sharon speak English at home.
- 17.5% of residents speak Spanish at home
- 63100.0%Speak English less than very well
- 19.7% of residents speak other language at home
- 79.9%Speak English very well
- 6490.1%Speak English less than very well
White (Caucasian) - Speak only English
| Native: | 98.5% (9,288) |
| Foreign-born: | 53.3% (108) |
White (Caucasian) - Speak another language
| Native: | 1.2% (116) |
| Foreign-born: | 45.3% (92) |
Black or African American - Speak another language
| Native: | 0.2% (4) |
| Foreign-born: | 91.9% (15) |
Other race - Speak another language
| Native: | 73.6% (27) |
| Foreign-born: | 100.0% (37) |
Two or more races - Speak only English
| Native: | 97.5% (733) |
| Foreign-born: | 82.8% (48) |
White alone - Speak only English
| Native: | 98.5% (9,273) |
| Foreign-born: | 54.9% (109) |
White alone - Speak another language
| Native: | 1.2% (116) |
| Foreign-born: | 42.5% (84) |
Hispanic or Latino - Speak only English
| Native: | 79.4% (109) |
| Foreign-born: | 34.4% (38) |
Hispanic or Latino - Speak another language
| Native: | 21.4% (29) |
| Foreign-born: | 63.2% (70) |
Foreign-born residents in Sharon
378 residents are foreign born (1.5% Europe, 0.7% Latin America, 0.3% North America).
| This city: | 2.9% |
| Pennsylvania: | 7.3% |


Marital status for residents in Sharon
Marital status - White (Caucasian) population 15 years and over
- Males
- 42.6%Never married
- 44.6%Now married
- 1.8%Separated
- 1.0%Widowed
- 10.0%Divorced
- Females
- 30.1%Never married
- 37.4%Now married
- 2.3%Separated
- 12.8%Widowed
- 17.4%Divorced
Women who gave birth in the past 12 months
| Now married: | 46.2% (65) |
| Unmarried: | 53.8% (75) |
Women who did not give birth in the past 12 months
| Now married: | 34.8% (704) |
| Unmarried: | 65.2% (1,318) |
Marital status - Black or African American population 15 years and over
- Males
- 62.9%Never married
- 21.3%Now married
- 8.2%Separated
- 4.3%Widowed
- 3.4%Divorced
- Females
- 70.1%Never married
- 7.7%Now married
- 15.3%Separated
- 2.1%Widowed
- 4.8%Divorced
Women who gave birth in the past 12 months
| Now married: | 0.0% (0) |
| Unmarried: | 100.0% (74) |
Women who did not give birth in the past 12 months
| Now married: | 37.2% (153) |
| Unmarried: | 62.8% (258) |
Marital status - American Indian / Alaska Native population 15 years and over
- Males
- 100.0%Never married
- 0.0%Now married
- 0.0%Separated
- 0.0%Widowed
- 0.0%Divorced
- Females
- 0.0%Never married
- 100.0%Now married
- 0.0%Separated
- 0.0%Widowed
- 0.0%Divorced
Marital status - Other race population 15 years and over
- Males
- 0.0%Never married
- 100.0%Now married
- 0.0%Separated
- 0.0%Widowed
- 0.0%Divorced
- Females
- 0.0%Never married
- 67.9%Now married
- 0.0%Separated
- 0.0%Widowed
- 32.1%Divorced
Women who did not give birth in the past 12 months
| Now married: | 100.0% (9) |
| Unmarried: | 0.0% (0) |
Marital status - Two or more races population 15 years and over
- Males
- 31.2%Never married
- 32.8%Now married
- 0.0%Separated
- 3.7%Widowed
- 32.3%Divorced
- Females
- 26.4%Never married
- 34.2%Now married
- 0.0%Separated
- 0.0%Widowed
- 39.4%Divorced
Women who gave birth in the past 12 months
| Now married: | 0.0% (0) |
| Unmarried: | 100.0% (27) |
Women who did not give birth in the past 12 months
| Now married: | 61.0% (70) |
| Unmarried: | 39.0% (45) |
Marital status - White alone, not Hispanic / Latino population 15 years and over
- Males
- 42.1%Never married
- 45.0%Now married
- 1.8%Separated
- 1.1%Widowed
- 10.1%Divorced
- Females
- 30.1%Never married
- 37.6%Now married
- 2.3%Separated
- 12.6%Widowed
- 17.5%Divorced
Women who gave birth in the past 12 months
| Now married: | 47.5% (64) |
| Unmarried: | 52.5% (71) |
Women who did not give birth in the past 12 months
| Now married: | 34.9% (700) |
| Unmarried: | 65.1% (1,304) |
Marital status - Hispanic or Latino population 15 years and over
- Males
- 35.6%Never married
- 25.6%Now married
- 0.0%Separated
- 0.0%Widowed
- 38.9%Divorced
- Females
- 45.6%Never married
- 28.9%Now married
- 0.0%Separated
- 15.6%Widowed
- 10.0%Divorced
Women who gave birth in the past 12 months
| Now married: | 0.0% (0) |
| Unmarried: | 100.0% (18) |
Women who did not give birth in the past 12 months
| Now married: | 70.0% (15) |
| Unmarried: | 30.0% (6) |
Ancestries in Sharon

- 1,18921.7%American
- 4949.0%Italian
- 4588.4%Irish
- 4327.9%German
- 1823.3%Polish
- 1803.3%English
- 1612.9%Slovak
- 1432.6%Hungarian
- 1172.1%Serbian
- 891.6%Scottish
- 831.5%Bulgarian
- 551.0%Croatian
- 420.8%European
- 300.5%Canadian
- 240.4%Syrian
- 230.4%Eastern European
- 180.3%Slovene
- 180.3%Welsh
- 150.3%French
- 150.3%Scotch-Irish
- 120.2%Swedish
- 120.2%Ukrainian
- 110.2%Northern European
- 80.1%Norwegian
- 70.1%Russian
- 70.1%West Indian
- 60.1%Scandinavian
- 20.04%British

Geographical mobility in Sharon

- Same house 1 year ago
- 9,36293.5%White (Caucasian)
- 1,19880.7%Black or African American
- 1599.6%American Indian / Alaska Native
- 43100.0%Asian
- 5171.5%Other race
- 84181.5%Two or more races
- 9,35493.6%White alone, not Hispanic / Latino
- 26686.0%Hispanic or Latino

-
- Moved within same county
- 4324.3%White / Caucasian
- 885.9%Black or African American
- 11811.4%Two or more races
- 4284.3%White alone, not Hispanic / Latino
- 41.2%Hispanic or Latino

-
- Moved within same state
- 890.9%White / Caucasian
- 191.8%Two or more races
- 930.9%White alone, not Hispanic / Latino

-
- Moved from different state
- 1561.6%White / Caucasian
- 24816.7%Black or African American
- 2332.3%Other race
- 525.0%Two or more races
- 1441.4%White alone, not Hispanic / Latino
- 11035.7%Hispanic or Latino

Children Nativity (place of birth) in Sharon
Place of birth for residents in Sharon
![Place of birth for the foreign-born population - Regions]()
- 207Europe
- 139Americas
- 135Eastern Europe
- 97Latin America
- 97Caribbean
- 54Southern Europe
- 41Northern America
- 31Asia
- 31South Eastern Asia
- 18Western Europe

![Place of birth for the foreign-born population - Countries]()
- 64Dominican Republic
- 54Italy
- 41Canada
- 33Bulgaria
- 33Cuba
- 31Philippines
- 18Germany
- 7Hungary

Grandparents responsible for own grandchildren in Sharon
Zip codes: 16146.