Races in Severna Park, Maryland (MD) Detailed Stats
Data:
Races - White alone (%)
Races - White alone (% change since 2000)
Races - Black alone (%)
Races - Black alone (% change since 2000)
Races - American Indian alone (%)
Races - American Indian alone (% change since 2000)
Races - Asian alone (%)
Races - Asian alone (% change since 2000)
Races - Hispanic (%)
Races - Hispanic (% change since 2000)
Races - Native Hawaiian and Other Pacific Islander alone (%)
Races - Native Hawaiian and Other Pacific Islander alone (% change since 2000)
Races - Two or more races(%)
Races - Two or more races(% change since 2000)
Races - Other race alone (%)
Races - Other race alone (% change since 2000)
Racial diversity
Place of birth - Born in state of residence (%)
Place of birth - Born in state of residence (%) - White
Place of birth - Born in state of residence (%) - Black or African American
Place of birth - Born in state of residence (%) - Asian
Place of birth - Born in state of residence (%) - Hispanic or Latino
Place of birth - Born in state of residence (%) - American Indian and Alaska Native
Place of birth - Born in state of residence (%) - Multirace
Place of birth - Born in state of residence (%) - Other Race
Place of birth - Born in other state (%)
Place of birth - Born in other state (%) - White
Place of birth - Born in other state (%) - Black or African American
Place of birth - Born in other state (%) - Asian
Place of birth - Born in other state (%) - Hispanic or Latino
Place of birth - Born in other state (%) - American Indian and Alaska Native
Place of birth - Born in other state (%) - Multirace
Place of birth - Born in other state (%) - Other Race
Place of birth - Native, outside of US (%)
Place of birth - Native, outside of US (%) - White
Place of birth - Native, outside of US (%) - Black or African American
Place of birth - Native, outside of US (%) - Asian
Place of birth - Native, outside of US (%) - Hispanic or Latino
Place of birth - Native, outside of US (%) - American Indian and Alaska Native
Place of birth - Native, outside of US (%) - Multirace
Place of birth - Native, outside of US (%) - Other Race
Place of birth - Foreign born (%)
Place of birth - Foreign born (%) - White
Place of birth - Foreign born (%) - Black or African American
Place of birth - Foreign born (%) - Asian
Place of birth - Foreign born (%) - Hispanic or Latino
Place of birth - Foreign born (%) - American Indian and Alaska Native
Place of birth - Foreign born (%) - Multirace
Place of birth - Foreign born (%) - Other Race
Residents speaking English at home (%)
Residents speaking English at home - Born in the United States (%)
Residents speaking English at home - Native, born elsewhere (%)
Residents speaking English at home - Foreign born (%)
Residents speaking Spanish at home (%)
Residents speaking Spanish at home - Born in the United States (%)
Residents speaking Spanish at home - Native, born elsewhere (%)
Residents speaking Spanish at home - Foreign born (%)
Residents speaking other language at home (%)
Residents speaking other language at home - Born in the United States (%)
Residents speaking other language at home - Native, born elsewhere (%)
Residents speaking other language at home - Foreign born (%)
Marital status - Never married (%)
Marital status - Now married (%)
Marital status - Separated (%)
Marital status - Widowed (%)
Marital status - Divorced (%)
Ancestries Reported - Arab (%)
Ancestries Reported - Czech (%)
Ancestries Reported - Danish (%)
Ancestries Reported - Dutch (%)
Ancestries Reported - English (%)
Ancestries Reported - French (%)
Ancestries Reported - French Canadian (%)
Ancestries Reported - German (%)
Ancestries Reported - Greek (%)
Ancestries Reported - Hungarian (%)
Ancestries Reported - Irish (%)
Ancestries Reported - Italian (%)
Ancestries Reported - Lithuanian (%)
Ancestries Reported - Norwegian (%)
Ancestries Reported - Polish (%)
Ancestries Reported - Portuguese (%)
Ancestries Reported - Russian (%)
Ancestries Reported - Scotch-Irish (%)
Ancestries Reported - Scottish (%)
Ancestries Reported - Slovak (%)
Ancestries Reported - Subsaharan African (%)
Ancestries Reported - Swedish (%)
Ancestries Reported - Swiss (%)
Ancestries Reported - Ukrainian (%)
Ancestries Reported - United States (%)
Ancestries Reported - Welsh (%)
Ancestries Reported - West Indian (%)
Ancestries Reported - Other (%)
Geographical mobility - Same house 1 year ago (%)
Geographical mobility - Same house 1 year ago (%) - White
Geographical mobility - Same house 1 year ago (%) - Black or African American
Geographical mobility - Same house 1 year ago (%) - Asian
Geographical mobility - Same house 1 year ago (%) - Hispanic or Latino
Geographical mobility - Same house 1 year ago (%) - American Indian and Alaska Native
Geographical mobility - Same house 1 year ago (%) - Multirace
Geographical mobility - Same house 1 year ago (%) - Other Race
Geographical mobility - Moved within same county (%)
Geographical mobility - Moved within same county (%) - White
Geographical mobility - Moved within same county (%) - Black or African American
Geographical mobility - Moved within same county (%) - Asian
Geographical mobility - Moved within same county (%) - Hispanic or Latino
Geographical mobility - Moved within same county (%) - American Indian and Alaska Native
Geographical mobility - Moved within same county (%) - Multirace
Geographical mobility - Moved within same county (%) - Other Race
Geographical mobility - Moved from different county within same state (%)
Geographical mobility - Moved from different county within same state (%) - White
Geographical mobility - Moved from different county within same state (%) - Black or African American
Geographical mobility - Moved from different county within same state (%) - Asian
Geographical mobility - Moved from different county within same state (%) - Hispanic or Latino
Geographical mobility - Moved from different county within same state (%) - American Indian and Alaska Native
Geographical mobility - Moved from different county within same state (%) - Multirace
Geographical mobility - Moved from different county within same state (%) - Other Race
Geographical mobility - Moved from different state (%)
Geographical mobility - Moved from different state (%) - White
Geographical mobility - Moved from different state (%) - Black or African American
Geographical mobility - Moved from different state (%) - Asian
Geographical mobility - Moved from different state (%) - Hispanic or Latino
Geographical mobility - Moved from different state (%) - American Indian and Alaska Native
Geographical mobility - Moved from different state (%) - Multirace
Geographical mobility - Moved from different state (%) - Other Race
Geographical mobility - Moved from abroad (%)
Geographical mobility - Moved from abroad (%) - White
Geographical mobility - Moved from abroad (%) - Black or African American
Geographical mobility - Moved from abroad (%) - Asian
Geographical mobility - Moved from abroad (%) - Hispanic or Latino
Geographical mobility - Moved from abroad (%) - American Indian and Alaska Native
Geographical mobility - Moved from abroad (%) - Multirace
Geographical mobility - Moved from abroad (%) - Other Race
Place of birth for the foreign-born population - Ireland (%)
Place of birth for the foreign-born population - Denmark (%)
Place of birth for the foreign-born population - Norway (%)
Place of birth for the foreign-born population - Sweden (%)
Place of birth for the foreign-born population - United Kingdom (%)
Place of birth for the foreign-born population - England (%)
Place of birth for the foreign-born population - Scotland (%)
Place of birth for the foreign-born population - Other Northern Europe (%)
Place of birth for the foreign-born population - Austria (%)
Place of birth for the foreign-born population - Belgium (%)
Place of birth for the foreign-born population - France (%)
Place of birth for the foreign-born population - Germany (%)
Place of birth for the foreign-born population - Netherlands (%)
Place of birth for the foreign-born population - Switzerland (%)
Place of birth for the foreign-born population - Other Western Europe (%)
Place of birth for the foreign-born population - Greece (%)
Place of birth for the foreign-born population - Italy (%)
Place of birth for the foreign-born population - Portugal (%)
Place of birth for the foreign-born population - Spain (%)
Place of birth for the foreign-born population - Other Southern Europe (%)
Place of birth for the foreign-born population - Albania (%)
Place of birth for the foreign-born population - Belarus (%)
Place of birth for the foreign-born population - Bosnia and Herzegovina (%)
Place of birth for the foreign-born population - Bulgaria (%)
Place of birth for the foreign-born population - Croatia (%)
Place of birth for the foreign-born population - Czechoslovakia (%)
Place of birth for the foreign-born population - Hungary (%)
Place of birth for the foreign-born population - Latvia (%)
Place of birth for the foreign-born population - Lithuania (%)
Place of birth for the foreign-born population - North Macedonia (Macedonia) (%)
Place of birth for the foreign-born population - Moldova (%)
Place of birth for the foreign-born population - Poland (%)
Place of birth for the foreign-born population - Romania (%)
Place of birth for the foreign-born population - Russia (%)
Place of birth for the foreign-born population - Serbia (%)
Place of birth for the foreign-born population - Ukraine (%)
Place of birth for the foreign-born population - Other Eastern Europe (%)
Place of birth for the foreign-born population - China (%)
Place of birth for the foreign-born population - Hong Kong (%)
Place of birth for the foreign-born population - Taiwan (%)
Place of birth for the foreign-born population - Japan (%)
Place of birth for the foreign-born population - Korea (%)
Place of birth for the foreign-born population - Other Eastern Asia (%)
Place of birth for the foreign-born population - Afghanistan (%)
Place of birth for the foreign-born population - Bangladesh (%)
Place of birth for the foreign-born population - India (%)
Place of birth for the foreign-born population - Iran (%)
Place of birth for the foreign-born population - Kazakhstan (%)
Place of birth for the foreign-born population - Nepal (%)
Place of birth for the foreign-born population - Pakistan (%)
Place of birth for the foreign-born population - Sri Lanka (%)
Place of birth for the foreign-born population - Uzbekistan (%)
Place of birth for the foreign-born population - Other South Central Asia (%)
Place of birth for the foreign-born population - Burma (%)
Place of birth for the foreign-born population - Cambodia (%)
Place of birth for the foreign-born population - Indonesia (%)
Place of birth for the foreign-born population - Laos (%)
Place of birth for the foreign-born population - Malaysia (%)
Place of birth for the foreign-born population - Philippines (%)
Place of birth for the foreign-born population - Singapore (%)
Place of birth for the foreign-born population - Thailand (%)
Place of birth for the foreign-born population - Vietnam (%)
Place of birth for the foreign-born population - Other South Eastern Asia (%)
Place of birth for the foreign-born population - Armenia (%)
Place of birth for the foreign-born population - Iraq (%)
Place of birth for the foreign-born population - Israel (%)
Place of birth for the foreign-born population - Jordan (%)
Place of birth for the foreign-born population - Kuwait (%)
Place of birth for the foreign-born population - Lebanon (%)
Place of birth for the foreign-born population - Saudi Arabia (%)
Place of birth for the foreign-born population - Syria (%)
Place of birth for the foreign-born population - Turkey (%)
Place of birth for the foreign-born population - Yemen (%)
Place of birth for the foreign-born population - Other Western Asia (%)
Place of birth for the foreign-born population - Eritrea (%)
Place of birth for the foreign-born population - Ethiopia (%)
Place of birth for the foreign-born population - Kenya (%)
Place of birth for the foreign-born population - Somalia (%)
Place of birth for the foreign-born population - Uganda (%)
Place of birth for the foreign-born population - Zimbabwe (%)
Place of birth for the foreign-born population - Other Eastern Africa (%)
Place of birth for the foreign-born population - Cameroon (%)
Place of birth for the foreign-born population - Congo (%)
Place of birth for the foreign-born population - Democratic Republic of Congo (Zaire) (%)
Place of birth for the foreign-born population - Other Middle Africa (%)
Place of birth for the foreign-born population - Egypt (%)
Place of birth for the foreign-born population - Morocco (%)
Place of birth for the foreign-born population - Sudan (%)
Place of birth for the foreign-born population - Other Northern Africa (%)
Place of birth for the foreign-born population - South Africa (%)
Place of birth for the foreign-born population - Other Southern Africa (%)
Place of birth for the foreign-born population - Cabo Verde (%)
Place of birth for the foreign-born population - Ghana (%)
Place of birth for the foreign-born population - Liberia (%)
Place of birth for the foreign-born population - Nigeria (%)
Place of birth for the foreign-born population - Senegal (%)
Place of birth for the foreign-born population - Sierra Leone (%)
Place of birth for the foreign-born population - Other Western Africa (%)
Place of birth for the foreign-born population - Australia (%)
Place of birth for the foreign-born population - New Zealand (%)
Place of birth for the foreign-born population - Fiji (%)
Place of birth for the foreign-born population - Micronesia (%)
Place of birth for the foreign-born population - Bahamas (%)
Place of birth for the foreign-born population - Barbados (%)
Place of birth for the foreign-born population - Cuba (%)
Place of birth for the foreign-born population - Dominica (%)
Place of birth for the foreign-born population - Dominican Republic (%)
Place of birth for the foreign-born population - Grenada (%)
Place of birth for the foreign-born population - Haiti (%)
Place of birth for the foreign-born population - Jamaica (%)
Place of birth for the foreign-born population - St. Vincent and the Grenadines (%)
Place of birth for the foreign-born population - Trinidad and Tobago (%)
Place of birth for the foreign-born population - West Indies (%)
Place of birth for the foreign-born population - Other Caribbean (%)
Place of birth for the foreign-born population - Belize (%)
Place of birth for the foreign-born population - Costa Rica (%)
Place of birth for the foreign-born population - El Salvador (%)
Place of birth for the foreign-born population - Guatemala (%)
Place of birth for the foreign-born population - Honduras (%)
Place of birth for the foreign-born population - Mexico (%)
Place of birth for the foreign-born population - Nicaragua (%)
Place of birth for the foreign-born population - Panama (%)
Place of birth for the foreign-born population - Other Central America (%)
Place of birth for the foreign-born population - Argentina (%)
Place of birth for the foreign-born population - Bolivia (%)
Place of birth for the foreign-born population - Brazil (%)
Place of birth for the foreign-born population - Chile (%)
Place of birth for the foreign-born population - Colombia (%)
Place of birth for the foreign-born population - Ecuador (%)
Place of birth for the foreign-born population - Guyana (%)
Place of birth for the foreign-born population - Peru (%)
Place of birth for the foreign-born population - Uruguay (%)
Place of birth for the foreign-born population - Venezuela (%)
Place of birth for the foreign-born population - Other South America (%)
Place of birth for the foreign-born population - Canada (%)
Place of birth for the foreign-born population - Other Northern America (%)
Place of birth for the foreign-born population - Other (%)
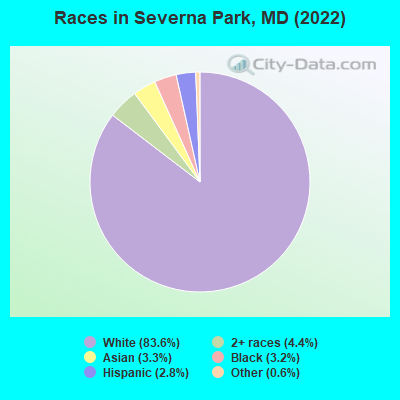
According to 2022 data, the most numerous races in Severna Park, MD are White alone (34,129 residents), Black alone (1,295 residents), and Hispanic (1,149 residents). 93.6% of Severna Park residents speak English at home. 5.0% of Severna Park, MD residents are foreign-born (1.9% born in Asia, 1.3% born in Europe, 1.0% born in Latin America), which is 218.7% less than the foreign-born rate of 16.0% across the entire state of Maryland.
Race distribution in Severna Park
2000 2022
3,286,547 62.1% White alone 1,464,735 27.7% Black alone 227,916 4.3% Hispanic 209,738 4.0% Asian alone 82,946 1.6% Two or more races 13,312 0.3% American Indian alone 9,379 0.2% Other race alone 1,913 0.04% Native Hawaiian and Other
2,906,492 47.1% White alone 1,800,914 29.2% Black alone 705,842 11.4% Hispanic 401,818 6.5% Asian alone 291,317 4.7% Two or more races 46,930 0.8% Other race alone 8,930 0.1% American Indian alone 2,417 0.04% Native Hawaiian and Other
Income and house value in Severna Park Median household income in 2022 $167,324 White non-Hispanic householders$73,360 Black householders$129,108 Asian householders$148,613 Some other race householdersover $200,000 Two or more races householdersover $200,000 Hispanic or Latino race householdersMedian 2022 house value $650,179 White Non-Hispanic householders$534,960 Black or African American householders$306,431 American Indian or Alaska Native householders $835,672 Asian householders$306,431 Native Hawaiian and other Pacific Islander householders$612,862 Some other race householders$424,373 Two or more races householders$528,696 Hispanic or Latino householders
Median age by race in Severna Park
43.3 Median age for White residents41.0 45.9 46.6 Median age for Black or African American residents38.1 53.6 -836,842,104.4 Median age for American Indian / Alaska Native residents-674,418,604.0 -1,072,276,158.6 42.5 Median age for Asian residents49.0 41.0 -534,101,824.6 Median age for Native Hawaiian / Pacific Islander residents-720,061,021.4 -760,942,760.2 59.9 Median age for Other race residents60.9 57.9 15.6 Median age for Two or more races residents19.7 13.3 42.9 Median age for White alone residents40.4 45.5 23.2 Median age for Hispanic or Latino residents23.1 23.6
Owner/renter occupied households by race in Severna Park
House owners and renters - White residents 11,169 91.7% Owner occupied1,006 8.3% Renter occupiedHouse owners and renters - Black or African American residents 426 79.7% Owner occupied109 20.3% Renter occupiedHouse owners and renters - Asian residents 415 98.4% Owner occupied7 1.6% Renter occupiedHouse owners and renters - Other race residents 114 100.0% Owner occupiedHouse owners and renters - Two or more races residents 449 83.0% Owner occupied92 17.0% Renter occupiedHouse owners and renters - White alone residents 11,210 91.6% Owner occupied1,023 8.4% Renter occupiedHouse owners and renters - Hispanic or Latino residents 195 100.0% Owner occupied
Language usage in Severna Park
English speakers - Total 93.6% of residents of Severna Park speak English at home.
2.2% of residents speak Spanish at home 650 77.1% Speak English very well193 22.9% Speak English less than very well3.7% of residents speak other language at home 1,072 76.7% Speak English very well326 23.3% Speak English less than very well
English speakers - Born in the United States 96.7% of residents of Severna Park speak English at home.
2.0% of residents speak Spanish at home 314 100.0% Speak English very well1.2% of residents speak other language at home 158 84.9% Speak English very well28 15.1% Speak English less than very well
English speakers - Native, born elsewhere 87.3% of residents of Severna Park speak English at home.
4.4% of residents speak Spanish at home 31 100.0% Speak English very well
English speakers - Foreign-born 32.2% of residents of Severna Park speak English at home.
16.2% of residents speak Spanish at home 110 34.3% Speak English very well211 65.7% Speak English less than very well50.0% of residents speak other language at home 737 74.1% Speak English very well257 25.9% Speak English less than very well
White (Caucasian) - Speak only English Native:
99.1% (31,419)Foreign-born:
69.1% (293)
White (Caucasian) - Speak another language Native:
1.3% (401)Foreign-born:
38.7% (164)
Black or African American - Speak only English Native:
91.3% (1,095)Foreign-born:
61.3% (74)
Black or African American - Speak another language Native:
9.6% (115)Foreign-born:
33.9% (41)
Asian - Speak only English Native:
66.9% (234)Foreign-born:
17.9% (159)
Asian - Speak another language Native:
31.6% (110)Foreign-born:
81.6% (722)
Other race - Speak only English Native:
60.4% (89)Foreign-born:
3.0% (8)
Other race - Speak another language Native:
36.5% (54)Foreign-born:
100.0% (248)
Two or more races - Speak only English Native:
88.0% (1,865)Foreign-born:
41.7% (17)
Two or more races - Speak another language Native:
7.9% (167)Foreign-born:
65.0% (27)
White alone - Speak only English Native:
98.5% (31,289)Foreign-born:
60.4% (287)
White alone - Speak another language Native:
1.5% (481)Foreign-born:
39.6% (189)
Hispanic or Latino - Speak only English Native:
81.2% (647)Foreign-born:
26.2% (54)
Hispanic or Latino - Speak another language Native:
19.9% (159)Foreign-born:
68.3% (139)
Foreign-born residents in Severna Park 2,049 residents are foreign born (1.9% Asia , 1.3% Europe , 1.0% Latin America ).
This city:
5.0%Maryland:
15.7%
Marital status for residents in Severna Park Marital status - White (Caucasian) population 15 years and over
Males 24.8% Never married65.3% Now married0.5% Separated2.5% Widowed6.9% DivorcedFemales 19.3% Never married61.4% Now married1.1% Separated9.4% Widowed8.7% DivorcedWomen who gave birth in the past 12 months Now married:
95.9% (265)Unmarried:
4.1% (11)
Women who did not give birth in the past 12 months Now married:
58.4% (3,404)Unmarried:
41.6% (2,425)
Marital status - Black or African American population 15 years and over
Males 52.8% Never married35.0% Now married8.5% Separated0.0% Widowed3.7% DivorcedFemales 30.1% Never married29.1% Now married0.0% Separated16.7% Widowed24.0% DivorcedWomen who did not give birth in the past 12 months Now married:
51.0% (76)Unmarried:
49.0% (73)
Marital status - Asian population 15 years and over
Males 19.0% Never married75.9% Now married2.3% Separated0.0% Widowed2.8% DivorcedFemales 20.5% Never married59.5% Now married0.0% Separated10.3% Widowed9.7% DivorcedWomen who gave birth in the past 12 months Now married:
100.0% (9)Unmarried:
0.0% (0)
Women who did not give birth in the past 12 months Now married:
68.3% (317)Unmarried:
31.7% (147)
Marital status - Other race population 15 years and over
Males 9.4% Never married90.6% Now married0.0% Separated0.0% Widowed0.0% DivorcedFemales 18.2% Never married81.8% Now married0.0% Separated0.0% Widowed0.0% DivorcedWomen who did not give birth in the past 12 months Now married:
61.5% (57)Unmarried:
38.5% (36)
Marital status - Two or more races population 15 years and over
Males 45.4% Never married50.3% Now married0.0% Separated2.0% Widowed2.2% DivorcedFemales 45.1% Never married43.0% Now married0.0% Separated0.0% Widowed11.9% DivorcedWomen who gave birth in the past 12 months Now married:
100.0% (57)Unmarried:
0.0% (0)
Women who did not give birth in the past 12 months Now married:
29.9% (171)Unmarried:
70.1% (400)
Marital status - White alone, not Hispanic / Latino population 15 years and over
Males 24.9% Never married65.2% Now married0.5% Separated2.6% Widowed6.9% DivorcedFemales 19.2% Never married61.4% Now married1.1% Separated9.4% Widowed8.9% DivorcedWomen who gave birth in the past 12 months Now married:
95.7% (262)Unmarried:
4.3% (12)
Women who did not give birth in the past 12 months Now married:
58.6% (3,461)Unmarried:
41.4% (2,442)
Marital status - Hispanic or Latino population 15 years and over
Males 39.1% Never married55.6% Now married0.0% Separated0.0% Widowed5.3% DivorcedFemales 26.6% Never married62.6% Now married0.0% Separated5.6% Widowed5.3% DivorcedWomen who gave birth in the past 12 months Now married:
100.0% (11)Unmarried:
0.0% (0)
Women who did not give birth in the past 12 months Now married:
56.7% (183)Unmarried:
43.3% (139)
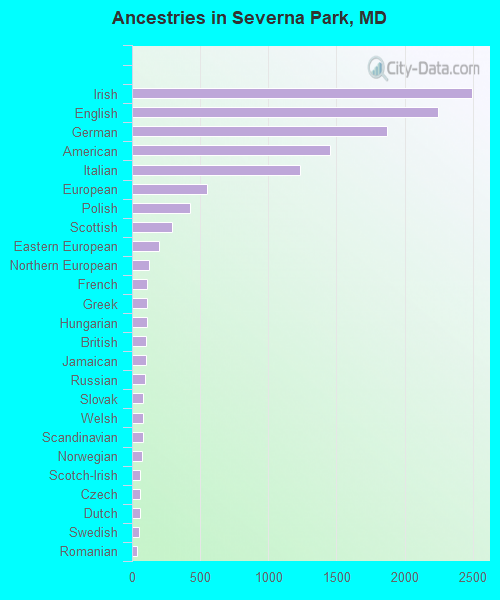
Ancestries in Severna Park
2,495 16.4% Irish2,249 14.8% English1,874 12.3% German1,453 9.6% American1,232 8.1% Italian553 3.6% European422 2.8% Polish295 1.9% Scottish200 1.3% Eastern European126 0.8% Northern European112 0.7% French110 0.7% Greek107 0.7% Hungarian103 0.7% British103 0.7% Jamaican98 0.6% Russian81 0.5% Slovak80 0.5% Welsh78 0.5% Scandinavian70 0.5% Norwegian62 0.4% Scotch-Irish59 0.4% Czech58 0.4% Dutch49 0.3% Swedish34 0.2% Romanian31 0.2% Egyptian31 0.2% French Canadian29 0.2% Estonian27 0.2% Finnish21 0.1% Celtic19 0.1% Lebanese17 0.1% Iranian14 0.09% Austrian13 0.09% Brazilian13 0.09% Lithuanian11 0.07% Moroccan10 0.07% African9 0.06% Turkish8 0.05% Croatian7 0.05% Palestinian
Geographical mobility in Severna Park Same house 1 year ago 30,136 89.5% White (Caucasian)1,150 80.6% Black or African American1,042 76.7% Asian226 60.6% Other race1,647 63.2% Two or more races30,240 89.2% White alone, not Hispanic / Latino824 73.4% Hispanic or LatinoMoved within same county 2,028 6.0% White / Caucasian28 2.0% Black or African American107 7.9% Asian18 4.7% Other race319 12.3% Two or more races1,998 5.9% White alone, not Hispanic / Latino75 6.7% Hispanic or LatinoMoved within same state 841 2.5% White / Caucasian123 8.6% Black or African American4 100.0% American Indian / Alaska Native25 1.9% Asian214 8.2% Two or more races987 2.9% White alone, not Hispanic / Latino57 5.1% Hispanic or LatinoMoved from different state 706 2.1% White / Caucasian129 9.0% Black or African American53 3.9% Asian45 12.1% Other race274 10.5% Two or more races721 2.1% White alone, not Hispanic / Latino110 9.8% Hispanic or LatinoMoved from abroad 15 0.0% White9 2.3% Other race16 0.0% White alone, not Hispanic / Latino10 0.9% Hispanic or Latino
Children Nativity (place of birth) in Severna Park
Children under 6 years - Living with two parents Both parents native 2,651 100.0% NativeBoth parents foreign-born 33 100.0% NativeOne native, one foreign-born parent 195 100.0% NativeChildren under 6 years - Living with one parent Native parent 231 100.0% Native
Children 6 to 17 years - Living with two parents Both parents native 5,983 99.4% Native37 0.6% Foreign-bornBoth parents foreign-born 280 100.0% NativeOne native, one foreign-born parent 340 100.0% NativeChildren 6 to 17 years - Living with one parent Native parent 663 99.5% Native4 0.5% Foreign-born
Grandparents responsible for own grandchildren in Severna Park
Grandparents (30 to 59 years) White / Caucasian 49 39.8% Responsible for grandchildren73 60.2% Not responsible for grandchildrenAsian 7 100.0% Not responsible for grandchildrenTwo or more races 11 100.0% Not responsible for grandchildrenWhite alone, not Hispanic / Latino 49 39.2% Responsible for grandchildren76 60.8% Not responsible for grandchildrenGrandparents (60 years and over) White / Caucasian 58 13.5% Responsible for grandchildren368 86.5% Not responsible for grandchildrenAsian 74 100.0% Not responsible for grandchildrenWhite alone, not Hispanic / Latino 60 13.6% Responsible for grandchildren378 86.4% Not responsible for grandchildren