Races in Severn, Maryland (MD) Detailed Stats
Data:
Races - White alone (%)
Races - White alone (% change since 2000)
Races - Black alone (%)
Races - Black alone (% change since 2000)
Races - American Indian alone (%)
Races - American Indian alone (% change since 2000)
Races - Asian alone (%)
Races - Asian alone (% change since 2000)
Races - Hispanic (%)
Races - Hispanic (% change since 2000)
Races - Native Hawaiian and Other Pacific Islander alone (%)
Races - Native Hawaiian and Other Pacific Islander alone (% change since 2000)
Races - Two or more races(%)
Races - Two or more races(% change since 2000)
Races - Other race alone (%)
Races - Other race alone (% change since 2000)
Racial diversity
Place of birth - Born in state of residence (%)
Place of birth - Born in state of residence (%) - White
Place of birth - Born in state of residence (%) - Black or African American
Place of birth - Born in state of residence (%) - Asian
Place of birth - Born in state of residence (%) - Hispanic or Latino
Place of birth - Born in state of residence (%) - American Indian and Alaska Native
Place of birth - Born in state of residence (%) - Multirace
Place of birth - Born in state of residence (%) - Other Race
Place of birth - Born in other state (%)
Place of birth - Born in other state (%) - White
Place of birth - Born in other state (%) - Black or African American
Place of birth - Born in other state (%) - Asian
Place of birth - Born in other state (%) - Hispanic or Latino
Place of birth - Born in other state (%) - American Indian and Alaska Native
Place of birth - Born in other state (%) - Multirace
Place of birth - Born in other state (%) - Other Race
Place of birth - Native, outside of US (%)
Place of birth - Native, outside of US (%) - White
Place of birth - Native, outside of US (%) - Black or African American
Place of birth - Native, outside of US (%) - Asian
Place of birth - Native, outside of US (%) - Hispanic or Latino
Place of birth - Native, outside of US (%) - American Indian and Alaska Native
Place of birth - Native, outside of US (%) - Multirace
Place of birth - Native, outside of US (%) - Other Race
Place of birth - Foreign born (%)
Place of birth - Foreign born (%) - White
Place of birth - Foreign born (%) - Black or African American
Place of birth - Foreign born (%) - Asian
Place of birth - Foreign born (%) - Hispanic or Latino
Place of birth - Foreign born (%) - American Indian and Alaska Native
Place of birth - Foreign born (%) - Multirace
Place of birth - Foreign born (%) - Other Race
Residents speaking English at home (%)
Residents speaking English at home - Born in the United States (%)
Residents speaking English at home - Native, born elsewhere (%)
Residents speaking English at home - Foreign born (%)
Residents speaking Spanish at home (%)
Residents speaking Spanish at home - Born in the United States (%)
Residents speaking Spanish at home - Native, born elsewhere (%)
Residents speaking Spanish at home - Foreign born (%)
Residents speaking other language at home (%)
Residents speaking other language at home - Born in the United States (%)
Residents speaking other language at home - Native, born elsewhere (%)
Residents speaking other language at home - Foreign born (%)
Marital status - Never married (%)
Marital status - Now married (%)
Marital status - Separated (%)
Marital status - Widowed (%)
Marital status - Divorced (%)
Ancestries Reported - Arab (%)
Ancestries Reported - Czech (%)
Ancestries Reported - Danish (%)
Ancestries Reported - Dutch (%)
Ancestries Reported - English (%)
Ancestries Reported - French (%)
Ancestries Reported - French Canadian (%)
Ancestries Reported - German (%)
Ancestries Reported - Greek (%)
Ancestries Reported - Hungarian (%)
Ancestries Reported - Irish (%)
Ancestries Reported - Italian (%)
Ancestries Reported - Lithuanian (%)
Ancestries Reported - Norwegian (%)
Ancestries Reported - Polish (%)
Ancestries Reported - Portuguese (%)
Ancestries Reported - Russian (%)
Ancestries Reported - Scotch-Irish (%)
Ancestries Reported - Scottish (%)
Ancestries Reported - Slovak (%)
Ancestries Reported - Subsaharan African (%)
Ancestries Reported - Swedish (%)
Ancestries Reported - Swiss (%)
Ancestries Reported - Ukrainian (%)
Ancestries Reported - United States (%)
Ancestries Reported - Welsh (%)
Ancestries Reported - West Indian (%)
Ancestries Reported - Other (%)
Geographical mobility - Same house 1 year ago (%)
Geographical mobility - Same house 1 year ago (%) - White
Geographical mobility - Same house 1 year ago (%) - Black or African American
Geographical mobility - Same house 1 year ago (%) - Asian
Geographical mobility - Same house 1 year ago (%) - Hispanic or Latino
Geographical mobility - Same house 1 year ago (%) - American Indian and Alaska Native
Geographical mobility - Same house 1 year ago (%) - Multirace
Geographical mobility - Same house 1 year ago (%) - Other Race
Geographical mobility - Moved within same county (%)
Geographical mobility - Moved within same county (%) - White
Geographical mobility - Moved within same county (%) - Black or African American
Geographical mobility - Moved within same county (%) - Asian
Geographical mobility - Moved within same county (%) - Hispanic or Latino
Geographical mobility - Moved within same county (%) - American Indian and Alaska Native
Geographical mobility - Moved within same county (%) - Multirace
Geographical mobility - Moved within same county (%) - Other Race
Geographical mobility - Moved from different county within same state (%)
Geographical mobility - Moved from different county within same state (%) - White
Geographical mobility - Moved from different county within same state (%) - Black or African American
Geographical mobility - Moved from different county within same state (%) - Asian
Geographical mobility - Moved from different county within same state (%) - Hispanic or Latino
Geographical mobility - Moved from different county within same state (%) - American Indian and Alaska Native
Geographical mobility - Moved from different county within same state (%) - Multirace
Geographical mobility - Moved from different county within same state (%) - Other Race
Geographical mobility - Moved from different state (%)
Geographical mobility - Moved from different state (%) - White
Geographical mobility - Moved from different state (%) - Black or African American
Geographical mobility - Moved from different state (%) - Asian
Geographical mobility - Moved from different state (%) - Hispanic or Latino
Geographical mobility - Moved from different state (%) - American Indian and Alaska Native
Geographical mobility - Moved from different state (%) - Multirace
Geographical mobility - Moved from different state (%) - Other Race
Geographical mobility - Moved from abroad (%)
Geographical mobility - Moved from abroad (%) - White
Geographical mobility - Moved from abroad (%) - Black or African American
Geographical mobility - Moved from abroad (%) - Asian
Geographical mobility - Moved from abroad (%) - Hispanic or Latino
Geographical mobility - Moved from abroad (%) - American Indian and Alaska Native
Geographical mobility - Moved from abroad (%) - Multirace
Geographical mobility - Moved from abroad (%) - Other Race
Place of birth for the foreign-born population - Ireland (%)
Place of birth for the foreign-born population - Denmark (%)
Place of birth for the foreign-born population - Norway (%)
Place of birth for the foreign-born population - Sweden (%)
Place of birth for the foreign-born population - United Kingdom (%)
Place of birth for the foreign-born population - England (%)
Place of birth for the foreign-born population - Scotland (%)
Place of birth for the foreign-born population - Other Northern Europe (%)
Place of birth for the foreign-born population - Austria (%)
Place of birth for the foreign-born population - Belgium (%)
Place of birth for the foreign-born population - France (%)
Place of birth for the foreign-born population - Germany (%)
Place of birth for the foreign-born population - Netherlands (%)
Place of birth for the foreign-born population - Switzerland (%)
Place of birth for the foreign-born population - Other Western Europe (%)
Place of birth for the foreign-born population - Greece (%)
Place of birth for the foreign-born population - Italy (%)
Place of birth for the foreign-born population - Portugal (%)
Place of birth for the foreign-born population - Spain (%)
Place of birth for the foreign-born population - Other Southern Europe (%)
Place of birth for the foreign-born population - Albania (%)
Place of birth for the foreign-born population - Belarus (%)
Place of birth for the foreign-born population - Bosnia and Herzegovina (%)
Place of birth for the foreign-born population - Bulgaria (%)
Place of birth for the foreign-born population - Croatia (%)
Place of birth for the foreign-born population - Czechoslovakia (%)
Place of birth for the foreign-born population - Hungary (%)
Place of birth for the foreign-born population - Latvia (%)
Place of birth for the foreign-born population - Lithuania (%)
Place of birth for the foreign-born population - North Macedonia (Macedonia) (%)
Place of birth for the foreign-born population - Moldova (%)
Place of birth for the foreign-born population - Poland (%)
Place of birth for the foreign-born population - Romania (%)
Place of birth for the foreign-born population - Russia (%)
Place of birth for the foreign-born population - Serbia (%)
Place of birth for the foreign-born population - Ukraine (%)
Place of birth for the foreign-born population - Other Eastern Europe (%)
Place of birth for the foreign-born population - China (%)
Place of birth for the foreign-born population - Hong Kong (%)
Place of birth for the foreign-born population - Taiwan (%)
Place of birth for the foreign-born population - Japan (%)
Place of birth for the foreign-born population - Korea (%)
Place of birth for the foreign-born population - Other Eastern Asia (%)
Place of birth for the foreign-born population - Afghanistan (%)
Place of birth for the foreign-born population - Bangladesh (%)
Place of birth for the foreign-born population - India (%)
Place of birth for the foreign-born population - Iran (%)
Place of birth for the foreign-born population - Kazakhstan (%)
Place of birth for the foreign-born population - Nepal (%)
Place of birth for the foreign-born population - Pakistan (%)
Place of birth for the foreign-born population - Sri Lanka (%)
Place of birth for the foreign-born population - Uzbekistan (%)
Place of birth for the foreign-born population - Other South Central Asia (%)
Place of birth for the foreign-born population - Burma (%)
Place of birth for the foreign-born population - Cambodia (%)
Place of birth for the foreign-born population - Indonesia (%)
Place of birth for the foreign-born population - Laos (%)
Place of birth for the foreign-born population - Malaysia (%)
Place of birth for the foreign-born population - Philippines (%)
Place of birth for the foreign-born population - Singapore (%)
Place of birth for the foreign-born population - Thailand (%)
Place of birth for the foreign-born population - Vietnam (%)
Place of birth for the foreign-born population - Other South Eastern Asia (%)
Place of birth for the foreign-born population - Armenia (%)
Place of birth for the foreign-born population - Iraq (%)
Place of birth for the foreign-born population - Israel (%)
Place of birth for the foreign-born population - Jordan (%)
Place of birth for the foreign-born population - Kuwait (%)
Place of birth for the foreign-born population - Lebanon (%)
Place of birth for the foreign-born population - Saudi Arabia (%)
Place of birth for the foreign-born population - Syria (%)
Place of birth for the foreign-born population - Turkey (%)
Place of birth for the foreign-born population - Yemen (%)
Place of birth for the foreign-born population - Other Western Asia (%)
Place of birth for the foreign-born population - Eritrea (%)
Place of birth for the foreign-born population - Ethiopia (%)
Place of birth for the foreign-born population - Kenya (%)
Place of birth for the foreign-born population - Somalia (%)
Place of birth for the foreign-born population - Uganda (%)
Place of birth for the foreign-born population - Zimbabwe (%)
Place of birth for the foreign-born population - Other Eastern Africa (%)
Place of birth for the foreign-born population - Cameroon (%)
Place of birth for the foreign-born population - Congo (%)
Place of birth for the foreign-born population - Democratic Republic of Congo (Zaire) (%)
Place of birth for the foreign-born population - Other Middle Africa (%)
Place of birth for the foreign-born population - Egypt (%)
Place of birth for the foreign-born population - Morocco (%)
Place of birth for the foreign-born population - Sudan (%)
Place of birth for the foreign-born population - Other Northern Africa (%)
Place of birth for the foreign-born population - South Africa (%)
Place of birth for the foreign-born population - Other Southern Africa (%)
Place of birth for the foreign-born population - Cabo Verde (%)
Place of birth for the foreign-born population - Ghana (%)
Place of birth for the foreign-born population - Liberia (%)
Place of birth for the foreign-born population - Nigeria (%)
Place of birth for the foreign-born population - Senegal (%)
Place of birth for the foreign-born population - Sierra Leone (%)
Place of birth for the foreign-born population - Other Western Africa (%)
Place of birth for the foreign-born population - Australia (%)
Place of birth for the foreign-born population - New Zealand (%)
Place of birth for the foreign-born population - Fiji (%)
Place of birth for the foreign-born population - Micronesia (%)
Place of birth for the foreign-born population - Bahamas (%)
Place of birth for the foreign-born population - Barbados (%)
Place of birth for the foreign-born population - Cuba (%)
Place of birth for the foreign-born population - Dominica (%)
Place of birth for the foreign-born population - Dominican Republic (%)
Place of birth for the foreign-born population - Grenada (%)
Place of birth for the foreign-born population - Haiti (%)
Place of birth for the foreign-born population - Jamaica (%)
Place of birth for the foreign-born population - St. Vincent and the Grenadines (%)
Place of birth for the foreign-born population - Trinidad and Tobago (%)
Place of birth for the foreign-born population - West Indies (%)
Place of birth for the foreign-born population - Other Caribbean (%)
Place of birth for the foreign-born population - Belize (%)
Place of birth for the foreign-born population - Costa Rica (%)
Place of birth for the foreign-born population - El Salvador (%)
Place of birth for the foreign-born population - Guatemala (%)
Place of birth for the foreign-born population - Honduras (%)
Place of birth for the foreign-born population - Mexico (%)
Place of birth for the foreign-born population - Nicaragua (%)
Place of birth for the foreign-born population - Panama (%)
Place of birth for the foreign-born population - Other Central America (%)
Place of birth for the foreign-born population - Argentina (%)
Place of birth for the foreign-born population - Bolivia (%)
Place of birth for the foreign-born population - Brazil (%)
Place of birth for the foreign-born population - Chile (%)
Place of birth for the foreign-born population - Colombia (%)
Place of birth for the foreign-born population - Ecuador (%)
Place of birth for the foreign-born population - Guyana (%)
Place of birth for the foreign-born population - Peru (%)
Place of birth for the foreign-born population - Uruguay (%)
Place of birth for the foreign-born population - Venezuela (%)
Place of birth for the foreign-born population - Other South America (%)
Place of birth for the foreign-born population - Canada (%)
Place of birth for the foreign-born population - Other Northern America (%)
Place of birth for the foreign-born population - Other (%)
Latest news about races in Severn, MD collected exclusively by city-data.com from local newspapers, TV, and radio stations
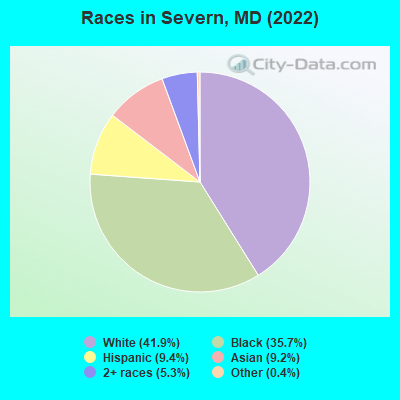
According to 2022 data, the most numerous races in Severn, MD are White alone (23,869 residents), Black alone (20,311 residents), and Hispanic (5,367 residents). 79.7% of Severn residents speak English at home. 14.9% of Severn, MD residents are foreign-born (6.2% born in Asia, 3.6% born in Latin America, 3.2% born in Africa), which is 7.7% less than the foreign-born rate of 16.0% across the entire state of Maryland.
Race distribution in Severn
2000 2022
3,286,547 62.1% White alone 1,464,735 27.7% Black alone 227,916 4.3% Hispanic 209,738 4.0% Asian alone 82,946 1.6% Two or more races 13,312 0.3% American Indian alone 9,379 0.2% Other race alone 1,913 0.04% Native Hawaiian and Other
2,906,492 47.1% White alone 1,800,914 29.2% Black alone 705,842 11.4% Hispanic 401,818 6.5% Asian alone 291,317 4.7% Two or more races 46,930 0.8% Other race alone 8,930 0.1% American Indian alone 2,417 0.04% Native Hawaiian and Other
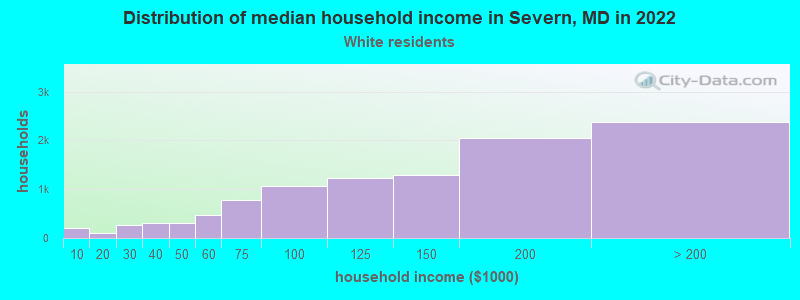
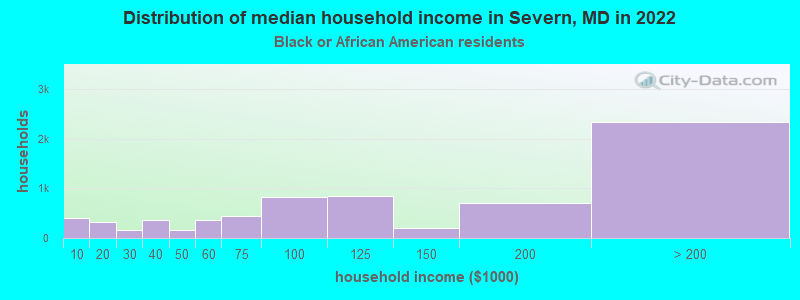
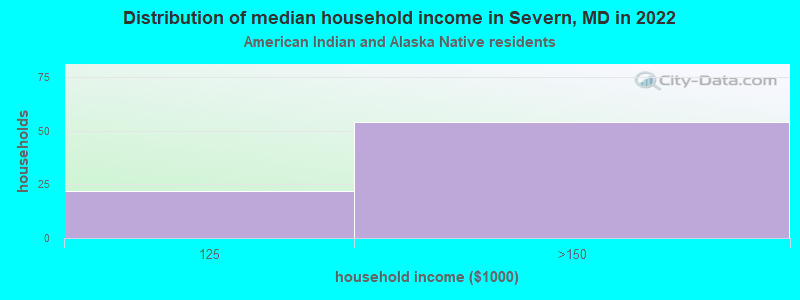
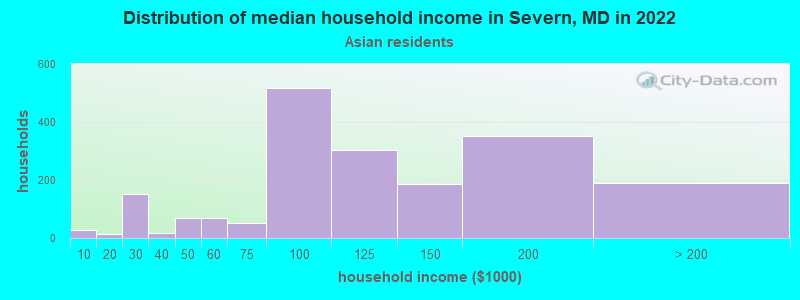
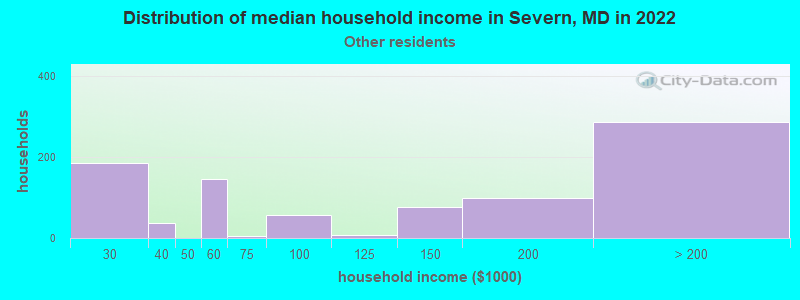
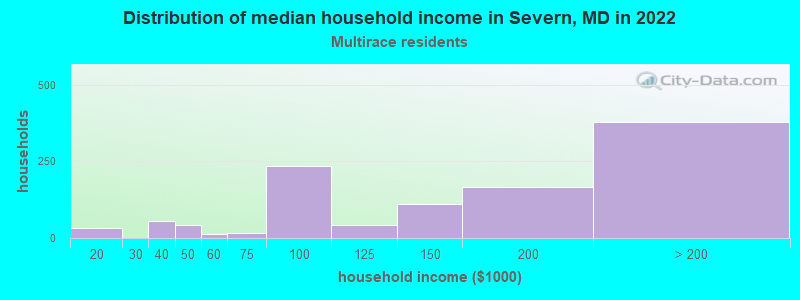
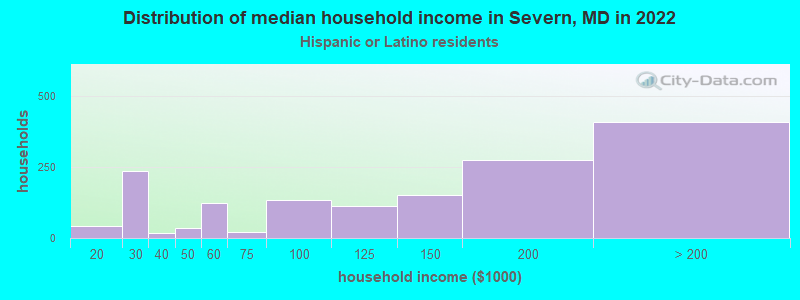
Income and house value in Severn Median household income in 2022 $130,454 White non-Hispanic householders$100,534 Black householders$187,089 American Indian and Alaska Native householders$103,844 Asian householders$139,273 Some other race householders$139,438 Two or more races householders$144,327 Hispanic or Latino race householdersMedian 2022 house value $474,905 White Non-Hispanic householders$462,462 Black or African American householders$427,799 American Indian or Alaska Native householders $464,832 Asian householders$496,235 Some other race householders$474,312 Two or more races householders$437,576 Hispanic or Latino householders
Median age by race in Severn
41.0 Median age for White residents41.4 39.7 34.6 Median age for Black or African American residents30.4 35.5 56.5 Median age for American Indian / Alaska Native residents45.9 -1,072,276,158.6 39.8 Median age for Asian residents34.9 43.7 -534,101,824.6 Median age for Native Hawaiian / Pacific Islander residents-720,061,021.4 -760,942,760.2 41.3 Median age for Other race residents38.5 46.8 23.0 Median age for Two or more races residents26.4 20.3 41.5 Median age for White alone residents41.9 40.2 31.6 Median age for Hispanic or Latino residents29.1 34.1
Owner/renter occupied households by race in Severn
House owners and renters - White residents 8,456 80.3% Owner occupied2,079 19.7% Renter occupiedHouse owners and renters - Black or African American residents 4,550 61.7% Owner occupied2,827 38.3% Renter occupiedHouse owners and renters - American Indian / Alaska Native residents 52 57.3% Owner occupied39 42.7% Renter occupiedHouse owners and renters - Asian residents 1,481 82.5% Owner occupied315 17.5% Renter occupiedHouse owners and renters - Other race residents 643 77.0% Owner occupied192 23.0% Renter occupiedHouse owners and renters - Two or more races residents 813 67.4% Owner occupied392 32.6% Renter occupiedHouse owners and renters - White alone residents 8,246 80.4% Owner occupied2,015 19.6% Renter occupiedHouse owners and renters - Hispanic or Latino residents 1,095 72.8% Owner occupied410 27.2% Renter occupied
Language usage in Severn
English speakers - Total 79.7% of residents of Severn speak English at home.
5.4% of residents speak Spanish at home 2,221 77.6% Speak English very well640 22.4% Speak English less than very well15.4% of residents speak other language at home 5,900 71.9% Speak English very well2,305 28.1% Speak English less than very well
English speakers - Born in the United States 88.0% of residents of Severn speak English at home.
3.9% of residents speak Spanish at home 847 98.3% Speak English very well15 1.7% Speak English less than very well8.8% of residents speak other language at home 1,532 79.3% Speak English very well401 20.7% Speak English less than very well
English speakers - Native, born elsewhere 60.9% of residents of Severn speak English at home.
24.8% of residents speak Spanish at home 340 81.3% Speak English very well78 18.7% Speak English less than very well12.2% of residents speak other language at home 178 86.4% Speak English very well28 13.6% Speak English less than very well
English speakers - Foreign-born 20.4% of residents of Severn speak English at home.
11.6% of residents speak Spanish at home 431 45.2% Speak English very well523 54.8% Speak English less than very well67.2% of residents speak other language at home 3,674 66.7% Speak English very well1,835 33.3% Speak English less than very well
White (Caucasian) - Speak only English Native:
96.6% (21,695)Foreign-born:
50.5% (270)
White (Caucasian) - Speak another language Native:
3.2% (721)Foreign-born:
52.0% (278)
Black or African American - Speak only English Native:
90.4% (14,692)Foreign-born:
27.1% (702)
Black or African American - Speak another language Native:
10.6% (1,727)Foreign-born:
75.2% (1,945)
American Indian / Alaska Native - Speak only English Native:
80.3% (56)Foreign-born:
24.8% (62)
Asian - Speak only English Native:
58.0% (704)Foreign-born:
11.2% (430)
Asian - Speak another language Native:
41.7% (506)Foreign-born:
88.9% (3,416)
Other race - Speak only English Native:
31.1% (441)Foreign-born:
7.8% (88)
Other race - Speak another language Native:
70.4% (1,000)Foreign-born:
91.4% (1,028)
Two or more races - Speak only English Native:
79.9% (3,392)Foreign-born:
53.3% (303)
Two or more races - Speak another language Native:
20.3% (860)Foreign-born:
58.5% (332)
White alone - Speak only English Native:
97.2% (21,481)Foreign-born:
29.4% (166)
White alone - Speak another language Native:
2.7% (595)Foreign-born:
70.6% (399)
Hispanic or Latino - Speak only English Native:
49.9% (1,664)Foreign-born:
27.4% (415)
Hispanic or Latino - Speak another language Native:
49.9% (1,664)Foreign-born:
66.7% (1,011)
Foreign-born residents in Severn 8,459 residents are foreign born (6.2% Asia , 3.6% Latin America , 3.2% Africa ).
This city:
14.9%Maryland:
15.7%
Marital status for residents in Severn Marital status - White (Caucasian) population 15 years and over
Males 27.1% Never married62.7% Now married0.5% Separated2.6% Widowed7.1% DivorcedFemales 23.8% Never married60.0% Now married0.5% Separated5.4% Widowed10.4% DivorcedWomen who gave birth in the past 12 months Now married:
85.6% (316)Unmarried:
14.4% (53)
Women who did not give birth in the past 12 months Now married:
55.5% (3,065)Unmarried:
44.5% (2,460)
Marital status - Black or African American population 15 years and over
Males 43.4% Never married47.8% Now married1.5% Separated2.0% Widowed5.3% DivorcedFemales 42.5% Never married35.1% Now married3.4% Separated6.0% Widowed13.0% DivorcedWomen who gave birth in the past 12 months Now married:
86.7% (269)Unmarried:
13.3% (41)
Women who did not give birth in the past 12 months Now married:
33.3% (1,772)Unmarried:
66.7% (3,555)
Marital status - American Indian / Alaska Native population 15 years and over
Males 20.1% Never married79.9% Now married0.0% Separated0.0% Widowed0.0% DivorcedFemales 0.0% Never married65.5% Now married0.0% Separated0.0% Widowed34.5% DivorcedWomen who did not give birth in the past 12 months Now married:
65.5% (57)Unmarried:
34.5% (30)
Marital status - Asian population 15 years and over
Males 33.8% Never married49.5% Now married0.0% Separated2.8% Widowed13.9% DivorcedFemales 22.9% Never married62.9% Now married0.7% Separated9.9% Widowed3.7% DivorcedWomen who gave birth in the past 12 months Now married:
100.0% (135)Unmarried:
0.0% (0)
Women who did not give birth in the past 12 months Now married:
50.5% (699)Unmarried:
49.5% (686)
Marital status - Other race population 15 years and over
Males 34.1% Never married58.0% Now married0.0% Separated0.0% Widowed7.9% DivorcedFemales 19.1% Never married70.5% Now married0.0% Separated7.8% Widowed2.6% DivorcedWomen who gave birth in the past 12 months Now married:
100.0% (109)Unmarried:
0.0% (0)
Women who did not give birth in the past 12 months Now married:
54.8% (183)Unmarried:
45.2% (151)
Marital status - Two or more races population 15 years and over
Males 55.9% Never married40.4% Now married0.0% Separated0.8% Widowed2.9% DivorcedFemales 45.8% Never married40.6% Now married0.0% Separated2.7% Widowed10.9% DivorcedWomen who gave birth in the past 12 months Now married:
27.5% (26)Unmarried:
72.5% (68)
Women who did not give birth in the past 12 months Now married:
33.8% (360)Unmarried:
66.2% (704)
Marital status - White alone, not Hispanic / Latino population 15 years and over
Males 27.3% Never married62.3% Now married0.5% Separated2.5% Widowed7.4% DivorcedFemales 23.8% Never married60.2% Now married0.5% Separated5.4% Widowed10.1% DivorcedWomen who gave birth in the past 12 months Now married:
84.8% (303)Unmarried:
15.2% (54)
Women who did not give birth in the past 12 months Now married:
55.3% (3,063)Unmarried:
44.7% (2,472)
Marital status - Hispanic or Latino population 15 years and over
Males 36.4% Never married58.5% Now married0.0% Separated0.9% Widowed4.2% DivorcedFemales 26.8% Never married55.4% Now married0.0% Separated4.1% Widowed13.7% DivorcedWomen who gave birth in the past 12 months Now married:
73.5% (155)Unmarried:
26.5% (56)
Women who did not give birth in the past 12 months Now married:
42.3% (265)Unmarried:
57.7% (361)
Ancestries in Severn
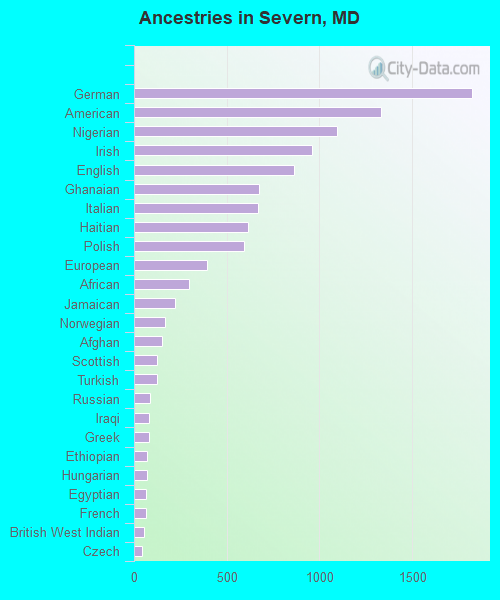
1,823 6.4% German1,333 4.7% American1,094 3.9% Nigerian961 3.4% Irish863 3.0% English675 2.4% Ghanaian670 2.4% Italian614 2.2% Haitian594 2.1% Polish394 1.4% European298 1.1% African222 0.8% Jamaican165 0.6% Norwegian149 0.5% Afghan124 0.4% Scottish122 0.4% Turkish87 0.3% Russian83 0.3% Iraqi79 0.3% Greek72 0.3% Ethiopian71 0.3% Hungarian67 0.2% Egyptian66 0.2% French53 0.2% British West Indian45 0.2% Czech43 0.2% Guyanese42 0.1% German Russian42 0.1% Trinidadian and Tobagonian40 0.1% Celtic38 0.1% Belgian35 0.1% Slavic34 0.1% Dutch32 0.1% Scotch-Irish29 0.1% Eastern European26 0.09% Northern European25 0.09% Cajun23 0.08% Albanian23 0.08% Slovak23 0.08% Canadian22 0.08% Cape Verdean21 0.07% Swedish18 0.06% Lithuanian18 0.06% Croatian17 0.06% Austrian16 0.06% Ukrainian15 0.05% British14 0.05% Pennsylvania German13 0.05% Portuguese12 0.04% Sierra Leonean11 0.04% Arab10 0.04% Syrian10 0.04% Slovene9 0.03% Finnish8 0.03% Danish8 0.03% Armenian8 0.03% Liberian5 0.02% French Canadian3 0.01% Serbian
Geographical mobility in Severn Same house 1 year ago 20,796 86.5% White (Caucasian)18,036 88.9% Black or African American283 98.9% American Indian / Alaska Native4,209 81.2% Asian1,982 75.4% Other race4,433 83.2% Two or more races20,408 86.6% White alone, not Hispanic / Latino4,146 80.0% Hispanic or LatinoMoved within same county 1,347 5.6% White / Caucasian809 4.0% Black or African American126 2.4% Asian207 7.9% Other race439 8.2% Two or more races1,257 5.3% White alone, not Hispanic / Latino364 7.0% Hispanic or LatinoMoved within same state 575 2.4% White / Caucasian1,150 5.7% Black or African American323 6.2% Asian457 17.4% Other race134 2.5% Two or more races640 2.7% White alone, not Hispanic / Latino250 4.8% Hispanic or LatinoMoved from different state 946 3.9% White / Caucasian397 2.0% Black or African American117 2.3% Asian9 0.4% Other race158 3.0% Two or more races897 3.8% White alone, not Hispanic / Latino193 3.7% Hispanic or LatinoMoved from abroad 198 0.8% White18 0.1% Black or African American66 2.5% Other race142 2.7% Two or more races207 0.9% White alone, not Hispanic / Latino159 3.1% Hispanic or Latino
Children Nativity (place of birth) in Severn
Children under 6 years - Living with two parents Both parents native 2,208 100.0% NativeBoth parents foreign-born 558 100.0% NativeOne native, one foreign-born parent 337 93.6% Native23 6.4% Foreign-bornChildren under 6 years - Living with one parent Native parent 981 100.0% NativeForeign-born parent 167 100.0% NativeChildren 6 to 17 years - Living with two parents Both parents native 3,544 99.7% Native10 0.3% Foreign-bornBoth parents foreign-born 1,011 82.4% Native216 17.6% Foreign-bornOne native, one foreign-born parent 452 98.4% Native8 1.6% Foreign-bornChildren 6 to 17 years - Living with one parent Native parent 2,460 100.0% NativeForeign-born parent 479 54.6% Native398 45.4% Foreign-born
Grandparents responsible for own grandchildren in Severn
Grandparents (30 to 59 years) White / Caucasian 105 51.7% Responsible for grandchildren99 48.3% Not responsible for grandchildrenBlack or African American 82 46.5% Responsible for grandchildren95 53.5% Not responsible for grandchildrenAsian 24 100.0% Not responsible for grandchildrenTwo or more races 50 83.1% Responsible for grandchildren10 16.9% Not responsible for grandchildrenWhite alone, not Hispanic / Latino 105 51.0% Responsible for grandchildren101 49.0% Not responsible for grandchildrenHispanic or Latino 41 100.0% Responsible for grandchildrenGrandparents (60 years and over) White / Caucasian 42 11.8% Responsible for grandchildren314 88.2% Not responsible for grandchildrenBlack or African American 9 1.8% Responsible for grandchildren480 98.2% Not responsible for grandchildrenAsian 9 11.4% Responsible for grandchildren68 88.6% Not responsible for grandchildrenWhite alone, not Hispanic / Latino 44 15.7% Responsible for grandchildren233 84.3% Not responsible for grandchildrenHispanic or Latino 213 100.0% Not responsible for grandchildren