Races in Seven Corners, Virginia (VA) Detailed Stats
Data:
Races - White alone (%)
Races - White alone (% change since 2000)
Races - Black alone (%)
Races - Black alone (% change since 2000)
Races - American Indian alone (%)
Races - American Indian alone (% change since 2000)
Races - Asian alone (%)
Races - Asian alone (% change since 2000)
Races - Hispanic (%)
Races - Hispanic (% change since 2000)
Races - Native Hawaiian and Other Pacific Islander alone (%)
Races - Native Hawaiian and Other Pacific Islander alone (% change since 2000)
Races - Two or more races(%)
Races - Two or more races(% change since 2000)
Races - Other race alone (%)
Races - Other race alone (% change since 2000)
Racial diversity
Place of birth - Born in state of residence (%)
Place of birth - Born in state of residence (%) - White
Place of birth - Born in state of residence (%) - Black or African American
Place of birth - Born in state of residence (%) - Asian
Place of birth - Born in state of residence (%) - Hispanic or Latino
Place of birth - Born in state of residence (%) - American Indian and Alaska Native
Place of birth - Born in state of residence (%) - Multirace
Place of birth - Born in state of residence (%) - Other Race
Place of birth - Born in other state (%)
Place of birth - Born in other state (%) - White
Place of birth - Born in other state (%) - Black or African American
Place of birth - Born in other state (%) - Asian
Place of birth - Born in other state (%) - Hispanic or Latino
Place of birth - Born in other state (%) - American Indian and Alaska Native
Place of birth - Born in other state (%) - Multirace
Place of birth - Born in other state (%) - Other Race
Place of birth - Native, outside of US (%)
Place of birth - Native, outside of US (%) - White
Place of birth - Native, outside of US (%) - Black or African American
Place of birth - Native, outside of US (%) - Asian
Place of birth - Native, outside of US (%) - Hispanic or Latino
Place of birth - Native, outside of US (%) - American Indian and Alaska Native
Place of birth - Native, outside of US (%) - Multirace
Place of birth - Native, outside of US (%) - Other Race
Place of birth - Foreign born (%)
Place of birth - Foreign born (%) - White
Place of birth - Foreign born (%) - Black or African American
Place of birth - Foreign born (%) - Asian
Place of birth - Foreign born (%) - Hispanic or Latino
Place of birth - Foreign born (%) - American Indian and Alaska Native
Place of birth - Foreign born (%) - Multirace
Place of birth - Foreign born (%) - Other Race
Residents speaking English at home (%)
Residents speaking English at home - Born in the United States (%)
Residents speaking English at home - Native, born elsewhere (%)
Residents speaking English at home - Foreign born (%)
Residents speaking Spanish at home (%)
Residents speaking Spanish at home - Born in the United States (%)
Residents speaking Spanish at home - Native, born elsewhere (%)
Residents speaking Spanish at home - Foreign born (%)
Residents speaking other language at home (%)
Residents speaking other language at home - Born in the United States (%)
Residents speaking other language at home - Native, born elsewhere (%)
Residents speaking other language at home - Foreign born (%)
Marital status - Never married (%)
Marital status - Now married (%)
Marital status - Separated (%)
Marital status - Widowed (%)
Marital status - Divorced (%)
Ancestries Reported - Arab (%)
Ancestries Reported - Czech (%)
Ancestries Reported - Danish (%)
Ancestries Reported - Dutch (%)
Ancestries Reported - English (%)
Ancestries Reported - French (%)
Ancestries Reported - French Canadian (%)
Ancestries Reported - German (%)
Ancestries Reported - Greek (%)
Ancestries Reported - Hungarian (%)
Ancestries Reported - Irish (%)
Ancestries Reported - Italian (%)
Ancestries Reported - Lithuanian (%)
Ancestries Reported - Norwegian (%)
Ancestries Reported - Polish (%)
Ancestries Reported - Portuguese (%)
Ancestries Reported - Russian (%)
Ancestries Reported - Scotch-Irish (%)
Ancestries Reported - Scottish (%)
Ancestries Reported - Slovak (%)
Ancestries Reported - Subsaharan African (%)
Ancestries Reported - Swedish (%)
Ancestries Reported - Swiss (%)
Ancestries Reported - Ukrainian (%)
Ancestries Reported - United States (%)
Ancestries Reported - Welsh (%)
Ancestries Reported - West Indian (%)
Ancestries Reported - Other (%)
Geographical mobility - Same house 1 year ago (%)
Geographical mobility - Same house 1 year ago (%) - White
Geographical mobility - Same house 1 year ago (%) - Black or African American
Geographical mobility - Same house 1 year ago (%) - Asian
Geographical mobility - Same house 1 year ago (%) - Hispanic or Latino
Geographical mobility - Same house 1 year ago (%) - American Indian and Alaska Native
Geographical mobility - Same house 1 year ago (%) - Multirace
Geographical mobility - Same house 1 year ago (%) - Other Race
Geographical mobility - Moved within same county (%)
Geographical mobility - Moved within same county (%) - White
Geographical mobility - Moved within same county (%) - Black or African American
Geographical mobility - Moved within same county (%) - Asian
Geographical mobility - Moved within same county (%) - Hispanic or Latino
Geographical mobility - Moved within same county (%) - American Indian and Alaska Native
Geographical mobility - Moved within same county (%) - Multirace
Geographical mobility - Moved within same county (%) - Other Race
Geographical mobility - Moved from different county within same state (%)
Geographical mobility - Moved from different county within same state (%) - White
Geographical mobility - Moved from different county within same state (%) - Black or African American
Geographical mobility - Moved from different county within same state (%) - Asian
Geographical mobility - Moved from different county within same state (%) - Hispanic or Latino
Geographical mobility - Moved from different county within same state (%) - American Indian and Alaska Native
Geographical mobility - Moved from different county within same state (%) - Multirace
Geographical mobility - Moved from different county within same state (%) - Other Race
Geographical mobility - Moved from different state (%)
Geographical mobility - Moved from different state (%) - White
Geographical mobility - Moved from different state (%) - Black or African American
Geographical mobility - Moved from different state (%) - Asian
Geographical mobility - Moved from different state (%) - Hispanic or Latino
Geographical mobility - Moved from different state (%) - American Indian and Alaska Native
Geographical mobility - Moved from different state (%) - Multirace
Geographical mobility - Moved from different state (%) - Other Race
Geographical mobility - Moved from abroad (%)
Geographical mobility - Moved from abroad (%) - White
Geographical mobility - Moved from abroad (%) - Black or African American
Geographical mobility - Moved from abroad (%) - Asian
Geographical mobility - Moved from abroad (%) - Hispanic or Latino
Geographical mobility - Moved from abroad (%) - American Indian and Alaska Native
Geographical mobility - Moved from abroad (%) - Multirace
Geographical mobility - Moved from abroad (%) - Other Race
Place of birth for the foreign-born population - Ireland (%)
Place of birth for the foreign-born population - Denmark (%)
Place of birth for the foreign-born population - Norway (%)
Place of birth for the foreign-born population - Sweden (%)
Place of birth for the foreign-born population - United Kingdom (%)
Place of birth for the foreign-born population - England (%)
Place of birth for the foreign-born population - Scotland (%)
Place of birth for the foreign-born population - Other Northern Europe (%)
Place of birth for the foreign-born population - Austria (%)
Place of birth for the foreign-born population - Belgium (%)
Place of birth for the foreign-born population - France (%)
Place of birth for the foreign-born population - Germany (%)
Place of birth for the foreign-born population - Netherlands (%)
Place of birth for the foreign-born population - Switzerland (%)
Place of birth for the foreign-born population - Other Western Europe (%)
Place of birth for the foreign-born population - Greece (%)
Place of birth for the foreign-born population - Italy (%)
Place of birth for the foreign-born population - Portugal (%)
Place of birth for the foreign-born population - Spain (%)
Place of birth for the foreign-born population - Other Southern Europe (%)
Place of birth for the foreign-born population - Albania (%)
Place of birth for the foreign-born population - Belarus (%)
Place of birth for the foreign-born population - Bosnia and Herzegovina (%)
Place of birth for the foreign-born population - Bulgaria (%)
Place of birth for the foreign-born population - Croatia (%)
Place of birth for the foreign-born population - Czechoslovakia (%)
Place of birth for the foreign-born population - Hungary (%)
Place of birth for the foreign-born population - Latvia (%)
Place of birth for the foreign-born population - Lithuania (%)
Place of birth for the foreign-born population - North Macedonia (Macedonia) (%)
Place of birth for the foreign-born population - Moldova (%)
Place of birth for the foreign-born population - Poland (%)
Place of birth for the foreign-born population - Romania (%)
Place of birth for the foreign-born population - Russia (%)
Place of birth for the foreign-born population - Serbia (%)
Place of birth for the foreign-born population - Ukraine (%)
Place of birth for the foreign-born population - Other Eastern Europe (%)
Place of birth for the foreign-born population - China (%)
Place of birth for the foreign-born population - Hong Kong (%)
Place of birth for the foreign-born population - Taiwan (%)
Place of birth for the foreign-born population - Japan (%)
Place of birth for the foreign-born population - Korea (%)
Place of birth for the foreign-born population - Other Eastern Asia (%)
Place of birth for the foreign-born population - Afghanistan (%)
Place of birth for the foreign-born population - Bangladesh (%)
Place of birth for the foreign-born population - India (%)
Place of birth for the foreign-born population - Iran (%)
Place of birth for the foreign-born population - Kazakhstan (%)
Place of birth for the foreign-born population - Nepal (%)
Place of birth for the foreign-born population - Pakistan (%)
Place of birth for the foreign-born population - Sri Lanka (%)
Place of birth for the foreign-born population - Uzbekistan (%)
Place of birth for the foreign-born population - Other South Central Asia (%)
Place of birth for the foreign-born population - Burma (%)
Place of birth for the foreign-born population - Cambodia (%)
Place of birth for the foreign-born population - Indonesia (%)
Place of birth for the foreign-born population - Laos (%)
Place of birth for the foreign-born population - Malaysia (%)
Place of birth for the foreign-born population - Philippines (%)
Place of birth for the foreign-born population - Singapore (%)
Place of birth for the foreign-born population - Thailand (%)
Place of birth for the foreign-born population - Vietnam (%)
Place of birth for the foreign-born population - Other South Eastern Asia (%)
Place of birth for the foreign-born population - Armenia (%)
Place of birth for the foreign-born population - Iraq (%)
Place of birth for the foreign-born population - Israel (%)
Place of birth for the foreign-born population - Jordan (%)
Place of birth for the foreign-born population - Kuwait (%)
Place of birth for the foreign-born population - Lebanon (%)
Place of birth for the foreign-born population - Saudi Arabia (%)
Place of birth for the foreign-born population - Syria (%)
Place of birth for the foreign-born population - Turkey (%)
Place of birth for the foreign-born population - Yemen (%)
Place of birth for the foreign-born population - Other Western Asia (%)
Place of birth for the foreign-born population - Eritrea (%)
Place of birth for the foreign-born population - Ethiopia (%)
Place of birth for the foreign-born population - Kenya (%)
Place of birth for the foreign-born population - Somalia (%)
Place of birth for the foreign-born population - Uganda (%)
Place of birth for the foreign-born population - Zimbabwe (%)
Place of birth for the foreign-born population - Other Eastern Africa (%)
Place of birth for the foreign-born population - Cameroon (%)
Place of birth for the foreign-born population - Congo (%)
Place of birth for the foreign-born population - Democratic Republic of Congo (Zaire) (%)
Place of birth for the foreign-born population - Other Middle Africa (%)
Place of birth for the foreign-born population - Egypt (%)
Place of birth for the foreign-born population - Morocco (%)
Place of birth for the foreign-born population - Sudan (%)
Place of birth for the foreign-born population - Other Northern Africa (%)
Place of birth for the foreign-born population - South Africa (%)
Place of birth for the foreign-born population - Other Southern Africa (%)
Place of birth for the foreign-born population - Cabo Verde (%)
Place of birth for the foreign-born population - Ghana (%)
Place of birth for the foreign-born population - Liberia (%)
Place of birth for the foreign-born population - Nigeria (%)
Place of birth for the foreign-born population - Senegal (%)
Place of birth for the foreign-born population - Sierra Leone (%)
Place of birth for the foreign-born population - Other Western Africa (%)
Place of birth for the foreign-born population - Australia (%)
Place of birth for the foreign-born population - New Zealand (%)
Place of birth for the foreign-born population - Fiji (%)
Place of birth for the foreign-born population - Micronesia (%)
Place of birth for the foreign-born population - Bahamas (%)
Place of birth for the foreign-born population - Barbados (%)
Place of birth for the foreign-born population - Cuba (%)
Place of birth for the foreign-born population - Dominica (%)
Place of birth for the foreign-born population - Dominican Republic (%)
Place of birth for the foreign-born population - Grenada (%)
Place of birth for the foreign-born population - Haiti (%)
Place of birth for the foreign-born population - Jamaica (%)
Place of birth for the foreign-born population - St. Vincent and the Grenadines (%)
Place of birth for the foreign-born population - Trinidad and Tobago (%)
Place of birth for the foreign-born population - West Indies (%)
Place of birth for the foreign-born population - Other Caribbean (%)
Place of birth for the foreign-born population - Belize (%)
Place of birth for the foreign-born population - Costa Rica (%)
Place of birth for the foreign-born population - El Salvador (%)
Place of birth for the foreign-born population - Guatemala (%)
Place of birth for the foreign-born population - Honduras (%)
Place of birth for the foreign-born population - Mexico (%)
Place of birth for the foreign-born population - Nicaragua (%)
Place of birth for the foreign-born population - Panama (%)
Place of birth for the foreign-born population - Other Central America (%)
Place of birth for the foreign-born population - Argentina (%)
Place of birth for the foreign-born population - Bolivia (%)
Place of birth for the foreign-born population - Brazil (%)
Place of birth for the foreign-born population - Chile (%)
Place of birth for the foreign-born population - Colombia (%)
Place of birth for the foreign-born population - Ecuador (%)
Place of birth for the foreign-born population - Guyana (%)
Place of birth for the foreign-born population - Peru (%)
Place of birth for the foreign-born population - Uruguay (%)
Place of birth for the foreign-born population - Venezuela (%)
Place of birth for the foreign-born population - Other South America (%)
Place of birth for the foreign-born population - Canada (%)
Place of birth for the foreign-born population - Other Northern America (%)
Place of birth for the foreign-born population - Other (%)
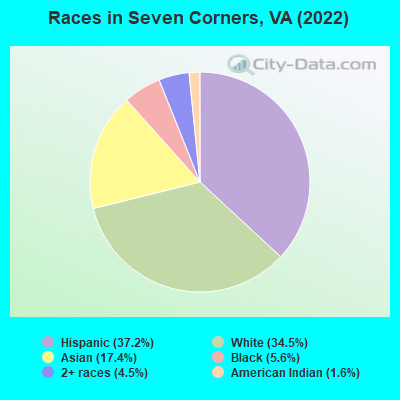
According to 2022 data, the most numerous races in Seven Corners, VA are White alone (3,132 residents), Black alone (509 residents), and Hispanic (3,379 residents). 39.8% of Seven Corners residents speak English at home. 45.4% of Seven Corners, VA residents are foreign-born (22.5% born in Latin America, 17.1% born in Asia), which is 73.6% greater than the foreign-born rate of 12.0% across the entire state of Virginia.
Race distribution in Seven Corners
2000 2022
4,965,637 70.2% White alone 1,376,378 19.4% Black alone 329,540 4.7% Hispanic 259,277 3.7% Asian alone 114,022 1.6% Two or more races 18,596 0.3% American Indian alone 11,685 0.2% Other race alone 3,380 0.05% Native Hawaiian and Other
5,095,130 58.7% White alone 1,594,785 18.4% Black alone 905,750 10.4% Hispanic 602,881 6.9% Asian alone 406,047 4.7% Two or more races 60,419 0.7% Other race alone 11,738 0.1% American Indian alone 6,869 0.08% Native Hawaiian and Other
Income and house value in Seven Corners Median household income in 2022 $93,858 White non-Hispanic householders$79,580 Black householders$32,155 Asian householders$49,906 Some other race householders$56,787 Two or more races householders$43,784 Hispanic or Latino race householdersMedian 2022 house value $747,579 White Non-Hispanic householders$915,336 Black or African American householders$624,092 American Indian or Alaska Native householders $619,100 Asian householdersover $1,000,000 Some other race householders$492,284 Two or more races householdersover $1,000,000 Hispanic or Latino householders
Median age by race in Seven Corners
35.0 Median age for White residents34.9 35.0 37.9 Median age for Black or African American residents37.4 33.3 28.1 Median age for American Indian / Alaska Native residents-964,539,006.1 -669,005,847.3 61.6 Median age for Asian residents59.3 61.7 -666,666,666.0 Median age for Native Hawaiian / Pacific Islander residents-558,791,801.0 -584,518,166.9 20.7 Median age for Other race residents21.9 19.4 33.1 Median age for Two or more races residents33.5 32.3 36.6 Median age for White alone residents36.8 35.0 24.5 Median age for Hispanic or Latino residents23.7 30.3
Owner/renter occupied households by race in Seven Corners
House owners and renters - White residents 800 47.0% Owner occupied901 53.0% Renter occupiedHouse owners and renters - Black or African American residents 25 12.2% Owner occupied181 87.8% Renter occupiedHouse owners and renters - American Indian / Alaska Native residents 42 100.0% Owner occupiedHouse owners and renters - Asian residents 270 34.2% Owner occupied520 65.8% Renter occupiedHouse owners and renters - Other race residents 83 12.7% Owner occupied566 87.3% Renter occupiedHouse owners and renters - Two or more races residents 229 64.5% Owner occupied126 35.5% Renter occupiedHouse owners and renters - White alone residents 819 51.6% Owner occupied769 48.4% Renter occupiedHouse owners and renters - Hispanic or Latino residents 118 13.4% Owner occupied762 86.6% Renter occupied
Language usage in Seven Corners
English speakers - Total 39.8% of residents of Seven Corners speak English at home.
32.9% of residents speak Spanish at home 1,389 50.7% Speak English very well1,351 49.3% Speak English less than very well26.2% of residents speak other language at home 1,235 56.6% Speak English very well947 43.4% Speak English less than very well
English speakers - Born in the United States 88.1% of residents of Seven Corners speak English at home.
5.2% of residents speak Spanish at home 127 100.0% Speak English very well6.1% of residents speak other language at home 148 100.0% Speak English very well
English speakers - Native, born elsewhere 0.0% of residents of Seven Corners speak English at home.
111.8% of residents speak other language at home 19 100.0% Speak English very well
English speakers - Foreign-born 12.1% of residents of Seven Corners speak English at home.
45.6% of residents speak Spanish at home 791 42.4% Speak English very well1,076 57.6% Speak English less than very well42.0% of residents speak other language at home 809 47.1% Speak English very well909 52.9% Speak English less than very well
White (Caucasian) - Speak only English Native:
81.7% (2,001)Foreign-born:
11.4% (96)
White (Caucasian) - Speak another language Native:
14.9% (365)Foreign-born:
83.5% (709)
Asian - Speak only English Native:
44.0% (118)Foreign-born:
19.8% (258)
Asian - Speak another language Native:
56.5% (151)Foreign-born:
81.1% (1,056)
Other race - Speak only English Native:
7.9% (64)Foreign-born:
9.9% (124)
Other race - Speak another language Native:
81.3% (662)Foreign-born:
90.5% (1,133)
Two or more races - Speak only English Native:
52.2% (143)Foreign-born:
6.2% (41)
Two or more races - Speak another language Native:
49.4% (135)Foreign-born:
93.8% (612)
White alone - Speak only English Native:
86.4% (2,021)Foreign-born:
17.7% (105)
White alone - Speak another language Native:
12.7% (296)Foreign-born:
80.8% (479)
Hispanic or Latino - Speak only English Native:
5.4% (49)Foreign-born:
5.5% (108)
Hispanic or Latino - Speak another language Native:
87.1% (784)Foreign-born:
94.5% (1,846)
Foreign-born residents in Seven Corners 4,125 residents are foreign born (22.5% Latin America , 17.1% Asia ).
This city:
45.4%Virginia:
12.6%
Marital status for residents in Seven Corners Marital status - White (Caucasian) population 15 years and over
Males 48.1% Never married43.6% Now married2.8% Separated2.0% Widowed3.4% DivorcedFemales 30.3% Never married56.0% Now married0.0% Separated2.2% Widowed11.5% DivorcedWomen who gave birth in the past 12 months Now married:
100.0% (41)Unmarried:
0.0% (0)
Women who did not give birth in the past 12 months Now married:
56.9% (377)Unmarried:
43.1% (285)
Marital status - Black or African American population 15 years and over
Males 48.0% Never married52.0% Now married0.0% Separated0.0% Widowed0.0% DivorcedFemales 32.3% Never married15.9% Now married6.3% Separated6.9% Widowed38.6% DivorcedWomen who did not give birth in the past 12 months Now married:
21.3% (30)Unmarried:
78.7% (110)
Marital status - American Indian / Alaska Native population 15 years and over
Males 100.0% Never married0.0% Now married0.0% Separated0.0% Widowed0.0% DivorcedFemales 0.0% Never married100.0% Now married0.0% Separated0.0% Widowed0.0% DivorcedWomen who did not give birth in the past 12 months Now married:
100.0% (34)Unmarried:
0.0% (0)
Marital status - Asian population 15 years and over
Males 52.4% Never married39.4% Now married4.3% Separated2.4% Widowed1.5% DivorcedFemales 37.0% Never married37.3% Now married4.8% Separated17.3% Widowed3.6% DivorcedWomen who gave birth in the past 12 months Now married:
100.0% (75)Unmarried:
0.0% (0)
Women who did not give birth in the past 12 months Now married:
32.0% (80)Unmarried:
68.0% (170)
Marital status - Other race population 15 years and over
Males 53.5% Never married43.8% Now married0.0% Separated0.0% Widowed2.7% DivorcedFemales 54.1% Never married33.7% Now married0.0% Separated0.0% Widowed12.2% DivorcedWomen who gave birth in the past 12 months Now married:
66.2% (60)Unmarried:
33.8% (31)
Women who did not give birth in the past 12 months Now married:
23.5% (144)Unmarried:
76.5% (467)
Marital status - Two or more races population 15 years and over
Males 48.0% Never married43.5% Now married0.0% Separated4.8% Widowed3.6% DivorcedFemales 17.9% Never married62.6% Now married6.1% Separated0.0% Widowed13.4% DivorcedWomen who did not give birth in the past 12 months Now married:
49.1% (72)Unmarried:
50.9% (75)
Marital status - White alone, not Hispanic / Latino population 15 years and over
Males 49.1% Never married41.1% Now married3.3% Separated2.4% Widowed4.1% DivorcedFemales 31.2% Never married53.5% Now married0.0% Separated2.8% Widowed12.6% DivorcedWomen who gave birth in the past 12 months Now married:
100.0% (35)Unmarried:
0.0% (0)
Women who did not give birth in the past 12 months Now married:
55.7% (297)Unmarried:
44.3% (236)
Marital status - Hispanic or Latino population 15 years and over
Males 51.3% Never married47.1% Now married0.0% Separated0.0% Widowed1.6% DivorcedFemales 43.2% Never married44.4% Now married0.9% Separated0.0% Widowed11.5% DivorcedWomen who gave birth in the past 12 months Now married:
70.2% (59)Unmarried:
29.8% (25)
Women who did not give birth in the past 12 months Now married:
33.8% (261)Unmarried:
66.2% (510)
Ancestries in Seven Corners
230 3.8% American151 2.5% Arab108 1.8% Ethiopian104 1.7% Moroccan97 1.6% Turkish95 1.6% German80 1.3% Irish68 1.1% Yugoslavian62 1.0% Iraqi57 0.9% English52 0.9% European50 0.8% Italian46 0.8% Nigerian33 0.5% Scottish32 0.5% Polish27 0.4% Eastern European22 0.4% Belgian22 0.4% Greek22 0.4% Iranian20 0.3% African19 0.3% Romanian16 0.3% Austrian16 0.3% Serbian15 0.2% Northern European15 0.2% Russian15 0.2% Slovak10 0.2% Egyptian10 0.2% Czechoslovakian4 0.07% Czech
Children Nativity (place of birth) in Seven Corners
Children under 6 years - Living with two parents Both parents native 110 100.0% NativeBoth parents foreign-born 314 87.9% Native43 12.1% Foreign-bornOne native, one foreign-born parent 29 100.0% NativeChildren under 6 years - Living with one parent Native parent 52 100.0% NativeForeign-born parent 266 100.0% NativeChildren 6 to 17 years - Living with two parents Both parents native 153 100.0% NativeBoth parents foreign-born 327 83.5% Native65 16.5% Foreign-bornOne native, one foreign-born parent 70 100.0% NativeChildren 6 to 17 years - Living with one parent Foreign-born parent 622 53.7% Native537 46.3% Foreign-born
Grandparents responsible for own grandchildren in Seven Corners
Grandparents (30 to 59 years) Other race 38 100.0% Not responsible for grandchildrenHispanic or Latino 23 100.0% Not responsible for grandchildren
Grandparents (60 years and over) Other race 102 100.0% Not responsible for grandchildrenHispanic or Latino 91 100.0% Not responsible for grandchildren