Races in Seffner, Florida (FL) Detailed Stats
Data:
Races - White alone (%)
Races - White alone (% change since 2000)
Races - Black alone (%)
Races - Black alone (% change since 2000)
Races - American Indian alone (%)
Races - American Indian alone (% change since 2000)
Races - Asian alone (%)
Races - Asian alone (% change since 2000)
Races - Hispanic (%)
Races - Hispanic (% change since 2000)
Races - Native Hawaiian and Other Pacific Islander alone (%)
Races - Native Hawaiian and Other Pacific Islander alone (% change since 2000)
Races - Two or more races(%)
Races - Two or more races(% change since 2000)
Races - Other race alone (%)
Races - Other race alone (% change since 2000)
Racial diversity
Place of birth - Born in state of residence (%)
Place of birth - Born in state of residence (%) - White
Place of birth - Born in state of residence (%) - Black or African American
Place of birth - Born in state of residence (%) - Asian
Place of birth - Born in state of residence (%) - Hispanic or Latino
Place of birth - Born in state of residence (%) - American Indian and Alaska Native
Place of birth - Born in state of residence (%) - Multirace
Place of birth - Born in state of residence (%) - Other Race
Place of birth - Born in other state (%)
Place of birth - Born in other state (%) - White
Place of birth - Born in other state (%) - Black or African American
Place of birth - Born in other state (%) - Asian
Place of birth - Born in other state (%) - Hispanic or Latino
Place of birth - Born in other state (%) - American Indian and Alaska Native
Place of birth - Born in other state (%) - Multirace
Place of birth - Born in other state (%) - Other Race
Place of birth - Native, outside of US (%)
Place of birth - Native, outside of US (%) - White
Place of birth - Native, outside of US (%) - Black or African American
Place of birth - Native, outside of US (%) - Asian
Place of birth - Native, outside of US (%) - Hispanic or Latino
Place of birth - Native, outside of US (%) - American Indian and Alaska Native
Place of birth - Native, outside of US (%) - Multirace
Place of birth - Native, outside of US (%) - Other Race
Place of birth - Foreign born (%)
Place of birth - Foreign born (%) - White
Place of birth - Foreign born (%) - Black or African American
Place of birth - Foreign born (%) - Asian
Place of birth - Foreign born (%) - Hispanic or Latino
Place of birth - Foreign born (%) - American Indian and Alaska Native
Place of birth - Foreign born (%) - Multirace
Place of birth - Foreign born (%) - Other Race
Residents speaking English at home (%)
Residents speaking English at home - Born in the United States (%)
Residents speaking English at home - Native, born elsewhere (%)
Residents speaking English at home - Foreign born (%)
Residents speaking Spanish at home (%)
Residents speaking Spanish at home - Born in the United States (%)
Residents speaking Spanish at home - Native, born elsewhere (%)
Residents speaking Spanish at home - Foreign born (%)
Residents speaking other language at home (%)
Residents speaking other language at home - Born in the United States (%)
Residents speaking other language at home - Native, born elsewhere (%)
Residents speaking other language at home - Foreign born (%)
Marital status - Never married (%)
Marital status - Now married (%)
Marital status - Separated (%)
Marital status - Widowed (%)
Marital status - Divorced (%)
Ancestries Reported - Arab (%)
Ancestries Reported - Czech (%)
Ancestries Reported - Danish (%)
Ancestries Reported - Dutch (%)
Ancestries Reported - English (%)
Ancestries Reported - French (%)
Ancestries Reported - French Canadian (%)
Ancestries Reported - German (%)
Ancestries Reported - Greek (%)
Ancestries Reported - Hungarian (%)
Ancestries Reported - Irish (%)
Ancestries Reported - Italian (%)
Ancestries Reported - Lithuanian (%)
Ancestries Reported - Norwegian (%)
Ancestries Reported - Polish (%)
Ancestries Reported - Portuguese (%)
Ancestries Reported - Russian (%)
Ancestries Reported - Scotch-Irish (%)
Ancestries Reported - Scottish (%)
Ancestries Reported - Slovak (%)
Ancestries Reported - Subsaharan African (%)
Ancestries Reported - Swedish (%)
Ancestries Reported - Swiss (%)
Ancestries Reported - Ukrainian (%)
Ancestries Reported - United States (%)
Ancestries Reported - Welsh (%)
Ancestries Reported - West Indian (%)
Ancestries Reported - Other (%)
Geographical mobility - Same house 1 year ago (%)
Geographical mobility - Same house 1 year ago (%) - White
Geographical mobility - Same house 1 year ago (%) - Black or African American
Geographical mobility - Same house 1 year ago (%) - Asian
Geographical mobility - Same house 1 year ago (%) - Hispanic or Latino
Geographical mobility - Same house 1 year ago (%) - American Indian and Alaska Native
Geographical mobility - Same house 1 year ago (%) - Multirace
Geographical mobility - Same house 1 year ago (%) - Other Race
Geographical mobility - Moved within same county (%)
Geographical mobility - Moved within same county (%) - White
Geographical mobility - Moved within same county (%) - Black or African American
Geographical mobility - Moved within same county (%) - Asian
Geographical mobility - Moved within same county (%) - Hispanic or Latino
Geographical mobility - Moved within same county (%) - American Indian and Alaska Native
Geographical mobility - Moved within same county (%) - Multirace
Geographical mobility - Moved within same county (%) - Other Race
Geographical mobility - Moved from different county within same state (%)
Geographical mobility - Moved from different county within same state (%) - White
Geographical mobility - Moved from different county within same state (%) - Black or African American
Geographical mobility - Moved from different county within same state (%) - Asian
Geographical mobility - Moved from different county within same state (%) - Hispanic or Latino
Geographical mobility - Moved from different county within same state (%) - American Indian and Alaska Native
Geographical mobility - Moved from different county within same state (%) - Multirace
Geographical mobility - Moved from different county within same state (%) - Other Race
Geographical mobility - Moved from different state (%)
Geographical mobility - Moved from different state (%) - White
Geographical mobility - Moved from different state (%) - Black or African American
Geographical mobility - Moved from different state (%) - Asian
Geographical mobility - Moved from different state (%) - Hispanic or Latino
Geographical mobility - Moved from different state (%) - American Indian and Alaska Native
Geographical mobility - Moved from different state (%) - Multirace
Geographical mobility - Moved from different state (%) - Other Race
Geographical mobility - Moved from abroad (%)
Geographical mobility - Moved from abroad (%) - White
Geographical mobility - Moved from abroad (%) - Black or African American
Geographical mobility - Moved from abroad (%) - Asian
Geographical mobility - Moved from abroad (%) - Hispanic or Latino
Geographical mobility - Moved from abroad (%) - American Indian and Alaska Native
Geographical mobility - Moved from abroad (%) - Multirace
Geographical mobility - Moved from abroad (%) - Other Race
Place of birth for the foreign-born population - Ireland (%)
Place of birth for the foreign-born population - Denmark (%)
Place of birth for the foreign-born population - Norway (%)
Place of birth for the foreign-born population - Sweden (%)
Place of birth for the foreign-born population - United Kingdom (%)
Place of birth for the foreign-born population - England (%)
Place of birth for the foreign-born population - Scotland (%)
Place of birth for the foreign-born population - Other Northern Europe (%)
Place of birth for the foreign-born population - Austria (%)
Place of birth for the foreign-born population - Belgium (%)
Place of birth for the foreign-born population - France (%)
Place of birth for the foreign-born population - Germany (%)
Place of birth for the foreign-born population - Netherlands (%)
Place of birth for the foreign-born population - Switzerland (%)
Place of birth for the foreign-born population - Other Western Europe (%)
Place of birth for the foreign-born population - Greece (%)
Place of birth for the foreign-born population - Italy (%)
Place of birth for the foreign-born population - Portugal (%)
Place of birth for the foreign-born population - Spain (%)
Place of birth for the foreign-born population - Other Southern Europe (%)
Place of birth for the foreign-born population - Albania (%)
Place of birth for the foreign-born population - Belarus (%)
Place of birth for the foreign-born population - Bosnia and Herzegovina (%)
Place of birth for the foreign-born population - Bulgaria (%)
Place of birth for the foreign-born population - Croatia (%)
Place of birth for the foreign-born population - Czechoslovakia (%)
Place of birth for the foreign-born population - Hungary (%)
Place of birth for the foreign-born population - Latvia (%)
Place of birth for the foreign-born population - Lithuania (%)
Place of birth for the foreign-born population - North Macedonia (Macedonia) (%)
Place of birth for the foreign-born population - Moldova (%)
Place of birth for the foreign-born population - Poland (%)
Place of birth for the foreign-born population - Romania (%)
Place of birth for the foreign-born population - Russia (%)
Place of birth for the foreign-born population - Serbia (%)
Place of birth for the foreign-born population - Ukraine (%)
Place of birth for the foreign-born population - Other Eastern Europe (%)
Place of birth for the foreign-born population - China (%)
Place of birth for the foreign-born population - Hong Kong (%)
Place of birth for the foreign-born population - Taiwan (%)
Place of birth for the foreign-born population - Japan (%)
Place of birth for the foreign-born population - Korea (%)
Place of birth for the foreign-born population - Other Eastern Asia (%)
Place of birth for the foreign-born population - Afghanistan (%)
Place of birth for the foreign-born population - Bangladesh (%)
Place of birth for the foreign-born population - India (%)
Place of birth for the foreign-born population - Iran (%)
Place of birth for the foreign-born population - Kazakhstan (%)
Place of birth for the foreign-born population - Nepal (%)
Place of birth for the foreign-born population - Pakistan (%)
Place of birth for the foreign-born population - Sri Lanka (%)
Place of birth for the foreign-born population - Uzbekistan (%)
Place of birth for the foreign-born population - Other South Central Asia (%)
Place of birth for the foreign-born population - Burma (%)
Place of birth for the foreign-born population - Cambodia (%)
Place of birth for the foreign-born population - Indonesia (%)
Place of birth for the foreign-born population - Laos (%)
Place of birth for the foreign-born population - Malaysia (%)
Place of birth for the foreign-born population - Philippines (%)
Place of birth for the foreign-born population - Singapore (%)
Place of birth for the foreign-born population - Thailand (%)
Place of birth for the foreign-born population - Vietnam (%)
Place of birth for the foreign-born population - Other South Eastern Asia (%)
Place of birth for the foreign-born population - Armenia (%)
Place of birth for the foreign-born population - Iraq (%)
Place of birth for the foreign-born population - Israel (%)
Place of birth for the foreign-born population - Jordan (%)
Place of birth for the foreign-born population - Kuwait (%)
Place of birth for the foreign-born population - Lebanon (%)
Place of birth for the foreign-born population - Saudi Arabia (%)
Place of birth for the foreign-born population - Syria (%)
Place of birth for the foreign-born population - Turkey (%)
Place of birth for the foreign-born population - Yemen (%)
Place of birth for the foreign-born population - Other Western Asia (%)
Place of birth for the foreign-born population - Eritrea (%)
Place of birth for the foreign-born population - Ethiopia (%)
Place of birth for the foreign-born population - Kenya (%)
Place of birth for the foreign-born population - Somalia (%)
Place of birth for the foreign-born population - Uganda (%)
Place of birth for the foreign-born population - Zimbabwe (%)
Place of birth for the foreign-born population - Other Eastern Africa (%)
Place of birth for the foreign-born population - Cameroon (%)
Place of birth for the foreign-born population - Congo (%)
Place of birth for the foreign-born population - Democratic Republic of Congo (Zaire) (%)
Place of birth for the foreign-born population - Other Middle Africa (%)
Place of birth for the foreign-born population - Egypt (%)
Place of birth for the foreign-born population - Morocco (%)
Place of birth for the foreign-born population - Sudan (%)
Place of birth for the foreign-born population - Other Northern Africa (%)
Place of birth for the foreign-born population - South Africa (%)
Place of birth for the foreign-born population - Other Southern Africa (%)
Place of birth for the foreign-born population - Cabo Verde (%)
Place of birth for the foreign-born population - Ghana (%)
Place of birth for the foreign-born population - Liberia (%)
Place of birth for the foreign-born population - Nigeria (%)
Place of birth for the foreign-born population - Senegal (%)
Place of birth for the foreign-born population - Sierra Leone (%)
Place of birth for the foreign-born population - Other Western Africa (%)
Place of birth for the foreign-born population - Australia (%)
Place of birth for the foreign-born population - New Zealand (%)
Place of birth for the foreign-born population - Fiji (%)
Place of birth for the foreign-born population - Micronesia (%)
Place of birth for the foreign-born population - Bahamas (%)
Place of birth for the foreign-born population - Barbados (%)
Place of birth for the foreign-born population - Cuba (%)
Place of birth for the foreign-born population - Dominica (%)
Place of birth for the foreign-born population - Dominican Republic (%)
Place of birth for the foreign-born population - Grenada (%)
Place of birth for the foreign-born population - Haiti (%)
Place of birth for the foreign-born population - Jamaica (%)
Place of birth for the foreign-born population - St. Vincent and the Grenadines (%)
Place of birth for the foreign-born population - Trinidad and Tobago (%)
Place of birth for the foreign-born population - West Indies (%)
Place of birth for the foreign-born population - Other Caribbean (%)
Place of birth for the foreign-born population - Belize (%)
Place of birth for the foreign-born population - Costa Rica (%)
Place of birth for the foreign-born population - El Salvador (%)
Place of birth for the foreign-born population - Guatemala (%)
Place of birth for the foreign-born population - Honduras (%)
Place of birth for the foreign-born population - Mexico (%)
Place of birth for the foreign-born population - Nicaragua (%)
Place of birth for the foreign-born population - Panama (%)
Place of birth for the foreign-born population - Other Central America (%)
Place of birth for the foreign-born population - Argentina (%)
Place of birth for the foreign-born population - Bolivia (%)
Place of birth for the foreign-born population - Brazil (%)
Place of birth for the foreign-born population - Chile (%)
Place of birth for the foreign-born population - Colombia (%)
Place of birth for the foreign-born population - Ecuador (%)
Place of birth for the foreign-born population - Guyana (%)
Place of birth for the foreign-born population - Peru (%)
Place of birth for the foreign-born population - Uruguay (%)
Place of birth for the foreign-born population - Venezuela (%)
Place of birth for the foreign-born population - Other South America (%)
Place of birth for the foreign-born population - Canada (%)
Place of birth for the foreign-born population - Other Northern America (%)
Place of birth for the foreign-born population - Other (%)
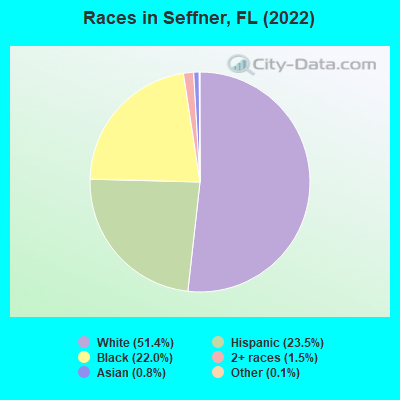
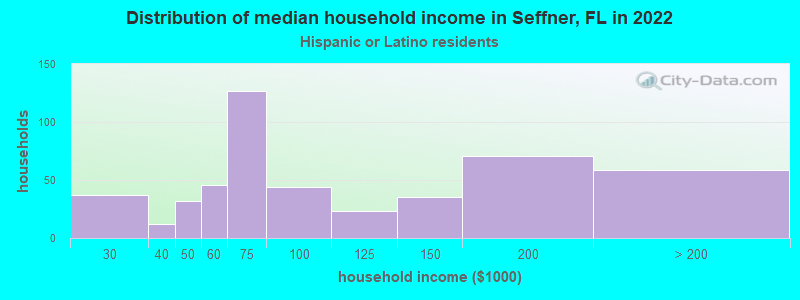
According to 2022 data, the most numerous races in Seffner, FL are White alone (4,557 residents), Hispanic (2,081 residents), and Black alone (1,953 residents). 80.5% of Seffner residents speak English at home. 5.4% of Seffner, FL residents are foreign-born (3.1% born in Latin America, 1.2% born in Asia, 0.5% born in Europe), which is 288.4% less than the foreign-born rate of 21.0% across the entire state of Florida.
Race distribution in Seffner
2000 2022
10,458,509 65.4% White alone 2,682,715 16.8% Hispanic 2,264,268 14.2% Black alone 261,693 1.6% Asian alone 236,954 1.5% Two or more races 42,358 0.3% American Indian alone 28,994 0.2% Other race alone 6,887 0.04% Native Hawaiian and Other
11,309,403 50.8% White alone 6,025,039 27.1% Hispanic 3,241,015 14.6% Black alone 861,630 3.9% Two or more races 623,692 2.8% Asian alone 152,054 0.7% Other race alone 22,504 0.1% American Indian alone 9,486 0.04% Native Hawaiian and Other
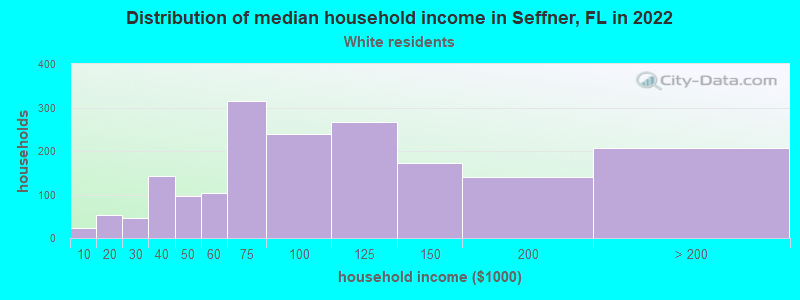
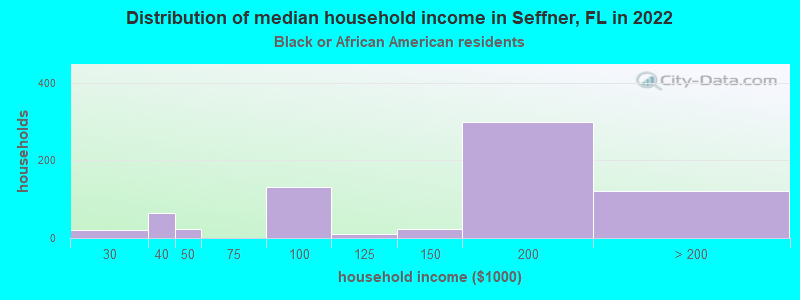
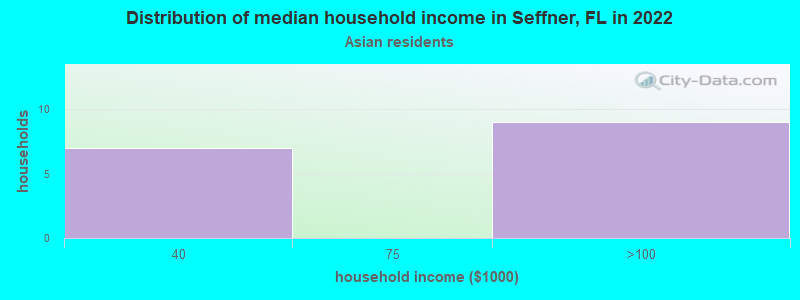
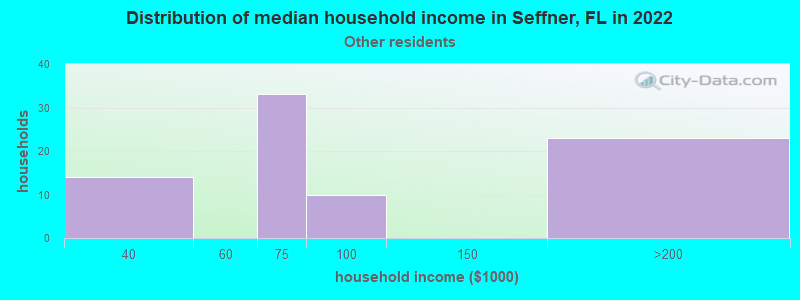
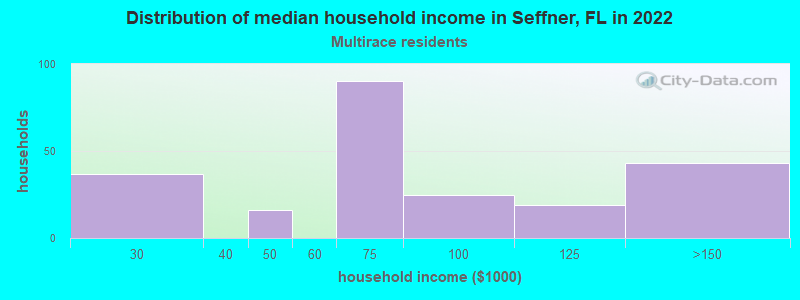
Income and house value in Seffner Median household income in 2022 $85,898 White non-Hispanic householders$180,920 Black householders$72,322 Some other race householders$62,686 Two or more races householders$69,625 Hispanic or Latino race householdersMedian 2022 house value $362,482 White Non-Hispanic householders$458,193 Black or African American householders$560,014 American Indian or Alaska Native householders $545,352 Asian householders$305,462 Some other race householders$224,005 Two or more races householders$355,965 Hispanic or Latino householders
Median age by race in Seffner
45.1 Median age for White residents42.1 49.2 31.6 Median age for Black or African American residents32.4 30.8 -670,487,105.3 Median age for American Indian / Alaska Native residents-676,245,210.1 -655,399,060.4 52.6 Median age for Asian residents45.2 70.0 -848,484,847.6 Median age for Native Hawaiian / Pacific Islander residents-776,729,559.0 -490,118,576.6 47.9 Median age for Other race residents48.3 52.6 18.4 Median age for Two or more races residents26.3 17.5 44.8 Median age for White alone residents41.1 51.4 30.5 Median age for Hispanic or Latino residents32.5 22.3
Owner/renter occupied households by race in Seffner
House owners and renters - White residents 1,548 84.8% Owner occupied277 15.2% Renter occupiedHouse owners and renters - Black or African American residents 657 97.2% Owner occupied19 2.8% Renter occupiedHouse owners and renters - American Indian / Alaska Native residents 12 100.0% Owner occupiedHouse owners and renters - Asian residents 18 100.0% Owner occupiedHouse owners and renters - Other race residents 81 100.0% Owner occupiedHouse owners and renters - Two or more races residents 233 85.1% Owner occupied41 14.9% Renter occupiedHouse owners and renters - White alone residents 1,506 84.4% Owner occupied278 15.6% Renter occupiedHouse owners and renters - Hispanic or Latino residents 420 83.9% Owner occupied80 16.1% Renter occupied
Language usage in Seffner
English speakers - Total 80.5% of residents of Seffner speak English at home.
15.8% of residents speak Spanish at home 790 61.8% Speak English very well489 38.2% Speak English less than very well3.2% of residents speak other language at home 226 87.6% Speak English very well32 12.4% Speak English less than very well
English speakers - Born in the United States 92.0% of residents of Seffner speak English at home.
6.9% of residents speak Spanish at home 194 94.2% Speak English very well12 5.8% Speak English less than very well1.2% of residents speak other language at home 35 100.0% Speak English very well
English speakers - Native, born elsewhere 18.1% of residents of Seffner speak English at home.
73.6% of residents speak Spanish at home 235 46.5% Speak English very well270 53.5% Speak English less than very well11.4% of residents speak other language at home 78 100.0% Speak English very well
English speakers - Foreign-born 21.0% of residents of Seffner speak English at home.
58.1% of residents speak Spanish at home 112 38.6% Speak English very well178 61.4% Speak English less than very well19.8% of residents speak other language at home 68 68.7% Speak English very well31 31.3% Speak English less than very well
White (Caucasian) - Speak only English Native:
93.9% (4,145)Foreign-born:
79.9% (65)
White (Caucasian) - Speak another language Native:
6.1% (269)Foreign-born:
46.1% (37)
Black or African American - Speak only English Native:
93.9% (1,655)Foreign-born:
23.4% (16)
Black or African American - Speak another language Native:
6.0% (107)Foreign-born:
76.9% (53)
Asian - Speak only English Native:
15.8% (5)Foreign-born:
25.5% (10)
Asian - Speak another language Native:
90.8% (28)Foreign-born:
74.7% (29)
Other race - Speak another language Native:
45.3% (32)Foreign-born:
100.0% (123)
Two or more races - Speak another language Native:
57.1% (645)Foreign-born:
100.0% (157)
White alone - Speak only English Native:
95.9% (4,057)Foreign-born:
81.7% (77)
White alone - Speak another language Native:
4.0% (169)Foreign-born:
22.4% (21)
Hispanic or Latino - Speak another language Native:
59.8% (867)Foreign-born:
100.0% (291)
Foreign-born residents in Seffner 479 residents are foreign born (3.1% Latin America , 1.2% Asia , 0.5% Europe ).
This city:
5.4%Florida:
21.1%
Marital status for residents in Seffner Marital status - White (Caucasian) population 15 years and over
Males 30.8% Never married55.4% Now married1.3% Separated1.7% Widowed10.8% DivorcedFemales 18.0% Never married54.0% Now married1.7% Separated10.6% Widowed15.7% DivorcedWomen who gave birth in the past 12 months Now married:
100.0% (37)Unmarried:
0.0% (0)
Women who did not give birth in the past 12 months Now married:
47.9% (356)Unmarried:
52.1% (387)
Marital status - Black or African American population 15 years and over
Males 43.1% Never married56.0% Now married0.0% Separated0.0% Widowed0.9% DivorcedFemales 48.1% Never married48.8% Now married0.6% Separated0.0% Widowed2.5% DivorcedWomen who gave birth in the past 12 months Now married:
0.0% (0)Unmarried:
100.0% (101)
Women who did not give birth in the past 12 months Now married:
50.0% (242)Unmarried:
50.0% (242)
Marital status - American Indian / Alaska Native population 15 years and over
Males 0.0% Never married100.0% Now married0.0% Separated0.0% Widowed0.0% DivorcedFemales 0.0% Never married0.0% Now married0.0% Separated100.0% Widowed0.0% DivorcedMarital status - Asian population 15 years and over
Males 12.8% Never married87.2% Now married0.0% Separated0.0% Widowed0.0% DivorcedFemales 0.0% Never married76.9% Now married0.0% Separated0.0% Widowed23.1% DivorcedMarital status - Other race population 15 years and over
Males 17.7% Never married68.8% Now married0.0% Separated0.0% Widowed13.5% DivorcedFemales 10.7% Never married69.6% Now married0.0% Separated0.0% Widowed19.6% DivorcedWomen who gave birth in the past 12 months Now married:
100.0% (16)Unmarried:
0.0% (0)
Women who did not give birth in the past 12 months Now married:
40.0% (5)Unmarried:
60.0% (8)
Marital status - Two or more races population 15 years and over
Males 35.3% Never married52.2% Now married0.0% Separated0.0% Widowed12.4% DivorcedFemales 41.8% Never married42.5% Now married0.0% Separated7.2% Widowed8.5% DivorcedWomen who gave birth in the past 12 months Now married:
100.0% (86)Unmarried:
0.0% (0)
Women who did not give birth in the past 12 months Now married:
39.7% (145)Unmarried:
60.3% (220)
Marital status - White alone, not Hispanic / Latino population 15 years and over
Males 30.9% Never married54.9% Now married1.5% Separated1.9% Widowed10.8% DivorcedFemales 15.1% Never married56.7% Now married1.0% Separated11.7% Widowed15.6% DivorcedWomen who gave birth in the past 12 months Now married:
100.0% (29)Unmarried:
0.0% (0)
Women who did not give birth in the past 12 months Now married:
55.5% (398)Unmarried:
44.5% (318)
Marital status - Hispanic or Latino population 15 years and over
Males 24.1% Never married65.3% Now married0.0% Separated0.0% Widowed10.6% DivorcedFemales 39.6% Never married42.7% Now married2.3% Separated3.2% Widowed12.3% DivorcedWomen who gave birth in the past 12 months Now married:
100.0% (85)Unmarried:
0.0% (0)
Women who did not give birth in the past 12 months Now married:
27.7% (113)Unmarried:
72.3% (296)
Ancestries in Seffner
637 11.4% American334 6.0% German302 5.4% Irish278 5.0% English243 4.4% Belgian206 3.7% African125 2.2% Italian59 1.1% Ukrainian58 1.0% French40 0.7% Scotch-Irish24 0.4% Scottish23 0.4% Guyanese22 0.4% Dutch20 0.4% Welsh19 0.3% European18 0.3% British14 0.3% Palestinian13 0.2% French Canadian13 0.2% Russian9 0.2% Polish8 0.1% Canadian7 0.1% Northern European7 0.1% Slovak7 0.1% Swedish6 0.1% Czech6 0.1% Greek6 0.1% Norwegian
Geographical mobility in Seffner Same house 1 year ago 4,111 90.8% White (Caucasian)1,950 97.7% Black or African American8 28.7% American Indian / Alaska Native76 100.0% Asian188 89.8% Other race1,369 94.7% Two or more races4,305 94.6% White alone, not Hispanic / Latino1,522 81.4% Hispanic or LatinoMoved within same county 186 4.1% White / Caucasian77 3.9% Black or African American15 55.8% American Indian / Alaska Native54 3.7% Two or more races62 1.4% White alone, not Hispanic / Latino205 11.0% Hispanic or LatinoMoved within same state 65 1.4% White / Caucasian9 4.1% Other race19 1.3% Two or more races26 0.6% White alone, not Hispanic / Latino70 3.7% Hispanic or LatinoMoved from different state 222 4.9% White / Caucasian238 5.2% White alone, not Hispanic / LatinoMoved from abroad 10 0.2% White29 1.5% Black or African American27 12.9% Other race17 0.4% White alone, not Hispanic / Latino57 3.0% Hispanic or Latino
Children Nativity (place of birth) in Seffner
Children under 6 years - Living with two parents Both parents native 569 100.0% NativeBoth parents foreign-born 45 100.0% NativeOne native, one foreign-born parent 56 100.0% NativeChildren under 6 years - Living with one parent Native parent 161 100.0% NativeChildren 6 to 17 years - Living with two parents Both parents native 642 100.0% NativeBoth parents foreign-born 12 43.9% Native15 56.1% Foreign-bornOne native, one foreign-born parent 40 100.0% NativeChildren 6 to 17 years - Living with one parent Native parent 538 100.0% NativeForeign-born parent 40 54.5% Native34 45.5% Foreign-born
Grandparents responsible for own grandchildren in Seffner
Grandparents (30 to 59 years) White / Caucasian 11 100.0% Not responsible for grandchildrenBlack or African American 155 100.0% Not responsible for grandchildrenTwo or more races 74 100.0% Not responsible for grandchildrenWhite alone, not Hispanic / Latino 9 100.0% Not responsible for grandchildrenHispanic or Latino 43 100.0% Not responsible for grandchildrenGrandparents (60 years and over) White / Caucasian 19 18.9% Responsible for grandchildren83 81.1% Not responsible for grandchildrenBlack or African American 5 36.1% Responsible for grandchildren10 63.9% Not responsible for grandchildrenTwo or more races 19 26.6% Responsible for grandchildren53 73.4% Not responsible for grandchildrenWhite alone, not Hispanic / Latino 24 24.7% Responsible for grandchildren72 75.3% Not responsible for grandchildrenHispanic or Latino 13 12.6% Responsible for grandchildren91 87.4% Not responsible for grandchildren