Races in Seabrook, Maryland (MD) Detailed Stats
Data:
Races - White alone (%)
Races - White alone (% change since 2000)
Races - Black alone (%)
Races - Black alone (% change since 2000)
Races - American Indian alone (%)
Races - American Indian alone (% change since 2000)
Races - Asian alone (%)
Races - Asian alone (% change since 2000)
Races - Hispanic (%)
Races - Hispanic (% change since 2000)
Races - Native Hawaiian and Other Pacific Islander alone (%)
Races - Native Hawaiian and Other Pacific Islander alone (% change since 2000)
Races - Two or more races(%)
Races - Two or more races(% change since 2000)
Races - Other race alone (%)
Races - Other race alone (% change since 2000)
Racial diversity
Place of birth - Born in state of residence (%)
Place of birth - Born in state of residence (%) - White
Place of birth - Born in state of residence (%) - Black or African American
Place of birth - Born in state of residence (%) - Asian
Place of birth - Born in state of residence (%) - Hispanic or Latino
Place of birth - Born in state of residence (%) - American Indian and Alaska Native
Place of birth - Born in state of residence (%) - Multirace
Place of birth - Born in state of residence (%) - Other Race
Place of birth - Born in other state (%)
Place of birth - Born in other state (%) - White
Place of birth - Born in other state (%) - Black or African American
Place of birth - Born in other state (%) - Asian
Place of birth - Born in other state (%) - Hispanic or Latino
Place of birth - Born in other state (%) - American Indian and Alaska Native
Place of birth - Born in other state (%) - Multirace
Place of birth - Born in other state (%) - Other Race
Place of birth - Native, outside of US (%)
Place of birth - Native, outside of US (%) - White
Place of birth - Native, outside of US (%) - Black or African American
Place of birth - Native, outside of US (%) - Asian
Place of birth - Native, outside of US (%) - Hispanic or Latino
Place of birth - Native, outside of US (%) - American Indian and Alaska Native
Place of birth - Native, outside of US (%) - Multirace
Place of birth - Native, outside of US (%) - Other Race
Place of birth - Foreign born (%)
Place of birth - Foreign born (%) - White
Place of birth - Foreign born (%) - Black or African American
Place of birth - Foreign born (%) - Asian
Place of birth - Foreign born (%) - Hispanic or Latino
Place of birth - Foreign born (%) - American Indian and Alaska Native
Place of birth - Foreign born (%) - Multirace
Place of birth - Foreign born (%) - Other Race
Residents speaking English at home (%)
Residents speaking English at home - Born in the United States (%)
Residents speaking English at home - Native, born elsewhere (%)
Residents speaking English at home - Foreign born (%)
Residents speaking Spanish at home (%)
Residents speaking Spanish at home - Born in the United States (%)
Residents speaking Spanish at home - Native, born elsewhere (%)
Residents speaking Spanish at home - Foreign born (%)
Residents speaking other language at home (%)
Residents speaking other language at home - Born in the United States (%)
Residents speaking other language at home - Native, born elsewhere (%)
Residents speaking other language at home - Foreign born (%)
Marital status - Never married (%)
Marital status - Now married (%)
Marital status - Separated (%)
Marital status - Widowed (%)
Marital status - Divorced (%)
Ancestries Reported - Arab (%)
Ancestries Reported - Czech (%)
Ancestries Reported - Danish (%)
Ancestries Reported - Dutch (%)
Ancestries Reported - English (%)
Ancestries Reported - French (%)
Ancestries Reported - French Canadian (%)
Ancestries Reported - German (%)
Ancestries Reported - Greek (%)
Ancestries Reported - Hungarian (%)
Ancestries Reported - Irish (%)
Ancestries Reported - Italian (%)
Ancestries Reported - Lithuanian (%)
Ancestries Reported - Norwegian (%)
Ancestries Reported - Polish (%)
Ancestries Reported - Portuguese (%)
Ancestries Reported - Russian (%)
Ancestries Reported - Scotch-Irish (%)
Ancestries Reported - Scottish (%)
Ancestries Reported - Slovak (%)
Ancestries Reported - Subsaharan African (%)
Ancestries Reported - Swedish (%)
Ancestries Reported - Swiss (%)
Ancestries Reported - Ukrainian (%)
Ancestries Reported - United States (%)
Ancestries Reported - Welsh (%)
Ancestries Reported - West Indian (%)
Ancestries Reported - Other (%)
Geographical mobility - Same house 1 year ago (%)
Geographical mobility - Same house 1 year ago (%) - White
Geographical mobility - Same house 1 year ago (%) - Black or African American
Geographical mobility - Same house 1 year ago (%) - Asian
Geographical mobility - Same house 1 year ago (%) - Hispanic or Latino
Geographical mobility - Same house 1 year ago (%) - American Indian and Alaska Native
Geographical mobility - Same house 1 year ago (%) - Multirace
Geographical mobility - Same house 1 year ago (%) - Other Race
Geographical mobility - Moved within same county (%)
Geographical mobility - Moved within same county (%) - White
Geographical mobility - Moved within same county (%) - Black or African American
Geographical mobility - Moved within same county (%) - Asian
Geographical mobility - Moved within same county (%) - Hispanic or Latino
Geographical mobility - Moved within same county (%) - American Indian and Alaska Native
Geographical mobility - Moved within same county (%) - Multirace
Geographical mobility - Moved within same county (%) - Other Race
Geographical mobility - Moved from different county within same state (%)
Geographical mobility - Moved from different county within same state (%) - White
Geographical mobility - Moved from different county within same state (%) - Black or African American
Geographical mobility - Moved from different county within same state (%) - Asian
Geographical mobility - Moved from different county within same state (%) - Hispanic or Latino
Geographical mobility - Moved from different county within same state (%) - American Indian and Alaska Native
Geographical mobility - Moved from different county within same state (%) - Multirace
Geographical mobility - Moved from different county within same state (%) - Other Race
Geographical mobility - Moved from different state (%)
Geographical mobility - Moved from different state (%) - White
Geographical mobility - Moved from different state (%) - Black or African American
Geographical mobility - Moved from different state (%) - Asian
Geographical mobility - Moved from different state (%) - Hispanic or Latino
Geographical mobility - Moved from different state (%) - American Indian and Alaska Native
Geographical mobility - Moved from different state (%) - Multirace
Geographical mobility - Moved from different state (%) - Other Race
Geographical mobility - Moved from abroad (%)
Geographical mobility - Moved from abroad (%) - White
Geographical mobility - Moved from abroad (%) - Black or African American
Geographical mobility - Moved from abroad (%) - Asian
Geographical mobility - Moved from abroad (%) - Hispanic or Latino
Geographical mobility - Moved from abroad (%) - American Indian and Alaska Native
Geographical mobility - Moved from abroad (%) - Multirace
Geographical mobility - Moved from abroad (%) - Other Race
Place of birth for the foreign-born population - Ireland (%)
Place of birth for the foreign-born population - Denmark (%)
Place of birth for the foreign-born population - Norway (%)
Place of birth for the foreign-born population - Sweden (%)
Place of birth for the foreign-born population - United Kingdom (%)
Place of birth for the foreign-born population - England (%)
Place of birth for the foreign-born population - Scotland (%)
Place of birth for the foreign-born population - Other Northern Europe (%)
Place of birth for the foreign-born population - Austria (%)
Place of birth for the foreign-born population - Belgium (%)
Place of birth for the foreign-born population - France (%)
Place of birth for the foreign-born population - Germany (%)
Place of birth for the foreign-born population - Netherlands (%)
Place of birth for the foreign-born population - Switzerland (%)
Place of birth for the foreign-born population - Other Western Europe (%)
Place of birth for the foreign-born population - Greece (%)
Place of birth for the foreign-born population - Italy (%)
Place of birth for the foreign-born population - Portugal (%)
Place of birth for the foreign-born population - Spain (%)
Place of birth for the foreign-born population - Other Southern Europe (%)
Place of birth for the foreign-born population - Albania (%)
Place of birth for the foreign-born population - Belarus (%)
Place of birth for the foreign-born population - Bosnia and Herzegovina (%)
Place of birth for the foreign-born population - Bulgaria (%)
Place of birth for the foreign-born population - Croatia (%)
Place of birth for the foreign-born population - Czechoslovakia (%)
Place of birth for the foreign-born population - Hungary (%)
Place of birth for the foreign-born population - Latvia (%)
Place of birth for the foreign-born population - Lithuania (%)
Place of birth for the foreign-born population - North Macedonia (Macedonia) (%)
Place of birth for the foreign-born population - Moldova (%)
Place of birth for the foreign-born population - Poland (%)
Place of birth for the foreign-born population - Romania (%)
Place of birth for the foreign-born population - Russia (%)
Place of birth for the foreign-born population - Serbia (%)
Place of birth for the foreign-born population - Ukraine (%)
Place of birth for the foreign-born population - Other Eastern Europe (%)
Place of birth for the foreign-born population - China (%)
Place of birth for the foreign-born population - Hong Kong (%)
Place of birth for the foreign-born population - Taiwan (%)
Place of birth for the foreign-born population - Japan (%)
Place of birth for the foreign-born population - Korea (%)
Place of birth for the foreign-born population - Other Eastern Asia (%)
Place of birth for the foreign-born population - Afghanistan (%)
Place of birth for the foreign-born population - Bangladesh (%)
Place of birth for the foreign-born population - India (%)
Place of birth for the foreign-born population - Iran (%)
Place of birth for the foreign-born population - Kazakhstan (%)
Place of birth for the foreign-born population - Nepal (%)
Place of birth for the foreign-born population - Pakistan (%)
Place of birth for the foreign-born population - Sri Lanka (%)
Place of birth for the foreign-born population - Uzbekistan (%)
Place of birth for the foreign-born population - Other South Central Asia (%)
Place of birth for the foreign-born population - Burma (%)
Place of birth for the foreign-born population - Cambodia (%)
Place of birth for the foreign-born population - Indonesia (%)
Place of birth for the foreign-born population - Laos (%)
Place of birth for the foreign-born population - Malaysia (%)
Place of birth for the foreign-born population - Philippines (%)
Place of birth for the foreign-born population - Singapore (%)
Place of birth for the foreign-born population - Thailand (%)
Place of birth for the foreign-born population - Vietnam (%)
Place of birth for the foreign-born population - Other South Eastern Asia (%)
Place of birth for the foreign-born population - Armenia (%)
Place of birth for the foreign-born population - Iraq (%)
Place of birth for the foreign-born population - Israel (%)
Place of birth for the foreign-born population - Jordan (%)
Place of birth for the foreign-born population - Kuwait (%)
Place of birth for the foreign-born population - Lebanon (%)
Place of birth for the foreign-born population - Saudi Arabia (%)
Place of birth for the foreign-born population - Syria (%)
Place of birth for the foreign-born population - Turkey (%)
Place of birth for the foreign-born population - Yemen (%)
Place of birth for the foreign-born population - Other Western Asia (%)
Place of birth for the foreign-born population - Eritrea (%)
Place of birth for the foreign-born population - Ethiopia (%)
Place of birth for the foreign-born population - Kenya (%)
Place of birth for the foreign-born population - Somalia (%)
Place of birth for the foreign-born population - Uganda (%)
Place of birth for the foreign-born population - Zimbabwe (%)
Place of birth for the foreign-born population - Other Eastern Africa (%)
Place of birth for the foreign-born population - Cameroon (%)
Place of birth for the foreign-born population - Congo (%)
Place of birth for the foreign-born population - Democratic Republic of Congo (Zaire) (%)
Place of birth for the foreign-born population - Other Middle Africa (%)
Place of birth for the foreign-born population - Egypt (%)
Place of birth for the foreign-born population - Morocco (%)
Place of birth for the foreign-born population - Sudan (%)
Place of birth for the foreign-born population - Other Northern Africa (%)
Place of birth for the foreign-born population - South Africa (%)
Place of birth for the foreign-born population - Other Southern Africa (%)
Place of birth for the foreign-born population - Cabo Verde (%)
Place of birth for the foreign-born population - Ghana (%)
Place of birth for the foreign-born population - Liberia (%)
Place of birth for the foreign-born population - Nigeria (%)
Place of birth for the foreign-born population - Senegal (%)
Place of birth for the foreign-born population - Sierra Leone (%)
Place of birth for the foreign-born population - Other Western Africa (%)
Place of birth for the foreign-born population - Australia (%)
Place of birth for the foreign-born population - New Zealand (%)
Place of birth for the foreign-born population - Fiji (%)
Place of birth for the foreign-born population - Micronesia (%)
Place of birth for the foreign-born population - Bahamas (%)
Place of birth for the foreign-born population - Barbados (%)
Place of birth for the foreign-born population - Cuba (%)
Place of birth for the foreign-born population - Dominica (%)
Place of birth for the foreign-born population - Dominican Republic (%)
Place of birth for the foreign-born population - Grenada (%)
Place of birth for the foreign-born population - Haiti (%)
Place of birth for the foreign-born population - Jamaica (%)
Place of birth for the foreign-born population - St. Vincent and the Grenadines (%)
Place of birth for the foreign-born population - Trinidad and Tobago (%)
Place of birth for the foreign-born population - West Indies (%)
Place of birth for the foreign-born population - Other Caribbean (%)
Place of birth for the foreign-born population - Belize (%)
Place of birth for the foreign-born population - Costa Rica (%)
Place of birth for the foreign-born population - El Salvador (%)
Place of birth for the foreign-born population - Guatemala (%)
Place of birth for the foreign-born population - Honduras (%)
Place of birth for the foreign-born population - Mexico (%)
Place of birth for the foreign-born population - Nicaragua (%)
Place of birth for the foreign-born population - Panama (%)
Place of birth for the foreign-born population - Other Central America (%)
Place of birth for the foreign-born population - Argentina (%)
Place of birth for the foreign-born population - Bolivia (%)
Place of birth for the foreign-born population - Brazil (%)
Place of birth for the foreign-born population - Chile (%)
Place of birth for the foreign-born population - Colombia (%)
Place of birth for the foreign-born population - Ecuador (%)
Place of birth for the foreign-born population - Guyana (%)
Place of birth for the foreign-born population - Peru (%)
Place of birth for the foreign-born population - Uruguay (%)
Place of birth for the foreign-born population - Venezuela (%)
Place of birth for the foreign-born population - Other South America (%)
Place of birth for the foreign-born population - Canada (%)
Place of birth for the foreign-born population - Other Northern America (%)
Place of birth for the foreign-born population - Other (%)
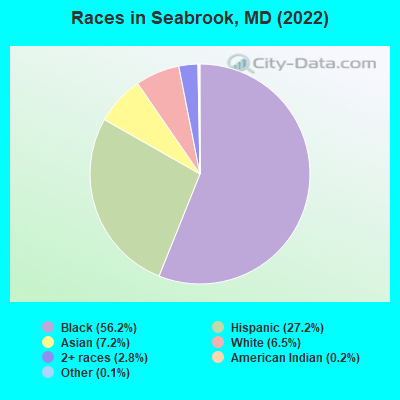
According to 2022 data, the most numerous races in Seabrook, MD are White alone (1,249 residents), Black alone (10,765 residents), and Hispanic (5,212 residents). 53.8% of Seabrook residents speak English at home.
Race distribution in Seabrook 10,765 56.2% Black alone 5,212 27.2% Hispanic 1,377 7.2% Asian alone 1,249 6.5% White alone 545 2.8% Two or more races 29 0.2% American Indian alone 24 0.1% Other race alone
2000 2022
3,286,547 62.1% White alone 1,464,735 27.7% Black alone 227,916 4.3% Hispanic 209,738 4.0% Asian alone 82,946 1.6% Two or more races 13,312 0.3% American Indian alone 9,379 0.2% Other race alone 1,913 0.04% Native Hawaiian and Other
2,906,492 47.1% White alone 1,800,914 29.2% Black alone 705,842 11.4% Hispanic 401,818 6.5% Asian alone 291,317 4.7% Two or more races 46,930 0.8% Other race alone 8,930 0.1% American Indian alone 2,417 0.04% Native Hawaiian and Other
Income and house value in Seabrook Median household income in 2022 $110,052 White non-Hispanic householders$93,646 Black householders$87,815 Asian householders$65,631 Some other race householders$107,568 Two or more races householders$89,768 Hispanic or Latino race householders
Median age by race in Seabrook
61.1 Median age for White residents57.0 65.3 38.5 Median age for Black or African American residents38.3 39.9 58.1 Median age for American Indian / Alaska Native residents-888,297,871.5 -689,905,591.2 38.7 Median age for Asian residents36.2 39.7 -571,600,480.8 Median age for Native Hawaiian / Pacific Islander residents-720,061,021.4 -760,942,760.2 25.6 Median age for Other race residents25.8 24.0 27.9 Median age for Two or more races residents36.7 28.0 63.6 Median age for White alone residents59.5 65.9 29.2 Median age for Hispanic or Latino residents31.3 27.8
Owner/renter occupied households by race in Seabrook
House owners and renters - White residents 571 88.0% Owner occupied78 12.0% Renter occupiedHouse owners and renters - Black or African American residents 2,079 52.8% Owner occupied1,856 47.2% Renter occupiedHouse owners and renters - American Indian / Alaska Native residents 89 100.0% Owner occupiedHouse owners and renters - Asian residents 317 75.7% Owner occupied102 24.3% Renter occupiedHouse owners and renters - Other race residents 301 53.1% Owner occupied266 46.9% Renter occupiedHouse owners and renters - Two or more races residents 270 71.5% Owner occupied108 28.5% Renter occupiedHouse owners and renters - White alone residents 549 89.7% Owner occupied63 10.3% Renter occupiedHouse owners and renters - Hispanic or Latino residents 540 57.6% Owner occupied397 42.4% Renter occupied
Language usage in Seabrook
English speakers - Total 53.8% of residents of Seabrook speak English at home.
23.5% of residents speak Spanish at home 1,733 42.2% Speak English very well2,371 57.8% Speak English less than very well24.7% of residents speak other language at home 2,953 68.4% Speak English very well1,363 31.6% Speak English less than very well
English speakers - Born in the United States 82.8% of residents of Seabrook speak English at home.
13.4% of residents speak Spanish at home 723 94.0% Speak English very well46 6.0% Speak English less than very well4.5% of residents speak other language at home 190 74.5% Speak English very well65 25.5% Speak English less than very well
English speakers - Native, born elsewhere 65.7% of residents of Seabrook speak English at home.
3.5% of residents speak Spanish at home 9 100.0% Speak English very well14.6% of residents speak other language at home 30 81.1% Speak English very well7 18.9% Speak English less than very well
English speakers - Foreign-born 24.5% of residents of Seabrook speak English at home.
30.6% of residents speak Spanish at home 384 15.2% Speak English very well2,150 84.8% Speak English less than very well45.2% of residents speak other language at home 2,490 66.6% Speak English very well1,251 33.4% Speak English less than very well
White (Caucasian) - Speak only English Native:
96.9% (1,115)Foreign-born:
25.9% (41)
White (Caucasian) - Speak another language Native:
3.7% (43)Foreign-born:
74.6% (118)
Black or African American - Speak only English Native:
91.9% (5,577)Foreign-born:
37.0% (1,745)
Black or African American - Speak another language Native:
8.7% (528)Foreign-born:
63.1% (2,980)
Asian - Speak only English Native:
40.9% (143)Foreign-born:
13.0% (119)
Asian - Speak another language Native:
58.5% (204)Foreign-born:
86.8% (795)
Other race - Speak only English Native:
15.4% (162)Foreign-born:
3.0% (47)
Other race - Speak another language Native:
84.5% (891)Foreign-born:
97.0% (1,539)
Two or more races - Speak only English Native:
47.2% (525)Foreign-born:
6.0% (68)
Two or more races - Speak another language Native:
55.7% (620)Foreign-born:
97.7% (1,109)
White alone - Speak only English Native:
96.5% (1,083)Foreign-born:
33.2% (46)
White alone - Speak another language Native:
3.1% (34)Foreign-born:
66.9% (92)
Hispanic or Latino - Speak only English Native:
20.1% (362)Foreign-born:
6.8% (187)
Hispanic or Latino - Speak another language Native:
79.7% (1,436)Foreign-born:
92.6% (2,560)
Foreign-born residents in Seabrook
Marital status for residents in Seabrook Marital status - White (Caucasian) population 15 years and over
Males 32.0% Never married40.8% Now married0.0% Separated3.3% Widowed23.9% DivorcedFemales 33.4% Never married35.0% Now married0.0% Separated23.6% Widowed8.1% DivorcedWomen who gave birth in the past 12 months Now married:
100.0% (4)Unmarried:
0.0% (0)
Women who did not give birth in the past 12 months Now married:
37.2% (77)Unmarried:
62.8% (129)
Marital status - Black or African American population 15 years and over
Males 43.9% Never married44.2% Now married2.5% Separated1.7% Widowed7.8% DivorcedFemales 44.0% Never married33.0% Now married1.2% Separated7.9% Widowed14.0% DivorcedWomen who gave birth in the past 12 months Now married:
57.5% (188)Unmarried:
42.5% (139)
Women who did not give birth in the past 12 months Now married:
25.2% (632)Unmarried:
74.8% (1,878)
Marital status - American Indian / Alaska Native population 15 years and over
Males 0.0% Never married100.0% Now married0.0% Separated0.0% Widowed0.0% DivorcedFemales 0.0% Never married44.8% Now married0.0% Separated55.2% Widowed0.0% DivorcedWomen who did not give birth in the past 12 months Now married:
100.0% (39)Unmarried:
0.0% (0)
Marital status - Asian population 15 years and over
Males 21.1% Never married67.8% Now married0.0% Separated0.2% Widowed10.9% DivorcedFemales 15.3% Never married61.7% Now married6.1% Separated16.8% Widowed0.0% DivorcedWomen who gave birth in the past 12 months Now married:
100.0% (3)Unmarried:
0.0% (0)
Women who did not give birth in the past 12 months Now married:
65.5% (171)Unmarried:
34.5% (90)
Marital status - Other race population 15 years and over
Males 47.9% Never married48.9% Now married0.0% Separated3.2% Widowed0.0% DivorcedFemales 43.3% Never married50.7% Now married4.7% Separated0.0% Widowed1.3% DivorcedWomen who gave birth in the past 12 months Now married:
0.0% (0)Unmarried:
100.0% (37)
Women who did not give birth in the past 12 months Now married:
43.8% (320)Unmarried:
56.2% (410)
Marital status - Two or more races population 15 years and over
Males 25.7% Never married62.1% Now married6.2% Separated0.0% Widowed6.0% DivorcedFemales 65.6% Never married29.6% Now married0.0% Separated1.3% Widowed3.5% DivorcedWomen who gave birth in the past 12 months Now married:
0.0% (0)Unmarried:
100.0% (67)
Women who did not give birth in the past 12 months Now married:
27.6% (122)Unmarried:
72.4% (319)
Marital status - White alone, not Hispanic / Latino population 15 years and over
Males 32.6% Never married42.5% Now married0.0% Separated2.6% Widowed22.3% DivorcedFemales 31.4% Never married33.4% Now married0.0% Separated26.2% Widowed9.0% DivorcedWomen who did not give birth in the past 12 months Now married:
35.1% (56)Unmarried:
64.9% (104)
Marital status - Hispanic or Latino population 15 years and over
Males 36.1% Never married52.2% Now married2.5% Separated2.1% Widowed7.1% DivorcedFemales 42.7% Never married51.1% Now married2.7% Separated0.0% Widowed3.4% DivorcedWomen who gave birth in the past 12 months Now married:
4.1% (5)Unmarried:
95.9% (120)
Women who did not give birth in the past 12 months Now married:
47.0% (457)Unmarried:
53.0% (516)
Ancestries in Seabrook
722 5.7% African690 5.4% Jamaican676 5.3% Nigerian412 3.2% Ethiopian375 3.0% Sierra Leonean274 2.2% American183 1.4% German90 0.7% Haitian76 0.6% British West Indian59 0.5% Trinidadian and Tobagonian42 0.3% Ghanaian41 0.3% Afghan40 0.3% Sudanese38 0.3% Turkish35 0.3% West Indian31 0.2% Russian29 0.2% Irish28 0.2% Arab27 0.2% English25 0.2% Italian15 0.1% Scotch-Irish14 0.1% Lebanese13 0.1% Guyanese12 0.09% Liberian12 0.09% Carpatho Rusyn11 0.09% French10 0.08% Canadian9 0.07% European8 0.06% Kenyan8 0.06% Norwegian7 0.06% Scottish6 0.05% Polish3 0.02% British2 0.02% Slovak
Geographical mobility in Seabrook Same house 1 year ago 1,238 91.5% White (Caucasian)9,646 88.5% Black or African American123 98.9% American Indian / Alaska Native1,155 81.5% Asian2,557 90.9% Other race2,246 88.7% Two or more races1,156 92.3% White alone, not Hispanic / Latino4,768 93.7% Hispanic or LatinoMoved within same county 31 2.3% White / Caucasian810 7.4% Black or African American197 13.9% Asian26 0.9% Other race107 4.2% Two or more races35 2.8% White alone, not Hispanic / Latino38 0.7% Hispanic or LatinoMoved within same state 20 1.4% White / Caucasian155 1.4% Black or African American252 9.0% Other race83 3.3% Two or more races9 0.7% White alone, not Hispanic / Latino327 6.4% Hispanic or LatinoMoved from different state 44 3.2% White / Caucasian132 1.2% Black or African American23 1.6% Asian7 0.2% Other race44 3.5% White alone, not Hispanic / Latino10 0.2% Hispanic or LatinoMoved from abroad 36 2.7% White126 1.2% Black or African American65 4.6% Asian107 3.8% Other race19 0.7% Two or more races19 1.5% White alone, not Hispanic / Latino149 2.9% Hispanic or Latino
Children Nativity (place of birth) in Seabrook
Children under 6 years - Living with two parents Both parents native 69 100.0% NativeBoth parents foreign-born 518 95.5% Native25 4.5% Foreign-bornOne native, one foreign-born parent 157 100.0% NativeChildren under 6 years - Living with one parent Native parent 567 97.7% Native13 2.3% Foreign-bornForeign-born parent 416 100.0% NativeChildren 6 to 17 years - Living with two parents Both parents native 6 87.3% Native1 12.7% Foreign-bornBoth parents foreign-born 1,074 81.4% Native245 18.6% Foreign-bornOne native, one foreign-born parent 324 100.0% NativeChildren 6 to 17 years - Living with one parent Native parent 303 100.0% NativeForeign-born parent 471 60.1% Native313 39.9% Foreign-born
Grandparents responsible for own grandchildren in Seabrook
Grandparents (30 to 59 years) White / Caucasian 6 100.0% Responsible for grandchildrenBlack or African American 82 68.4% Responsible for grandchildren38 31.6% Not responsible for grandchildrenAmerican Indian / Alaska Native 58 100.0% Not responsible for grandchildrenOther race 55 100.0% Not responsible for grandchildrenTwo or more races 156 88.0% Responsible for grandchildren21 12.0% Not responsible for grandchildrenHispanic or Latino 82 44.1% Responsible for grandchildren104 55.9% Not responsible for grandchildrenGrandparents (60 years and over) Black or African American 83 57.0% Responsible for grandchildren63 43.0% Not responsible for grandchildrenOther race 114 100.0% Not responsible for grandchildrenTwo or more races 22 66.9% Responsible for grandchildren11 33.1% Not responsible for grandchildrenHispanic or Latino 14 9.4% Responsible for grandchildren132 90.6% Not responsible for grandchildren