Races in Scottsbluff, Nebraska (NE) Detailed Stats
Data:
Races - White alone (%)
Races - White alone (% change since 2000)
Races - Black alone (%)
Races - Black alone (% change since 2000)
Races - American Indian alone (%)
Races - American Indian alone (% change since 2000)
Races - Asian alone (%)
Races - Asian alone (% change since 2000)
Races - Hispanic (%)
Races - Hispanic (% change since 2000)
Races - Native Hawaiian and Other Pacific Islander alone (%)
Races - Native Hawaiian and Other Pacific Islander alone (% change since 2000)
Races - Two or more races(%)
Races - Two or more races(% change since 2000)
Races - Other race alone (%)
Races - Other race alone (% change since 2000)
Racial diversity
Place of birth - Born in state of residence (%)
Place of birth - Born in state of residence (%) - White
Place of birth - Born in state of residence (%) - Black or African American
Place of birth - Born in state of residence (%) - Asian
Place of birth - Born in state of residence (%) - Hispanic or Latino
Place of birth - Born in state of residence (%) - American Indian and Alaska Native
Place of birth - Born in state of residence (%) - Multirace
Place of birth - Born in state of residence (%) - Other Race
Place of birth - Born in other state (%)
Place of birth - Born in other state (%) - White
Place of birth - Born in other state (%) - Black or African American
Place of birth - Born in other state (%) - Asian
Place of birth - Born in other state (%) - Hispanic or Latino
Place of birth - Born in other state (%) - American Indian and Alaska Native
Place of birth - Born in other state (%) - Multirace
Place of birth - Born in other state (%) - Other Race
Place of birth - Native, outside of US (%)
Place of birth - Native, outside of US (%) - White
Place of birth - Native, outside of US (%) - Black or African American
Place of birth - Native, outside of US (%) - Asian
Place of birth - Native, outside of US (%) - Hispanic or Latino
Place of birth - Native, outside of US (%) - American Indian and Alaska Native
Place of birth - Native, outside of US (%) - Multirace
Place of birth - Native, outside of US (%) - Other Race
Place of birth - Foreign born (%)
Place of birth - Foreign born (%) - White
Place of birth - Foreign born (%) - Black or African American
Place of birth - Foreign born (%) - Asian
Place of birth - Foreign born (%) - Hispanic or Latino
Place of birth - Foreign born (%) - American Indian and Alaska Native
Place of birth - Foreign born (%) - Multirace
Place of birth - Foreign born (%) - Other Race
Residents speaking English at home (%)
Residents speaking English at home - Born in the United States (%)
Residents speaking English at home - Native, born elsewhere (%)
Residents speaking English at home - Foreign born (%)
Residents speaking Spanish at home (%)
Residents speaking Spanish at home - Born in the United States (%)
Residents speaking Spanish at home - Native, born elsewhere (%)
Residents speaking Spanish at home - Foreign born (%)
Residents speaking other language at home (%)
Residents speaking other language at home - Born in the United States (%)
Residents speaking other language at home - Native, born elsewhere (%)
Residents speaking other language at home - Foreign born (%)
Marital status - Never married (%)
Marital status - Now married (%)
Marital status - Separated (%)
Marital status - Widowed (%)
Marital status - Divorced (%)
Ancestries Reported - Arab (%)
Ancestries Reported - Czech (%)
Ancestries Reported - Danish (%)
Ancestries Reported - Dutch (%)
Ancestries Reported - English (%)
Ancestries Reported - French (%)
Ancestries Reported - French Canadian (%)
Ancestries Reported - German (%)
Ancestries Reported - Greek (%)
Ancestries Reported - Hungarian (%)
Ancestries Reported - Irish (%)
Ancestries Reported - Italian (%)
Ancestries Reported - Lithuanian (%)
Ancestries Reported - Norwegian (%)
Ancestries Reported - Polish (%)
Ancestries Reported - Portuguese (%)
Ancestries Reported - Russian (%)
Ancestries Reported - Scotch-Irish (%)
Ancestries Reported - Scottish (%)
Ancestries Reported - Slovak (%)
Ancestries Reported - Subsaharan African (%)
Ancestries Reported - Swedish (%)
Ancestries Reported - Swiss (%)
Ancestries Reported - Ukrainian (%)
Ancestries Reported - United States (%)
Ancestries Reported - Welsh (%)
Ancestries Reported - West Indian (%)
Ancestries Reported - Other (%)
Geographical mobility - Same house 1 year ago (%)
Geographical mobility - Same house 1 year ago (%) - White
Geographical mobility - Same house 1 year ago (%) - Black or African American
Geographical mobility - Same house 1 year ago (%) - Asian
Geographical mobility - Same house 1 year ago (%) - Hispanic or Latino
Geographical mobility - Same house 1 year ago (%) - American Indian and Alaska Native
Geographical mobility - Same house 1 year ago (%) - Multirace
Geographical mobility - Same house 1 year ago (%) - Other Race
Geographical mobility - Moved within same county (%)
Geographical mobility - Moved within same county (%) - White
Geographical mobility - Moved within same county (%) - Black or African American
Geographical mobility - Moved within same county (%) - Asian
Geographical mobility - Moved within same county (%) - Hispanic or Latino
Geographical mobility - Moved within same county (%) - American Indian and Alaska Native
Geographical mobility - Moved within same county (%) - Multirace
Geographical mobility - Moved within same county (%) - Other Race
Geographical mobility - Moved from different county within same state (%)
Geographical mobility - Moved from different county within same state (%) - White
Geographical mobility - Moved from different county within same state (%) - Black or African American
Geographical mobility - Moved from different county within same state (%) - Asian
Geographical mobility - Moved from different county within same state (%) - Hispanic or Latino
Geographical mobility - Moved from different county within same state (%) - American Indian and Alaska Native
Geographical mobility - Moved from different county within same state (%) - Multirace
Geographical mobility - Moved from different county within same state (%) - Other Race
Geographical mobility - Moved from different state (%)
Geographical mobility - Moved from different state (%) - White
Geographical mobility - Moved from different state (%) - Black or African American
Geographical mobility - Moved from different state (%) - Asian
Geographical mobility - Moved from different state (%) - Hispanic or Latino
Geographical mobility - Moved from different state (%) - American Indian and Alaska Native
Geographical mobility - Moved from different state (%) - Multirace
Geographical mobility - Moved from different state (%) - Other Race
Geographical mobility - Moved from abroad (%)
Geographical mobility - Moved from abroad (%) - White
Geographical mobility - Moved from abroad (%) - Black or African American
Geographical mobility - Moved from abroad (%) - Asian
Geographical mobility - Moved from abroad (%) - Hispanic or Latino
Geographical mobility - Moved from abroad (%) - American Indian and Alaska Native
Geographical mobility - Moved from abroad (%) - Multirace
Geographical mobility - Moved from abroad (%) - Other Race
Place of birth for the foreign-born population - Ireland (%)
Place of birth for the foreign-born population - Denmark (%)
Place of birth for the foreign-born population - Norway (%)
Place of birth for the foreign-born population - Sweden (%)
Place of birth for the foreign-born population - United Kingdom (%)
Place of birth for the foreign-born population - England (%)
Place of birth for the foreign-born population - Scotland (%)
Place of birth for the foreign-born population - Other Northern Europe (%)
Place of birth for the foreign-born population - Austria (%)
Place of birth for the foreign-born population - Belgium (%)
Place of birth for the foreign-born population - France (%)
Place of birth for the foreign-born population - Germany (%)
Place of birth for the foreign-born population - Netherlands (%)
Place of birth for the foreign-born population - Switzerland (%)
Place of birth for the foreign-born population - Other Western Europe (%)
Place of birth for the foreign-born population - Greece (%)
Place of birth for the foreign-born population - Italy (%)
Place of birth for the foreign-born population - Portugal (%)
Place of birth for the foreign-born population - Spain (%)
Place of birth for the foreign-born population - Other Southern Europe (%)
Place of birth for the foreign-born population - Albania (%)
Place of birth for the foreign-born population - Belarus (%)
Place of birth for the foreign-born population - Bosnia and Herzegovina (%)
Place of birth for the foreign-born population - Bulgaria (%)
Place of birth for the foreign-born population - Croatia (%)
Place of birth for the foreign-born population - Czechoslovakia (%)
Place of birth for the foreign-born population - Hungary (%)
Place of birth for the foreign-born population - Latvia (%)
Place of birth for the foreign-born population - Lithuania (%)
Place of birth for the foreign-born population - North Macedonia (Macedonia) (%)
Place of birth for the foreign-born population - Moldova (%)
Place of birth for the foreign-born population - Poland (%)
Place of birth for the foreign-born population - Romania (%)
Place of birth for the foreign-born population - Russia (%)
Place of birth for the foreign-born population - Serbia (%)
Place of birth for the foreign-born population - Ukraine (%)
Place of birth for the foreign-born population - Other Eastern Europe (%)
Place of birth for the foreign-born population - China (%)
Place of birth for the foreign-born population - Hong Kong (%)
Place of birth for the foreign-born population - Taiwan (%)
Place of birth for the foreign-born population - Japan (%)
Place of birth for the foreign-born population - Korea (%)
Place of birth for the foreign-born population - Other Eastern Asia (%)
Place of birth for the foreign-born population - Afghanistan (%)
Place of birth for the foreign-born population - Bangladesh (%)
Place of birth for the foreign-born population - India (%)
Place of birth for the foreign-born population - Iran (%)
Place of birth for the foreign-born population - Kazakhstan (%)
Place of birth for the foreign-born population - Nepal (%)
Place of birth for the foreign-born population - Pakistan (%)
Place of birth for the foreign-born population - Sri Lanka (%)
Place of birth for the foreign-born population - Uzbekistan (%)
Place of birth for the foreign-born population - Other South Central Asia (%)
Place of birth for the foreign-born population - Burma (%)
Place of birth for the foreign-born population - Cambodia (%)
Place of birth for the foreign-born population - Indonesia (%)
Place of birth for the foreign-born population - Laos (%)
Place of birth for the foreign-born population - Malaysia (%)
Place of birth for the foreign-born population - Philippines (%)
Place of birth for the foreign-born population - Singapore (%)
Place of birth for the foreign-born population - Thailand (%)
Place of birth for the foreign-born population - Vietnam (%)
Place of birth for the foreign-born population - Other South Eastern Asia (%)
Place of birth for the foreign-born population - Armenia (%)
Place of birth for the foreign-born population - Iraq (%)
Place of birth for the foreign-born population - Israel (%)
Place of birth for the foreign-born population - Jordan (%)
Place of birth for the foreign-born population - Kuwait (%)
Place of birth for the foreign-born population - Lebanon (%)
Place of birth for the foreign-born population - Saudi Arabia (%)
Place of birth for the foreign-born population - Syria (%)
Place of birth for the foreign-born population - Turkey (%)
Place of birth for the foreign-born population - Yemen (%)
Place of birth for the foreign-born population - Other Western Asia (%)
Place of birth for the foreign-born population - Eritrea (%)
Place of birth for the foreign-born population - Ethiopia (%)
Place of birth for the foreign-born population - Kenya (%)
Place of birth for the foreign-born population - Somalia (%)
Place of birth for the foreign-born population - Uganda (%)
Place of birth for the foreign-born population - Zimbabwe (%)
Place of birth for the foreign-born population - Other Eastern Africa (%)
Place of birth for the foreign-born population - Cameroon (%)
Place of birth for the foreign-born population - Congo (%)
Place of birth for the foreign-born population - Democratic Republic of Congo (Zaire) (%)
Place of birth for the foreign-born population - Other Middle Africa (%)
Place of birth for the foreign-born population - Egypt (%)
Place of birth for the foreign-born population - Morocco (%)
Place of birth for the foreign-born population - Sudan (%)
Place of birth for the foreign-born population - Other Northern Africa (%)
Place of birth for the foreign-born population - South Africa (%)
Place of birth for the foreign-born population - Other Southern Africa (%)
Place of birth for the foreign-born population - Cabo Verde (%)
Place of birth for the foreign-born population - Ghana (%)
Place of birth for the foreign-born population - Liberia (%)
Place of birth for the foreign-born population - Nigeria (%)
Place of birth for the foreign-born population - Senegal (%)
Place of birth for the foreign-born population - Sierra Leone (%)
Place of birth for the foreign-born population - Other Western Africa (%)
Place of birth for the foreign-born population - Australia (%)
Place of birth for the foreign-born population - New Zealand (%)
Place of birth for the foreign-born population - Fiji (%)
Place of birth for the foreign-born population - Micronesia (%)
Place of birth for the foreign-born population - Bahamas (%)
Place of birth for the foreign-born population - Barbados (%)
Place of birth for the foreign-born population - Cuba (%)
Place of birth for the foreign-born population - Dominica (%)
Place of birth for the foreign-born population - Dominican Republic (%)
Place of birth for the foreign-born population - Grenada (%)
Place of birth for the foreign-born population - Haiti (%)
Place of birth for the foreign-born population - Jamaica (%)
Place of birth for the foreign-born population - St. Vincent and the Grenadines (%)
Place of birth for the foreign-born population - Trinidad and Tobago (%)
Place of birth for the foreign-born population - West Indies (%)
Place of birth for the foreign-born population - Other Caribbean (%)
Place of birth for the foreign-born population - Belize (%)
Place of birth for the foreign-born population - Costa Rica (%)
Place of birth for the foreign-born population - El Salvador (%)
Place of birth for the foreign-born population - Guatemala (%)
Place of birth for the foreign-born population - Honduras (%)
Place of birth for the foreign-born population - Mexico (%)
Place of birth for the foreign-born population - Nicaragua (%)
Place of birth for the foreign-born population - Panama (%)
Place of birth for the foreign-born population - Other Central America (%)
Place of birth for the foreign-born population - Argentina (%)
Place of birth for the foreign-born population - Bolivia (%)
Place of birth for the foreign-born population - Brazil (%)
Place of birth for the foreign-born population - Chile (%)
Place of birth for the foreign-born population - Colombia (%)
Place of birth for the foreign-born population - Ecuador (%)
Place of birth for the foreign-born population - Guyana (%)
Place of birth for the foreign-born population - Peru (%)
Place of birth for the foreign-born population - Uruguay (%)
Place of birth for the foreign-born population - Venezuela (%)
Place of birth for the foreign-born population - Other South America (%)
Place of birth for the foreign-born population - Canada (%)
Place of birth for the foreign-born population - Other Northern America (%)
Place of birth for the foreign-born population - Other (%)
Latest news about races in Scottsbluff, NE collected exclusively by city-data.com from local newspapers, TV, and radio stations
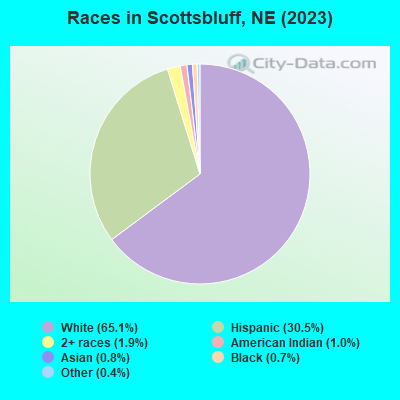
According to 2022 data, the most numerous races in Scottsbluff, NE are White alone (9,137 residents), Hispanic (4,524 residents), and Black alone (72 residents). 84.4% of Scottsbluff residents speak English at home. 4.8% of Scottsbluff, NE residents are foreign-born (3.8% born in Latin America), which is 46.5% less than the foreign-born rate of 7.0% across the entire state of Nebraska.
Race distribution in Scottsbluff
2000 2022
1,494,494 87.3% White alone 94,425 5.5% Hispanic 67,537 3.9% Black alone 21,677 1.3% Asian alone 17,696 1.0% Two or more races 13,460 0.8% American Indian alone 1,327 0.08% Other race alone 647 0.04% Native Hawaiian and Other
1,492,005 75.8% White alone 241,898 12.3% Hispanic 89,520 4.5% Black alone 76,499 3.9% Two or more races 49,261 2.5% Asian alone 10,249 0.5% American Indian alone 7,425 0.4% Other race alone 1,066 0.05% Native Hawaiian and Other
Income and house value in Scottsbluff Median household income in 2022 $52,651 White non-Hispanic householders$52,000 Some other race householders$64,097 Two or more races householders$60,916 Hispanic or Latino race householdersMedian 2022 house value $163,892 White Non-Hispanic householders$202,732 Black or African American householders$96,031 American Indian or Alaska Native householders $222,365 Asian householders$98,165 Some other race householders$79,599 Two or more races householders$96,031 Hispanic or Latino householders
Median age by race in Scottsbluff
40.7 Median age for White residents36.3 45.2 26.3 Median age for Black or African American residents21.8 27.5 26.8 Median age for American Indian / Alaska Native residents19.5 35.7 37.5 Median age for Asian residents25.0 42.8 -699,999,999.3 Median age for Native Hawaiian / Pacific Islander residents-672,108,842.9 -689,223,057.0 38.6 Median age for Other race residents20.5 41.6 22.9 Median age for Two or more races residents24.8 14.6 46.1 Median age for White alone residents39.9 51.8 23.8 Median age for Hispanic or Latino residents22.8 24.5
Owner/renter occupied households by race in Scottsbluff
House owners and renters - White residents 2,892 57.6% Owner occupied2,126 42.4% Renter occupiedHouse owners and renters - Black or African American residents 12 100.0% Renter occupiedHouse owners and renters - American Indian / Alaska Native residents 87 26.2% Owner occupied246 73.8% Renter occupiedHouse owners and renters - Asian residents 25 58.5% Owner occupied18 41.5% Renter occupiedHouse owners and renters - Other race residents 217 54.4% Owner occupied182 45.6% Renter occupiedHouse owners and renters - Two or more races residents 276 32.7% Owner occupied569 67.3% Renter occupiedHouse owners and renters - White alone residents 2,703 60.0% Owner occupied1,805 40.0% Renter occupiedHouse owners and renters - Hispanic or Latino residents 588 38.0% Owner occupied960 62.0% Renter occupied
Language usage in Scottsbluff
English speakers - Total 84.4% of residents of Scottsbluff speak English at home.
13.0% of residents speak Spanish at home 1,212 67.7% Speak English very well579 32.3% Speak English less than very well2.3% of residents speak other language at home 278 87.4% Speak English very well40 12.6% Speak English less than very well
English speakers - Born in the United States 92.6% of residents of Scottsbluff speak English at home.
5.2% of residents speak Spanish at home 151 67.4% Speak English very well73 32.6% Speak English less than very well1.9% of residents speak other language at home 83 100.0% Speak English very well
English speakers - Native, born elsewhere 0.0% of residents of Scottsbluff speak English at home.
54.4% of residents speak Spanish at home 10 23.3% Speak English very well33 76.7% Speak English less than very well59.5% of residents speak other language at home 40 85.1% Speak English very well7 14.9% Speak English less than very well
English speakers - Foreign-born 4.1% of residents of Scottsbluff speak English at home.
81.7% of residents speak Spanish at home 147 27.2% Speak English very well394 72.8% Speak English less than very well15.4% of residents speak other language at home 70 68.6% Speak English very well32 31.4% Speak English less than very well
White (Caucasian) - Speak only English Native:
95.1% (9,561)Foreign-born:
20.0% (26)
White (Caucasian) - Speak another language Native:
4.2% (418)Foreign-born:
78.2% (101)
Black or African American - Speak another language Native:
14.3% (10)Foreign-born:
94.2% (4)
American Indian / Alaska Native - Speak another language Native:
12.0% (59)Foreign-born:
100.0% (37)
Asian - Speak another language Native:
56.0% (23)Foreign-born:
100.0% (62)
Other race - Speak another language Native:
59.6% (531)Foreign-born:
100.0% (327)
Two or more races - Speak another language Native:
25.8% (506)Foreign-born:
100.0% (153)
White alone - Speak only English Native:
98.0% (8,557)Foreign-born:
42.0% (28)
White alone - Speak another language Native:
2.0% (174)Foreign-born:
56.0% (38)
Hispanic or Latino - Speak another language Native:
31.3% (1,160)Foreign-born:
100.0% (541)
Foreign-born residents in Scottsbluff 694 residents are foreign born (3.8% Latin America ).
This city:
4.8%Nebraska:
7.5%
Marital status for residents in Scottsbluff Marital status - White (Caucasian) population 15 years and over
Males 34.0% Never married52.2% Now married1.5% Separated2.8% Widowed9.6% DivorcedFemales 23.7% Never married43.5% Now married2.5% Separated15.0% Widowed15.4% DivorcedWomen who gave birth in the past 12 months Now married:
100.0% (85)Unmarried:
0.0% (0)
Women who did not give birth in the past 12 months Now married:
47.6% (1,054)Unmarried:
52.4% (1,162)
Marital status - Black or African American population 15 years and over
Males 84.2% Never married0.0% Now married0.0% Separated0.0% Widowed15.8% DivorcedFemales 31.0% Never married61.9% Now married0.0% Separated0.0% Widowed7.1% DivorcedWomen who did not give birth in the past 12 months Now married:
89.7% (25)Unmarried:
10.3% (3)
Marital status - American Indian / Alaska Native population 15 years and over
Males 48.2% Never married19.5% Now married0.0% Separated0.0% Widowed32.3% DivorcedFemales 34.6% Never married9.7% Now married0.0% Separated16.6% Widowed39.2% DivorcedWomen who did not give birth in the past 12 months Now married:
15.1% (23)Unmarried:
84.9% (131)
Marital status - Asian population 15 years and over
Males 62.8% Never married37.2% Now married0.0% Separated0.0% Widowed0.0% DivorcedFemales 11.8% Never married88.2% Now married0.0% Separated0.0% Widowed0.0% DivorcedWomen who did not give birth in the past 12 months Now married:
86.0% (38)Unmarried:
14.0% (6)
Marital status - Other race population 15 years and over
Males 56.4% Never married35.3% Now married0.0% Separated0.0% Widowed8.3% DivorcedFemales 25.5% Never married48.7% Now married0.0% Separated17.2% Widowed8.6% DivorcedWomen who gave birth in the past 12 months Now married:
100.0% (40)Unmarried:
0.0% (0)
Women who did not give birth in the past 12 months Now married:
48.6% (122)Unmarried:
51.4% (129)
Marital status - Two or more races population 15 years and over
Males 43.8% Never married41.9% Now married0.0% Separated8.7% Widowed5.6% DivorcedFemales 32.5% Never married38.4% Now married0.0% Separated10.2% Widowed19.0% DivorcedWomen who gave birth in the past 12 months Now married:
53.8% (10)Unmarried:
46.2% (9)
Women who did not give birth in the past 12 months Now married:
37.4% (149)Unmarried:
62.6% (250)
Marital status - White alone, not Hispanic / Latino population 15 years and over
Males 31.9% Never married52.5% Now married1.7% Separated3.2% Widowed10.7% DivorcedFemales 20.2% Never married44.5% Now married1.6% Separated16.7% Widowed17.1% DivorcedWomen who gave birth in the past 12 months Now married:
100.0% (87)Unmarried:
0.0% (0)
Women who did not give birth in the past 12 months Now married:
49.5% (895)Unmarried:
50.5% (912)
Marital status - Hispanic or Latino population 15 years and over
Males 51.8% Never married39.9% Now married0.0% Separated3.0% Widowed5.2% DivorcedFemales 40.5% Never married39.4% Now married4.0% Separated8.1% Widowed8.0% DivorcedWomen who gave birth in the past 12 months Now married:
100.0% (35)Unmarried:
0.0% (0)
Women who did not give birth in the past 12 months Now married:
39.1% (383)Unmarried:
60.9% (597)
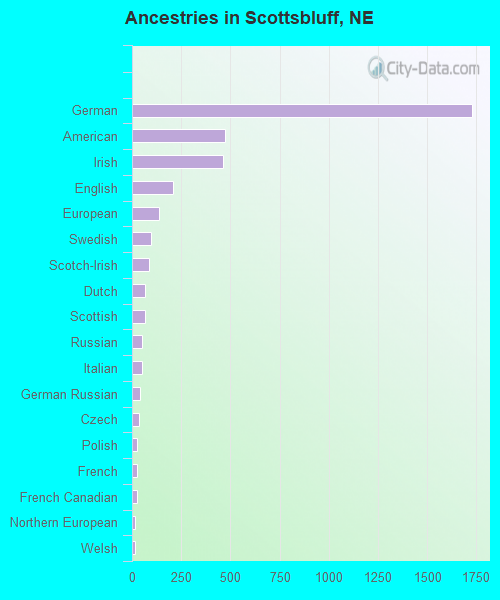
Ancestries in Scottsbluff
1,728 24.6% German472 6.7% American462 6.6% Irish207 3.0% English135 1.9% European95 1.4% Swedish86 1.2% Scotch-Irish68 1.0% Dutch66 0.9% Scottish52 0.7% Russian49 0.7% Italian43 0.6% German Russian34 0.5% Czech26 0.4% Polish23 0.3% French23 0.3% French Canadian17 0.2% Northern European16 0.2% Welsh9 0.1% Austrian9 0.1% Swiss8 0.1% Norwegian7 0.10% Belgian6 0.09% Scandinavian4 0.06% Czechoslovakian2 0.03% Sudanese
Geographical mobility in Scottsbluff Same house 1 year ago 8,853 83.6% White (Caucasian)69 93.9% Black or African American563 95.0% American Indian / Alaska Native77 76.2% Asian1,082 85.6% Other race2,146 94.1% Two or more races7,545 83.2% White alone, not Hispanic / Latino4,110 91.1% Hispanic or LatinoMoved within same county 936 8.8% White / Caucasian2 2.6% Black or African American37 6.3% American Indian / Alaska Native37 3.0% Other race113 5.0% Two or more races794 8.8% White alone, not Hispanic / Latino221 4.9% Hispanic or LatinoMoved within same state 367 3.5% White / Caucasian14 13.5% Asian21 1.7% Other race8 0.3% Two or more races363 4.0% White alone, not Hispanic / Latino40 0.9% Hispanic or LatinoMoved from different state 364 3.4% White / Caucasian37 1.6% Two or more races308 3.4% White alone, not Hispanic / Latino75 1.7% Hispanic or LatinoMoved from abroad 14 0.1% White7 9.6% Black or African American8 7.4% Asian130 10.3% Other race17 0.2% White alone, not Hispanic / Latino134 3.0% Hispanic or Latino
Children Nativity (place of birth) in Scottsbluff
Children under 6 years - Living with two parents Both parents native 667 100.0% NativeOne native, one foreign-born parent 25 100.0% NativeChildren under 6 years - Living with one parent Native parent 255 100.0% NativeForeign-born parent 54 100.0% NativeChildren 6 to 17 years - Living with two parents Both parents native 1,258 100.0% Native0 0.0% Foreign-bornBoth parents foreign-born 79 66.5% Native40 33.5% Foreign-bornOne native, one foreign-born parent 207 100.0% NativeChildren 6 to 17 years - Living with one parent Native parent 680 100.0% NativeForeign-born parent 155 49.4% Native159 50.6% Foreign-born
Grandparents responsible for own grandchildren in Scottsbluff
Grandparents (30 to 59 years) White / Caucasian 24 100.0% Responsible for grandchildrenBlack or African American 19 100.0% Not responsible for grandchildrenWhite alone, not Hispanic / Latino 24 100.0% Responsible for grandchildren
Grandparents (60 years and over) White / Caucasian 37 100.0% Not responsible for grandchildrenWhite alone, not Hispanic / Latino 38 100.0% Not responsible for grandchildren