Races in Scott Township, Pennsylvania (PA) Detailed Stats
Ancestries, Foreign-born residents, place of birth

Recent posts about races in Scott Township, Pennsylvania on our local forum with over 2,400,000 registered users:
 | Census 2020 results available by ethnicity for census tract. Interesting results for the Pittsburgh area. (4 replies) |
| Ethnic neighborhoods in Pittsbugh (35 replies) |
| Pittsburgh needs a new immigrant group. (78 replies) |
| Pittsburgh MSA municipal population data (2020) (125 replies) |
| Asian family looking for your advice to find a house (53 replies) |
| Mad Mex Atwood is closed! (31 replies) |
8.9% of Scott Township, PA residents are foreign-born (6.7% born in Asia, 2.0% born in Europe), which is 21.6% greater than the foreign-born rate of 7.0% across the entire state of Pennsylvania.
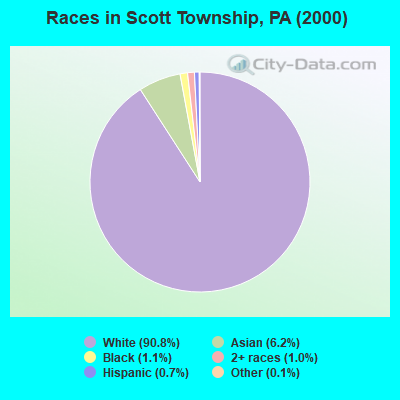
Race distribution in Scott Township

- 15,70690.8%White alone
- 1,0676.2%Asian alone
- 1981.1%Black alone
- 1671.0%Two or more races
- 1170.7%Hispanic
- 200.1%Other race alone
- 110.06%American Indian alone
- 20.01%Native Hawaiian and Other
Pacific Islander alone
2000
2022
-
- 10,322,45584.1%White alone
- 1,202,4379.8%Black alone
- 394,0883.2%Hispanic
- 218,2961.8%Asian alone
- 113,0970.9%Two or more races
- 13,0860.1%Other race alone
- 14,9040.1%American Indian alone
- 2,6910.02%Native Hawaiian and Other
Pacific Islander alone

-
- 9,487,22873.1%White alone
- 1,311,58110.1%Black alone
- 1,115,9978.6%Hispanic
- 493,9423.8%Two or more races
- 487,1243.8%Asian alone
- 63,5820.5%Other race alone
- 10,1300.08%American Indian alone
- 2,4240.02%Native Hawaiian and Other
Pacific Islander alone

Income and house value in Scott Township
- Median household income in 2022
- $82,903White non-Hispanic householders
- $99,517Black householders
- $131,592Asian householders
- $60,076Some other race householders
- $125,088Two or more races householders
- $56,768Hispanic or Latino race householders
- Median 2022 house value
- $259,933White Non-Hispanic householders
- $348,613Black or African American householders
- $505,263Asian householders
- $365,074Hispanic or Latino householders
Household income for White non-Hispanic householders

Household income for Black householders

Household income for Asian householders

Household income for Two or more races householders

Household income for Hispanic or Latino race householders

Foreign-born residents in Scott Township
1,543 residents are foreign born (6.7% Asia, 2.0% Europe).
| This city: | 8.9% |
| Pennsylvania: | 4.1% |
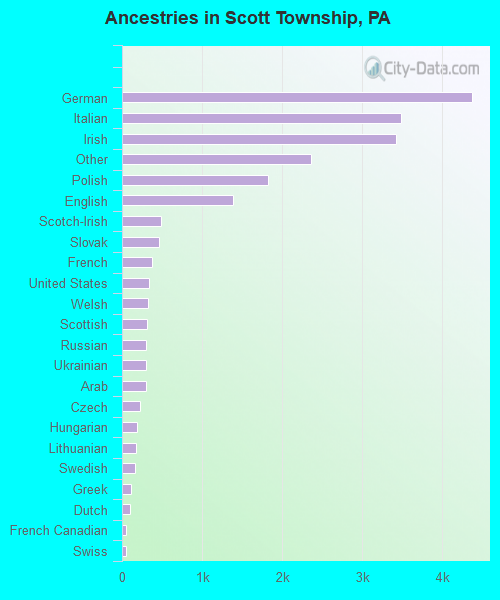
Ancestries in Scott Township

- 4,36320.6%German
- 3,48416.5%Italian
- 3,41916.2%Irish
- 2,35911.2%Other
- 1,8268.6%Polish
- 1,3916.6%English
- 4872.3%Scotch-Irish
- 4612.2%Slovak
- 3771.8%French
- 3341.6%United States
- 3281.6%Welsh
- 3071.5%Scottish
- 3041.4%Russian
- 2981.4%Ukrainian
- 2941.4%Arab
- 2291.1%Czech
- 1920.9%Hungarian
- 1710.8%Lithuanian
- 1600.8%Swedish
- 1070.5%Greek
- 970.5%Dutch
- 520.2%French Canadian
- 460.2%Swiss
- 320.2%Norwegian
- 140.07%Portuguese
- 60.03%Danish
Zip codes: 15106.