Races in Scituate, Rhode Island (RI) Detailed Stats
Ancestries, Foreign-born residents, place of birth
2.9% of Scituate, RI residents are foreign-born (2.2% born in Europe, 0.4% born in Asia), which is 388.3% less than the foreign-born rate of 14.0% across the entire state of Rhode Island.
Race distribution in Scituate

- 10,07897.6%White alone
- 770.7%Hispanic
- 570.6%Two or more races
- 600.6%Asian alone
- 290.3%Black alone
- 140.1%Other race alone
- 70.07%American Indian alone
- 20.02%Native Hawaiian and Other
Pacific Islander alone

2000
2022
-
- 858,43381.9%White alone
- 90,8208.7%Hispanic
- 41,9224.0%Black alone
- 23,4162.2%Asian alone
- 20,8162.0%Two or more races
- 8,4110.8%Other race alone
- 4,1810.4%American Indian alone
- 3200.03%Native Hawaiian and Other
Pacific Islander alone

-
- 745,82568.2%White alone
- 191,97917.6%Hispanic
- 56,7385.2%Two or more races
- 51,3264.7%Black alone
- 37,2343.4%Asian alone
- 9,5140.9%Other race alone
- 9780.09%American Indian alone
- 1400.01%Native Hawaiian and Other
Pacific Islander alone

Income and house value in Scituate
- Median household income in 2022
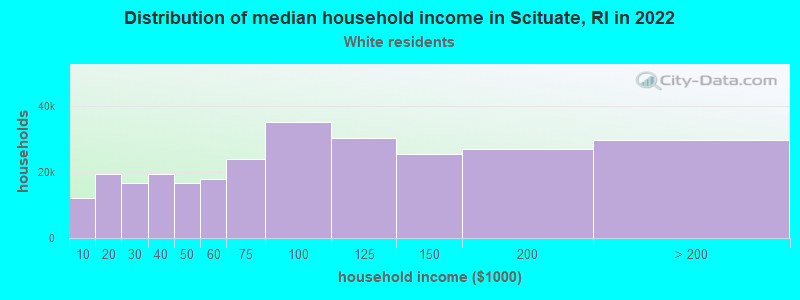
- $120,878White non-Hispanic householders
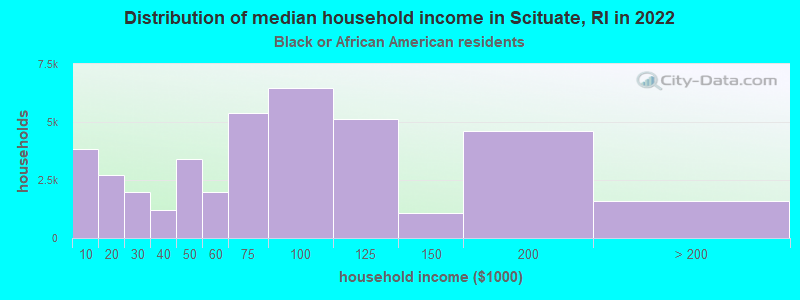
- $169,933Black householders
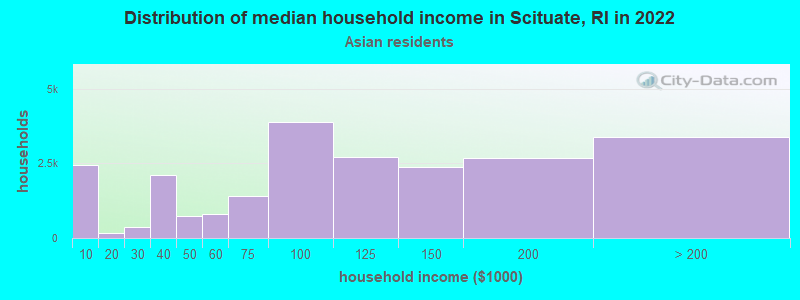
- over $200,000Asian householders
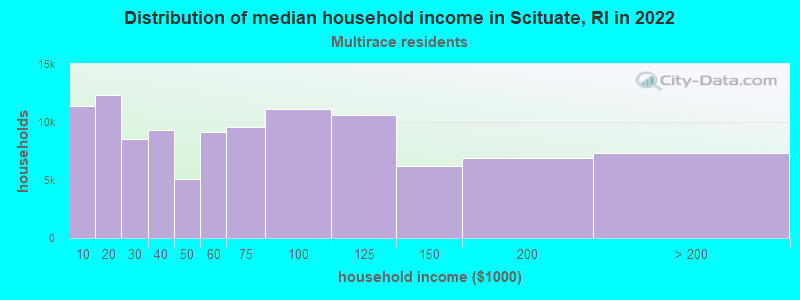
- $194,846Two or more races householders
- over $200,000Hispanic or Latino race householders
- Median 2022 house value
- $514,172White Non-Hispanic householders
- $479,914Asian householders
- $332,248Two or more races householders
- over $1,000,000Hispanic or Latino householders
Household income for White non-Hispanic householders
Household income for Black householders
Household income for Asian householders
Household income for Native Hawaiian and other Pacific Islander householders

Household income for Two or more races householders
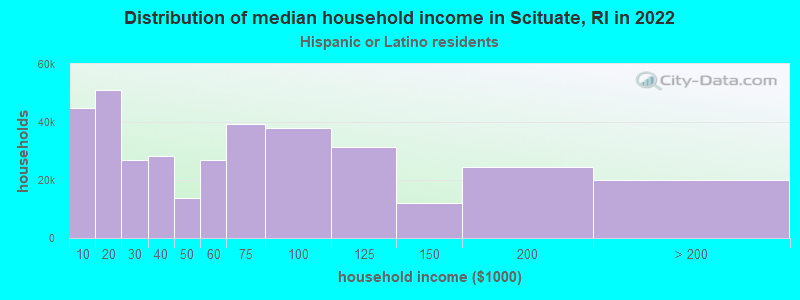
Household income for Hispanic or Latino race householders
Foreign-born residents in Scituate
296 residents are foreign born (2.2% Europe, 0.4% Asia).
| This city: | 2.9% |
| Rhode Island: | 11.4% |
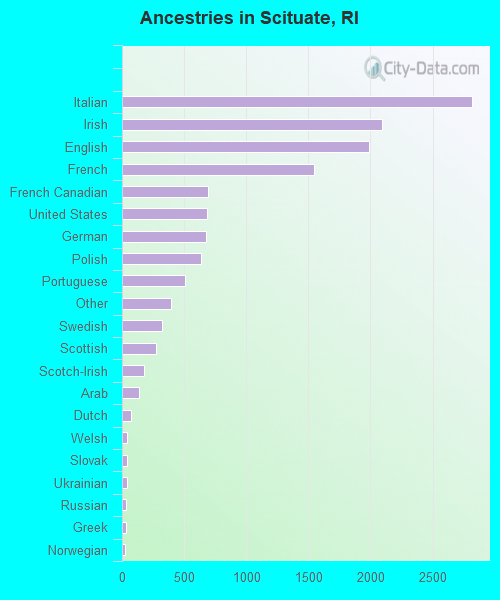
Ancestries in Scituate

- 2,81421.2%Italian
- 2,09615.8%Irish
- 1,98915.0%English
- 1,54711.7%French
- 6965.2%French Canadian
- 6875.2%United States
- 6805.1%German
- 6364.8%Polish
- 5043.8%Portuguese
- 3963.0%Other
- 3192.4%Swedish
- 2712.0%Scottish
- 1761.3%Scotch-Irish
- 1371.0%Arab
- 700.5%Dutch
- 400.3%Welsh
- 370.3%Slovak
- 370.3%Ukrainian
- 360.3%Russian
- 320.2%Greek
- 270.2%Norwegian
- 160.1%Hungarian
- 150.1%Lithuanian
- 90.07%Subsaharan African
Zip codes: 02857.