Races in Schiller Park, Illinois (IL) Detailed Stats
Data:
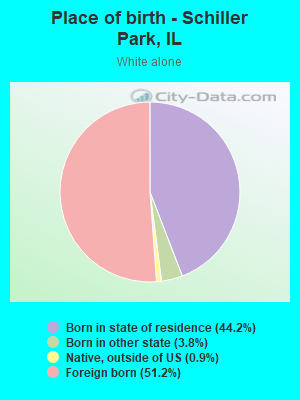
Races - White alone (%)
Races - White alone (% change since 2000)
Races - Black alone (%)
Races - Black alone (% change since 2000)
Races - American Indian alone (%)
Races - American Indian alone (% change since 2000)
Races - Asian alone (%)
Races - Asian alone (% change since 2000)
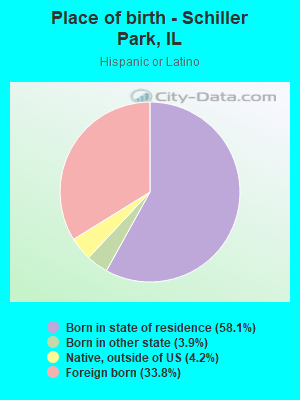
Races - Hispanic (%)
Races - Hispanic (% change since 2000)
Races - Native Hawaiian and Other Pacific Islander alone (%)
Races - Native Hawaiian and Other Pacific Islander alone (% change since 2000)
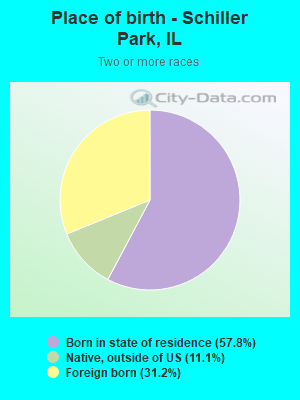
Races - Two or more races(%)
Races - Two or more races(% change since 2000)
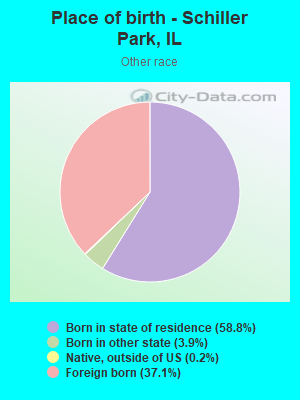
Races - Other race alone (%)
Races - Other race alone (% change since 2000)
Racial diversity
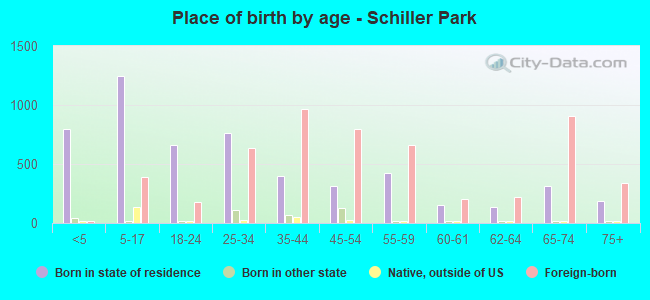
Place of birth - Born in state of residence (%)
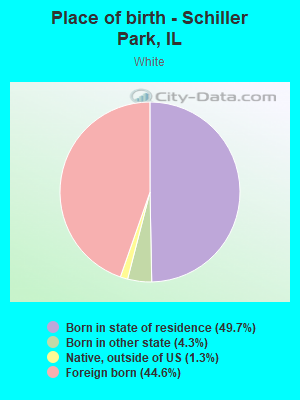
Place of birth - Born in state of residence (%) - White
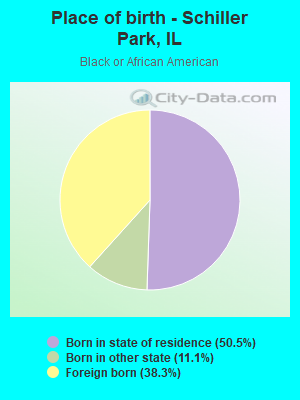
Place of birth - Born in state of residence (%) - Black or African American
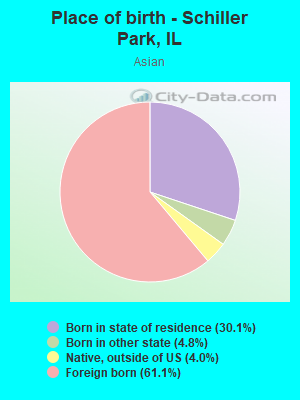
Place of birth - Born in state of residence (%) - Asian
Place of birth - Born in state of residence (%) - Hispanic or Latino
Place of birth - Born in state of residence (%) - American Indian and Alaska Native
Place of birth - Born in state of residence (%) - Multirace
Place of birth - Born in state of residence (%) - Other Race
Place of birth - Born in other state (%)
Place of birth - Born in other state (%) - White
Place of birth - Born in other state (%) - Black or African American
Place of birth - Born in other state (%) - Asian
Place of birth - Born in other state (%) - Hispanic or Latino
Place of birth - Born in other state (%) - American Indian and Alaska Native
Place of birth - Born in other state (%) - Multirace
Place of birth - Born in other state (%) - Other Race
Place of birth - Native, outside of US (%)
Place of birth - Native, outside of US (%) - White
Place of birth - Native, outside of US (%) - Black or African American
Place of birth - Native, outside of US (%) - Asian
Place of birth - Native, outside of US (%) - Hispanic or Latino
Place of birth - Native, outside of US (%) - American Indian and Alaska Native
Place of birth - Native, outside of US (%) - Multirace
Place of birth - Native, outside of US (%) - Other Race
Place of birth - Foreign born (%)
Place of birth - Foreign born (%) - White
Place of birth - Foreign born (%) - Black or African American
Place of birth - Foreign born (%) - Asian
Place of birth - Foreign born (%) - Hispanic or Latino
Place of birth - Foreign born (%) - American Indian and Alaska Native
Place of birth - Foreign born (%) - Multirace
Place of birth - Foreign born (%) - Other Race
Residents speaking English at home (%)
Residents speaking English at home - Born in the United States (%)
Residents speaking English at home - Native, born elsewhere (%)
Residents speaking English at home - Foreign born (%)
Residents speaking Spanish at home (%)
Residents speaking Spanish at home - Born in the United States (%)
Residents speaking Spanish at home - Native, born elsewhere (%)
Residents speaking Spanish at home - Foreign born (%)
Residents speaking other language at home (%)
Residents speaking other language at home - Born in the United States (%)
Residents speaking other language at home - Native, born elsewhere (%)
Residents speaking other language at home - Foreign born (%)
Marital status - Never married (%)
Marital status - Now married (%)
Marital status - Separated (%)
Marital status - Widowed (%)
Marital status - Divorced (%)
Ancestries Reported - Arab (%)
Ancestries Reported - Czech (%)
Ancestries Reported - Danish (%)
Ancestries Reported - Dutch (%)
Ancestries Reported - English (%)
Ancestries Reported - French (%)
Ancestries Reported - French Canadian (%)
Ancestries Reported - German (%)
Ancestries Reported - Greek (%)
Ancestries Reported - Hungarian (%)
Ancestries Reported - Irish (%)
Ancestries Reported - Italian (%)
Ancestries Reported - Lithuanian (%)
Ancestries Reported - Norwegian (%)
Ancestries Reported - Polish (%)
Ancestries Reported - Portuguese (%)
Ancestries Reported - Russian (%)
Ancestries Reported - Scotch-Irish (%)
Ancestries Reported - Scottish (%)
Ancestries Reported - Slovak (%)
Ancestries Reported - Subsaharan African (%)
Ancestries Reported - Swedish (%)
Ancestries Reported - Swiss (%)
Ancestries Reported - Ukrainian (%)
Ancestries Reported - United States (%)
Ancestries Reported - Welsh (%)
Ancestries Reported - West Indian (%)
Ancestries Reported - Other (%)
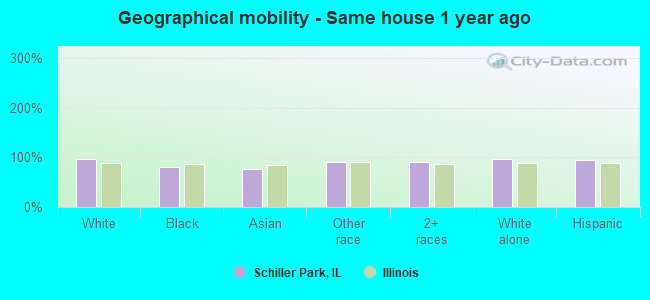
Geographical mobility - Same house 1 year ago (%)
Geographical mobility - Same house 1 year ago (%) - White
Geographical mobility - Same house 1 year ago (%) - Black or African American
Geographical mobility - Same house 1 year ago (%) - Asian
Geographical mobility - Same house 1 year ago (%) - Hispanic or Latino
Geographical mobility - Same house 1 year ago (%) - American Indian and Alaska Native
Geographical mobility - Same house 1 year ago (%) - Multirace
Geographical mobility - Same house 1 year ago (%) - Other Race
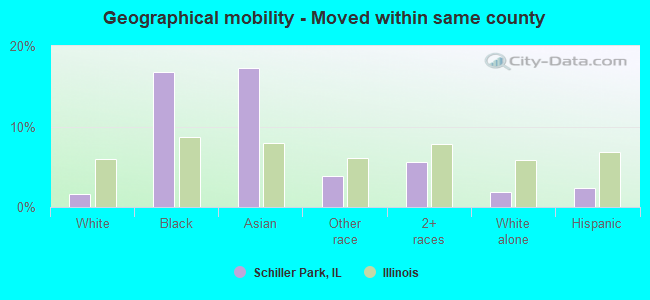
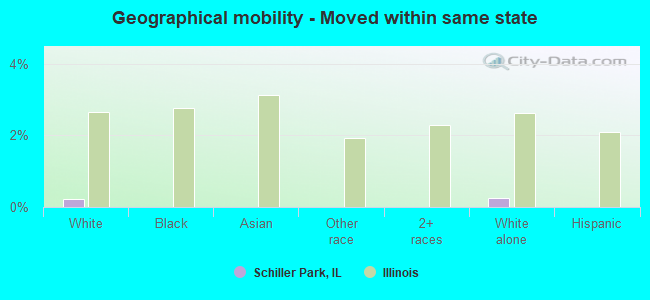
Geographical mobility - Moved within same county (%)
Geographical mobility - Moved within same county (%) - White
Geographical mobility - Moved within same county (%) - Black or African American
Geographical mobility - Moved within same county (%) - Asian
Geographical mobility - Moved within same county (%) - Hispanic or Latino
Geographical mobility - Moved within same county (%) - American Indian and Alaska Native
Geographical mobility - Moved within same county (%) - Multirace
Geographical mobility - Moved within same county (%) - Other Race
Geographical mobility - Moved from different county within same state (%)
Geographical mobility - Moved from different county within same state (%) - White
Geographical mobility - Moved from different county within same state (%) - Black or African American
Geographical mobility - Moved from different county within same state (%) - Asian
Geographical mobility - Moved from different county within same state (%) - Hispanic or Latino
Geographical mobility - Moved from different county within same state (%) - American Indian and Alaska Native
Geographical mobility - Moved from different county within same state (%) - Multirace
Geographical mobility - Moved from different county within same state (%) - Other Race
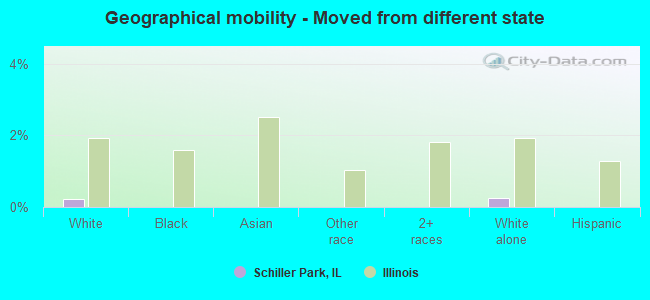
Geographical mobility - Moved from different state (%)
Geographical mobility - Moved from different state (%) - White
Geographical mobility - Moved from different state (%) - Black or African American
Geographical mobility - Moved from different state (%) - Asian
Geographical mobility - Moved from different state (%) - Hispanic or Latino
Geographical mobility - Moved from different state (%) - American Indian and Alaska Native
Geographical mobility - Moved from different state (%) - Multirace
Geographical mobility - Moved from different state (%) - Other Race
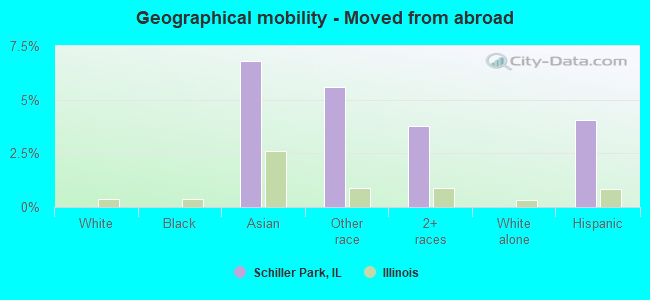
Geographical mobility - Moved from abroad (%)
Geographical mobility - Moved from abroad (%) - White
Geographical mobility - Moved from abroad (%) - Black or African American
Geographical mobility - Moved from abroad (%) - Asian
Geographical mobility - Moved from abroad (%) - Hispanic or Latino
Geographical mobility - Moved from abroad (%) - American Indian and Alaska Native
Geographical mobility - Moved from abroad (%) - Multirace
Geographical mobility - Moved from abroad (%) - Other Race
Place of birth for the foreign-born population - Ireland (%)
Place of birth for the foreign-born population - Denmark (%)
Place of birth for the foreign-born population - Norway (%)
Place of birth for the foreign-born population - Sweden (%)
Place of birth for the foreign-born population - United Kingdom (%)
Place of birth for the foreign-born population - England (%)
Place of birth for the foreign-born population - Scotland (%)
Place of birth for the foreign-born population - Other Northern Europe (%)
Place of birth for the foreign-born population - Austria (%)
Place of birth for the foreign-born population - Belgium (%)
Place of birth for the foreign-born population - France (%)
Place of birth for the foreign-born population - Germany (%)
Place of birth for the foreign-born population - Netherlands (%)
Place of birth for the foreign-born population - Switzerland (%)
Place of birth for the foreign-born population - Other Western Europe (%)
Place of birth for the foreign-born population - Greece (%)
Place of birth for the foreign-born population - Italy (%)
Place of birth for the foreign-born population - Portugal (%)
Place of birth for the foreign-born population - Spain (%)
Place of birth for the foreign-born population - Other Southern Europe (%)
Place of birth for the foreign-born population - Albania (%)
Place of birth for the foreign-born population - Belarus (%)
Place of birth for the foreign-born population - Bosnia and Herzegovina (%)
Place of birth for the foreign-born population - Bulgaria (%)
Place of birth for the foreign-born population - Croatia (%)
Place of birth for the foreign-born population - Czechoslovakia (%)
Place of birth for the foreign-born population - Hungary (%)
Place of birth for the foreign-born population - Latvia (%)
Place of birth for the foreign-born population - Lithuania (%)
Place of birth for the foreign-born population - North Macedonia (Macedonia) (%)
Place of birth for the foreign-born population - Moldova (%)
Place of birth for the foreign-born population - Poland (%)
Place of birth for the foreign-born population - Romania (%)
Place of birth for the foreign-born population - Russia (%)
Place of birth for the foreign-born population - Serbia (%)
Place of birth for the foreign-born population - Ukraine (%)
Place of birth for the foreign-born population - Other Eastern Europe (%)
Place of birth for the foreign-born population - China (%)
Place of birth for the foreign-born population - Hong Kong (%)
Place of birth for the foreign-born population - Taiwan (%)
Place of birth for the foreign-born population - Japan (%)
Place of birth for the foreign-born population - Korea (%)
Place of birth for the foreign-born population - Other Eastern Asia (%)
Place of birth for the foreign-born population - Afghanistan (%)
Place of birth for the foreign-born population - Bangladesh (%)
Place of birth for the foreign-born population - India (%)
Place of birth for the foreign-born population - Iran (%)
Place of birth for the foreign-born population - Kazakhstan (%)
Place of birth for the foreign-born population - Nepal (%)
Place of birth for the foreign-born population - Pakistan (%)
Place of birth for the foreign-born population - Sri Lanka (%)
Place of birth for the foreign-born population - Uzbekistan (%)
Place of birth for the foreign-born population - Other South Central Asia (%)
Place of birth for the foreign-born population - Burma (%)
Place of birth for the foreign-born population - Cambodia (%)
Place of birth for the foreign-born population - Indonesia (%)
Place of birth for the foreign-born population - Laos (%)
Place of birth for the foreign-born population - Malaysia (%)
Place of birth for the foreign-born population - Philippines (%)
Place of birth for the foreign-born population - Singapore (%)
Place of birth for the foreign-born population - Thailand (%)
Place of birth for the foreign-born population - Vietnam (%)
Place of birth for the foreign-born population - Other South Eastern Asia (%)
Place of birth for the foreign-born population - Armenia (%)
Place of birth for the foreign-born population - Iraq (%)
Place of birth for the foreign-born population - Israel (%)
Place of birth for the foreign-born population - Jordan (%)
Place of birth for the foreign-born population - Kuwait (%)
Place of birth for the foreign-born population - Lebanon (%)
Place of birth for the foreign-born population - Saudi Arabia (%)
Place of birth for the foreign-born population - Syria (%)
Place of birth for the foreign-born population - Turkey (%)
Place of birth for the foreign-born population - Yemen (%)
Place of birth for the foreign-born population - Other Western Asia (%)
Place of birth for the foreign-born population - Eritrea (%)
Place of birth for the foreign-born population - Ethiopia (%)
Place of birth for the foreign-born population - Kenya (%)
Place of birth for the foreign-born population - Somalia (%)
Place of birth for the foreign-born population - Uganda (%)
Place of birth for the foreign-born population - Zimbabwe (%)
Place of birth for the foreign-born population - Other Eastern Africa (%)
Place of birth for the foreign-born population - Cameroon (%)
Place of birth for the foreign-born population - Congo (%)
Place of birth for the foreign-born population - Democratic Republic of Congo (Zaire) (%)
Place of birth for the foreign-born population - Other Middle Africa (%)
Place of birth for the foreign-born population - Egypt (%)
Place of birth for the foreign-born population - Morocco (%)
Place of birth for the foreign-born population - Sudan (%)
Place of birth for the foreign-born population - Other Northern Africa (%)
Place of birth for the foreign-born population - South Africa (%)
Place of birth for the foreign-born population - Other Southern Africa (%)
Place of birth for the foreign-born population - Cabo Verde (%)
Place of birth for the foreign-born population - Ghana (%)
Place of birth for the foreign-born population - Liberia (%)
Place of birth for the foreign-born population - Nigeria (%)
Place of birth for the foreign-born population - Senegal (%)
Place of birth for the foreign-born population - Sierra Leone (%)
Place of birth for the foreign-born population - Other Western Africa (%)
Place of birth for the foreign-born population - Australia (%)
Place of birth for the foreign-born population - New Zealand (%)
Place of birth for the foreign-born population - Fiji (%)
Place of birth for the foreign-born population - Micronesia (%)
Place of birth for the foreign-born population - Bahamas (%)
Place of birth for the foreign-born population - Barbados (%)
Place of birth for the foreign-born population - Cuba (%)
Place of birth for the foreign-born population - Dominica (%)
Place of birth for the foreign-born population - Dominican Republic (%)
Place of birth for the foreign-born population - Grenada (%)
Place of birth for the foreign-born population - Haiti (%)
Place of birth for the foreign-born population - Jamaica (%)
Place of birth for the foreign-born population - St. Vincent and the Grenadines (%)
Place of birth for the foreign-born population - Trinidad and Tobago (%)
Place of birth for the foreign-born population - West Indies (%)
Place of birth for the foreign-born population - Other Caribbean (%)
Place of birth for the foreign-born population - Belize (%)
Place of birth for the foreign-born population - Costa Rica (%)
Place of birth for the foreign-born population - El Salvador (%)
Place of birth for the foreign-born population - Guatemala (%)
Place of birth for the foreign-born population - Honduras (%)
Place of birth for the foreign-born population - Mexico (%)
Place of birth for the foreign-born population - Nicaragua (%)
Place of birth for the foreign-born population - Panama (%)
Place of birth for the foreign-born population - Other Central America (%)
Place of birth for the foreign-born population - Argentina (%)
Place of birth for the foreign-born population - Bolivia (%)
Place of birth for the foreign-born population - Brazil (%)
Place of birth for the foreign-born population - Chile (%)
Place of birth for the foreign-born population - Colombia (%)
Place of birth for the foreign-born population - Ecuador (%)
Place of birth for the foreign-born population - Guyana (%)
Place of birth for the foreign-born population - Peru (%)
Place of birth for the foreign-born population - Uruguay (%)
Place of birth for the foreign-born population - Venezuela (%)
Place of birth for the foreign-born population - Other South America (%)
Place of birth for the foreign-born population - Canada (%)
Place of birth for the foreign-born population - Other Northern America (%)
Place of birth for the foreign-born population - Other (%)
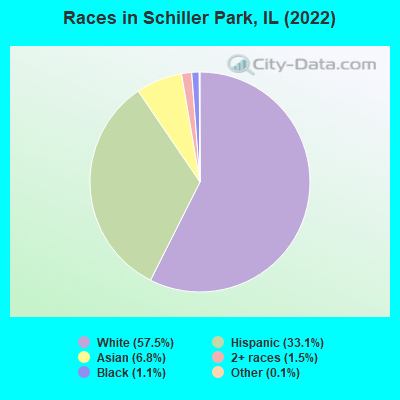
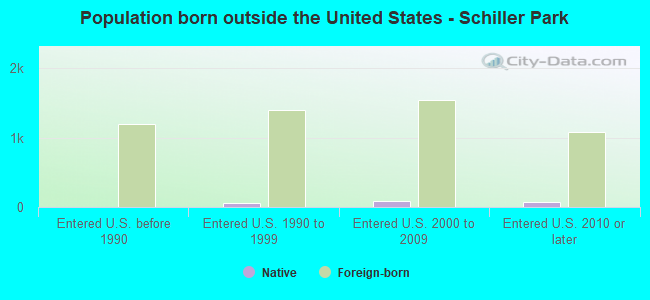
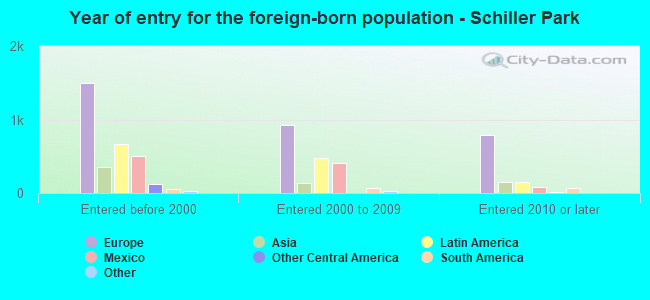
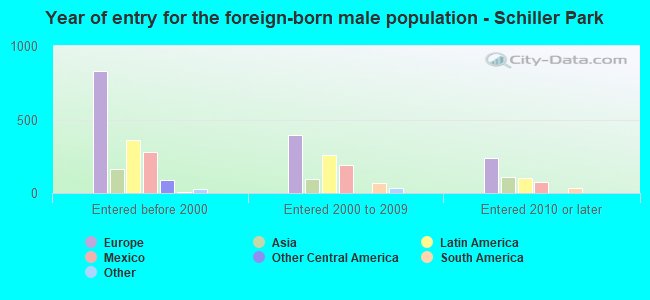
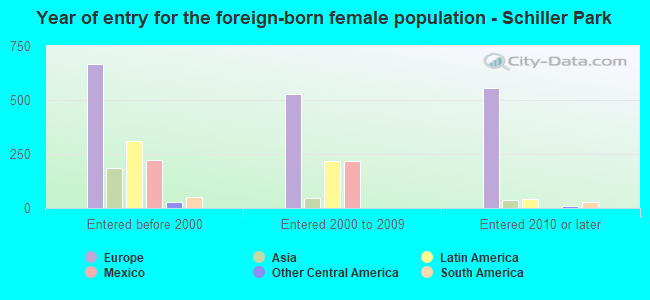
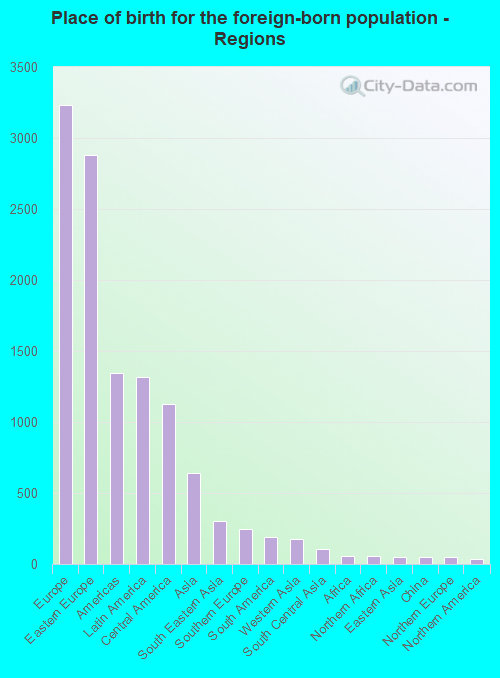
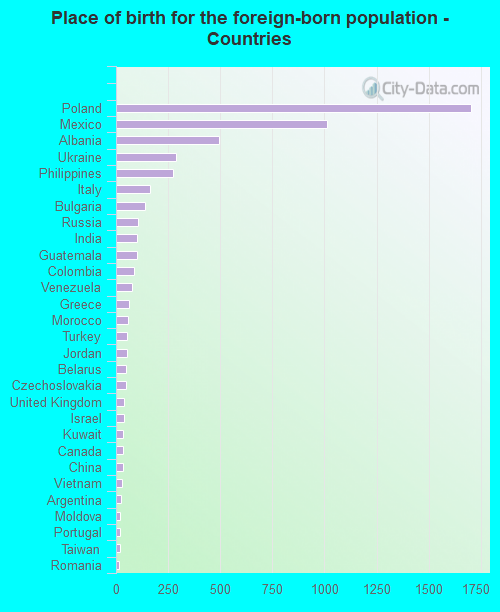
According to 2022 data, the most numerous races in Schiller Park, IL are White alone (6,517 residents), Hispanic (3,758 residents), and Black alone (124 residents). 34.6% of Schiller Park residents speak English at home. 46.5% of Schiller Park, IL residents are foreign-born (28.0% born in Europe, 11.4% born in Latin America, 5.6% born in Asia), which is 69.9% greater than the foreign-born rate of 14.0% across the entire state of Illinois.
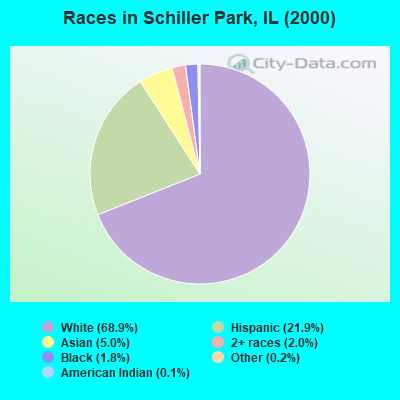
Race distribution in Schiller Park
2000 2022
8,424,140 67.8% White alone 1,856,152 14.9% Black alone 1,530,262 12.3% Hispanic 419,916 3.4% Asian alone 153,996 1.2% Two or more races 13,479 0.1% Other race alone 18,232 0.1% American Indian alone 3,116 0.03% Native Hawaiian and Other
7,356,301 58.5% White alone 2,299,726 18.3% Hispanic 1,660,423 13.2% Black alone 747,296 5.9% Asian alone 458,599 3.6% Two or more races 45,386 0.4% Other race alone 10,405 0.08% American Indian alone 3,896 0.03% Native Hawaiian and Other
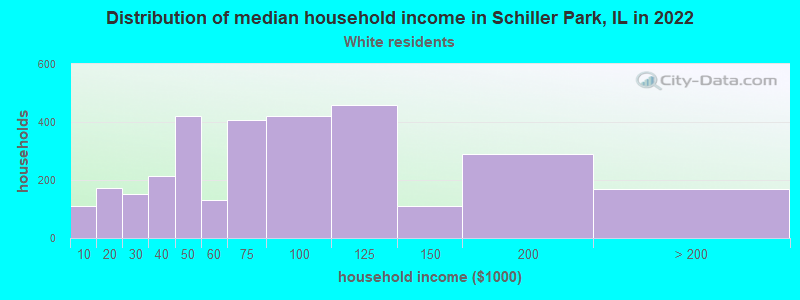
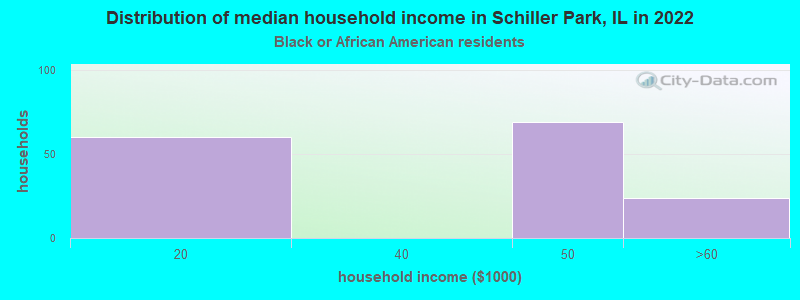
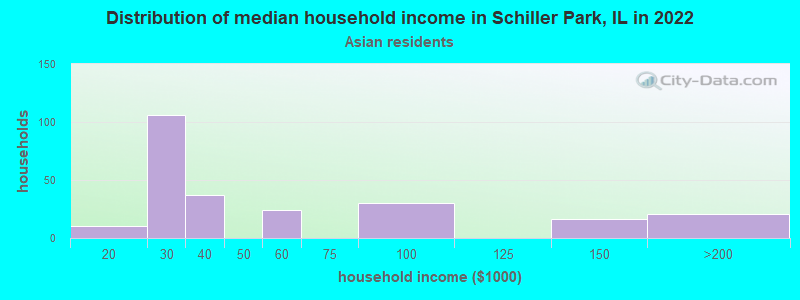
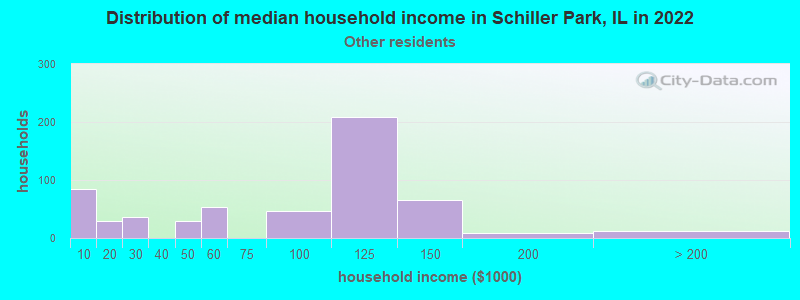
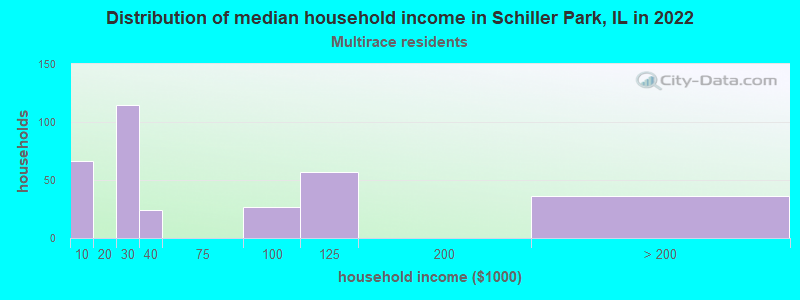
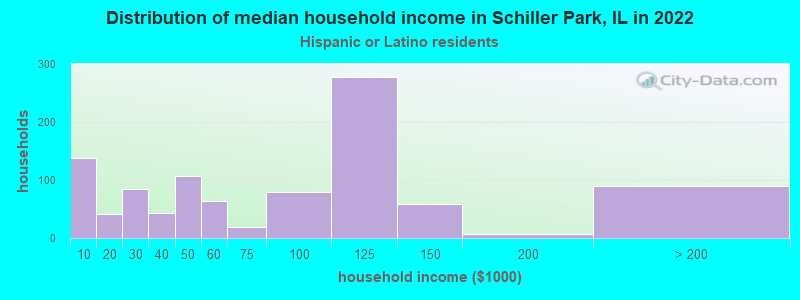
Income and house value in Schiller Park Median household income in 2022 $70,852 White non-Hispanic householders$39,426 Black householders$33,707 Asian householders$90,606 Some other race householders$75,453 Hispanic or Latino race householdersMedian 2022 house value $277,625 White Non-Hispanic householders $323,924 Asian householders$270,449 Some other race householders$224,321 Two or more races householders$267,032 Hispanic or Latino householders
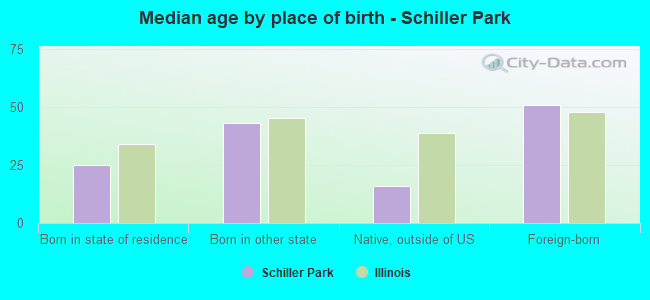
Median age by race in Schiller Park
43.5 Median age for White residents43.9 41.6 41.2 Median age for Black or African American residents40.8 55.6 -680,473,372.1 Median age for American Indian / Alaska Native residents-736,736,736.0 -641,399,416.3 43.5 Median age for Asian residents39.6 47.8 -687,999,999.3 Median age for Native Hawaiian / Pacific Islander residents-918,721,460.3 -610,229,276.3 27.5 Median age for Other race residents27.4 29.2 38.3 Median age for Two or more races residents14.6 52.5 46.6 Median age for White alone residents49.3 45.2 27.6 Median age for Hispanic or Latino residents26.3 29.9
Owner/renter occupied households by race in Schiller Park
House owners and renters - White residents 1,906 62.5% Owner occupied1,145 37.5% Renter occupiedHouse owners and renters - Black or African American residents 58 40.7% Owner occupied85 59.3% Renter occupiedHouse owners and renters - Asian residents 131 58.0% Owner occupied95 42.0% Renter occupiedHouse owners and renters - Other race residents 206 38.2% Owner occupied333 61.8% Renter occupiedHouse owners and renters - Two or more races residents 111 34.4% Owner occupied211 65.6% Renter occupiedHouse owners and renters - White alone residents 1,786 61.1% Owner occupied1,135 38.9% Renter occupiedHouse owners and renters - Hispanic or Latino residents 504 49.8% Owner occupied508 50.2% Renter occupied
Language usage in Schiller Park
English speakers - Total 34.6% of residents of Schiller Park speak English at home.
25.6% of residents speak Spanish at home 1,737 64.7% Speak English very well949 35.3% Speak English less than very well40.7% of residents speak other language at home 2,508 58.8% Speak English very well1,755 41.2% Speak English less than very well
English speakers - Born in the United States 63.9% of residents of Schiller Park speak English at home.
34.7% of residents speak Spanish at home 33 25.0% Speak English very well99 75.0% Speak English less than very well2.4% of residents speak other language at home 9 100.0% Speak English less than very well
English speakers - Native, born elsewhere 21.8% of residents of Schiller Park speak English at home.
63.6% of residents speak Spanish at home 125 82.2% Speak English very well27 17.8% Speak English less than very well15.5% of residents speak other language at home 24 64.9% Speak English very well13 35.1% Speak English less than very well
English speakers - Foreign-born 10.7% of residents of Schiller Park speak English at home.
23.3% of residents speak Spanish at home 430 35.0% Speak English very well799 65.0% Speak English less than very well65.7% of residents speak other language at home 1,745 50.3% Speak English very well1,723 49.7% Speak English less than very well
White (Caucasian) - Speak only English Native:
72.2% (2,400)Foreign-born:
12.8% (370)
White (Caucasian) - Speak another language Native:
23.0% (763)Foreign-born:
87.1% (2,510)
Black or African American - Speak only English Native:
100.0% (85)Foreign-born:
100.0% (54)
Asian - Speak only English Native:
68.1% (162)Foreign-born:
10.5% (49)
Asian - Speak another language Native:
32.0% (76)Foreign-born:
89.6% (423)
Other race - Speak only English Native:
13.1% (142)Foreign-born:
4.1% (35)
Other race - Speak another language Native:
85.9% (935)Foreign-born:
96.0% (830)
Two or more races - Speak another language Native:
52.9% (277)Foreign-born:
100.0% (301)
White alone - Speak only English Native:
78.4% (2,334)Foreign-born:
11.5% (386)
White alone - Speak another language Native:
23.0% (684)Foreign-born:
88.9% (2,971)
Hispanic or Latino - Speak only English Native:
21.7% (417)Foreign-born:
3.2% (41)
Hispanic or Latino - Speak another language Native:
77.6% (1,491)Foreign-born:
97.0% (1,231)
Foreign-born residents in Schiller Park 5,279 residents are foreign born (28.0% Europe , 11.4% Latin America , 5.6% Asia ).
This city:
46.5%Illinois:
14.1%
Marital status for residents in Schiller Park Marital status - White (Caucasian) population 15 years and over
Males 29.4% Never married56.4% Now married5.0% Separated0.5% Widowed8.6% DivorcedFemales 26.2% Never married58.2% Now married0.0% Separated10.4% Widowed5.2% DivorcedWomen who gave birth in the past 12 months Now married:
100.0% (84)Unmarried:
0.0% (0)
Women who did not give birth in the past 12 months Now married:
49.7% (607)Unmarried:
50.3% (614)
Marital status - Black or African American population 15 years and over
Males 22.7% Never married0.0% Now married0.0% Separated0.0% Widowed77.3% DivorcedFemales 88.9% Never married0.0% Now married0.0% Separated0.0% Widowed11.1% DivorcedWomen who did not give birth in the past 12 months Now married:
0.0% (0)Unmarried:
100.0% (5)
Marital status - Asian population 15 years and over
Males 34.6% Never married46.9% Now married6.6% Separated0.0% Widowed11.9% DivorcedFemales 15.5% Never married65.8% Now married9.5% Separated9.2% Widowed0.0% DivorcedWomen who gave birth in the past 12 months Now married:
100.0% (18)Unmarried:
0.0% (0)
Women who did not give birth in the past 12 months Now married:
65.4% (84)Unmarried:
34.6% (44)
Marital status - Other race population 15 years and over
Males 36.5% Never married58.3% Now married3.2% Separated0.0% Widowed2.0% DivorcedFemales 47.3% Never married41.5% Now married1.3% Separated0.0% Widowed9.9% DivorcedWomen who gave birth in the past 12 months Now married:
100.0% (41)Unmarried:
0.0% (0)
Women who did not give birth in the past 12 months Now married:
23.1% (145)Unmarried:
76.9% (482)
Marital status - Two or more races population 15 years and over
Males 56.9% Never married23.4% Now married0.0% Separated0.0% Widowed19.7% DivorcedFemales 5.5% Never married39.2% Now married15.0% Separated12.5% Widowed27.8% DivorcedWomen who gave birth in the past 12 months Now married:
100.0% (37)Unmarried:
0.0% (0)
Women who did not give birth in the past 12 months Now married:
84.7% (115)Unmarried:
15.3% (21)
Marital status - White alone, not Hispanic / Latino population 15 years and over
Males 28.4% Never married56.6% Now married5.6% Separated0.6% Widowed8.8% DivorcedFemales 27.0% Never married56.6% Now married0.0% Separated10.7% Widowed5.8% DivorcedWomen who did not give birth in the past 12 months Now married:
50.6% (644)Unmarried:
49.4% (629)
Marital status - Hispanic or Latino population 15 years and over
Males 41.4% Never married53.3% Now married1.7% Separated0.0% Widowed3.5% DivorcedFemales 33.4% Never married51.8% Now married4.1% Separated4.8% Widowed5.9% DivorcedWomen who gave birth in the past 12 months Now married:
100.0% (162)Unmarried:
0.0% (0)
Women who did not give birth in the past 12 months Now married:
33.7% (250)Unmarried:
66.3% (490)
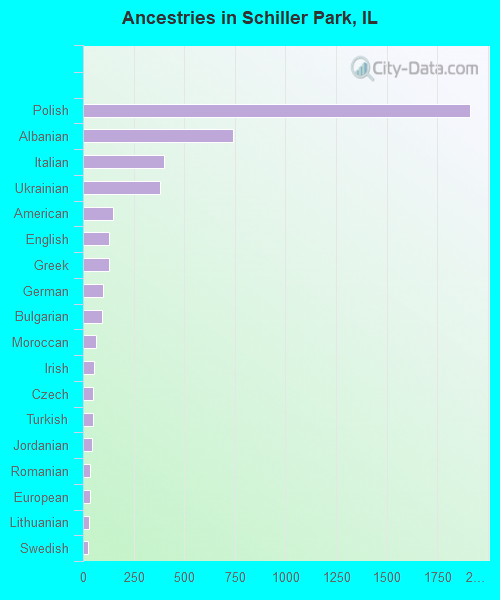
Ancestries in Schiller Park
1,910 24.5% Polish739 9.5% Albanian398 5.1% Italian382 4.9% Ukrainian150 1.9% American130 1.7% English126 1.6% Greek100 1.3% German96 1.2% Bulgarian62 0.8% Moroccan56 0.7% Irish50 0.6% Czech47 0.6% Turkish43 0.6% Jordanian37 0.5% Romanian35 0.4% European29 0.4% Lithuanian27 0.3% Swedish17 0.2% Luxembourger15 0.2% Portuguese13 0.2% Arab12 0.2% Eastern European12 0.2% Belizean8 0.1% Finnish1 0.01% Croatian
Children Nativity (place of birth) in Schiller Park
Children under 6 years - Living with two parents Both parents native 286 100.0% NativeBoth parents foreign-born 205 100.0% NativeOne native, one foreign-born parent 154 100.0% NativeChildren under 6 years - Living with one parent Native parent 258 100.0% NativeForeign-born parent 39 100.0% NativeChildren 6 to 17 years - Living with two parents Both parents native 242 100.0% NativeBoth parents foreign-born 260 43.4% Native339 56.6% Foreign-bornOne native, one foreign-born parent 301 100.0% NativeChildren 6 to 17 years - Living with one parent Native parent 230 100.0% NativeForeign-born parent 193 56.9% Native146 43.1% Foreign-born
Grandparents responsible for own grandchildren in Schiller Park
Grandparents (30 to 59 years) White / Caucasian 22 100.0% Not responsible for grandchildrenAsian 28 100.0% Not responsible for grandchildrenOther race 213 100.0% Not responsible for grandchildrenTwo or more races 27 100.0% Not responsible for grandchildrenHispanic or Latino 229 100.0% Not responsible for grandchildren
Grandparents (60 years and over) White / Caucasian 102 100.0% Not responsible for grandchildrenAsian 16 100.0% Not responsible for grandchildrenOther race 17 100.0% Not responsible for grandchildrenTwo or more races 54 100.0% Not responsible for grandchildrenHispanic or Latino 81 100.0% Not responsible for grandchildren