Races in Schaumburg, Illinois (IL) Detailed Stats
Data:
Races - White alone (%)
Races - White alone (% change since 2000)
Races - Black alone (%)
Races - Black alone (% change since 2000)
Races - American Indian alone (%)
Races - American Indian alone (% change since 2000)
Races - Asian alone (%)
Races - Asian alone (% change since 2000)
Races - Hispanic (%)
Races - Hispanic (% change since 2000)
Races - Native Hawaiian and Other Pacific Islander alone (%)
Races - Native Hawaiian and Other Pacific Islander alone (% change since 2000)
Races - Two or more races(%)
Races - Two or more races(% change since 2000)
Races - Other race alone (%)
Races - Other race alone (% change since 2000)
Racial diversity
Place of birth - Born in state of residence (%)
Place of birth - Born in state of residence (%) - White
Place of birth - Born in state of residence (%) - Black or African American
Place of birth - Born in state of residence (%) - Asian
Place of birth - Born in state of residence (%) - Hispanic or Latino
Place of birth - Born in state of residence (%) - American Indian and Alaska Native
Place of birth - Born in state of residence (%) - Multirace
Place of birth - Born in state of residence (%) - Other Race
Place of birth - Born in other state (%)
Place of birth - Born in other state (%) - White
Place of birth - Born in other state (%) - Black or African American
Place of birth - Born in other state (%) - Asian
Place of birth - Born in other state (%) - Hispanic or Latino
Place of birth - Born in other state (%) - American Indian and Alaska Native
Place of birth - Born in other state (%) - Multirace
Place of birth - Born in other state (%) - Other Race
Place of birth - Native, outside of US (%)
Place of birth - Native, outside of US (%) - White
Place of birth - Native, outside of US (%) - Black or African American
Place of birth - Native, outside of US (%) - Asian
Place of birth - Native, outside of US (%) - Hispanic or Latino
Place of birth - Native, outside of US (%) - American Indian and Alaska Native
Place of birth - Native, outside of US (%) - Multirace
Place of birth - Native, outside of US (%) - Other Race
Place of birth - Foreign born (%)
Place of birth - Foreign born (%) - White
Place of birth - Foreign born (%) - Black or African American
Place of birth - Foreign born (%) - Asian
Place of birth - Foreign born (%) - Hispanic or Latino
Place of birth - Foreign born (%) - American Indian and Alaska Native
Place of birth - Foreign born (%) - Multirace
Place of birth - Foreign born (%) - Other Race
Residents speaking English at home (%)
Residents speaking English at home - Born in the United States (%)
Residents speaking English at home - Native, born elsewhere (%)
Residents speaking English at home - Foreign born (%)
Residents speaking Spanish at home (%)
Residents speaking Spanish at home - Born in the United States (%)
Residents speaking Spanish at home - Native, born elsewhere (%)
Residents speaking Spanish at home - Foreign born (%)
Residents speaking other language at home (%)
Residents speaking other language at home - Born in the United States (%)
Residents speaking other language at home - Native, born elsewhere (%)
Residents speaking other language at home - Foreign born (%)
Marital status - Never married (%)
Marital status - Now married (%)
Marital status - Separated (%)
Marital status - Widowed (%)
Marital status - Divorced (%)
Ancestries Reported - Arab (%)
Ancestries Reported - Czech (%)
Ancestries Reported - Danish (%)
Ancestries Reported - Dutch (%)
Ancestries Reported - English (%)
Ancestries Reported - French (%)
Ancestries Reported - French Canadian (%)
Ancestries Reported - German (%)
Ancestries Reported - Greek (%)
Ancestries Reported - Hungarian (%)
Ancestries Reported - Irish (%)
Ancestries Reported - Italian (%)
Ancestries Reported - Lithuanian (%)
Ancestries Reported - Norwegian (%)
Ancestries Reported - Polish (%)
Ancestries Reported - Portuguese (%)
Ancestries Reported - Russian (%)
Ancestries Reported - Scotch-Irish (%)
Ancestries Reported - Scottish (%)
Ancestries Reported - Slovak (%)
Ancestries Reported - Subsaharan African (%)
Ancestries Reported - Swedish (%)
Ancestries Reported - Swiss (%)
Ancestries Reported - Ukrainian (%)
Ancestries Reported - United States (%)
Ancestries Reported - Welsh (%)
Ancestries Reported - West Indian (%)
Ancestries Reported - Other (%)
Geographical mobility - Same house 1 year ago (%)
Geographical mobility - Same house 1 year ago (%) - White
Geographical mobility - Same house 1 year ago (%) - Black or African American
Geographical mobility - Same house 1 year ago (%) - Asian
Geographical mobility - Same house 1 year ago (%) - Hispanic or Latino
Geographical mobility - Same house 1 year ago (%) - American Indian and Alaska Native
Geographical mobility - Same house 1 year ago (%) - Multirace
Geographical mobility - Same house 1 year ago (%) - Other Race
Geographical mobility - Moved within same county (%)
Geographical mobility - Moved within same county (%) - White
Geographical mobility - Moved within same county (%) - Black or African American
Geographical mobility - Moved within same county (%) - Asian
Geographical mobility - Moved within same county (%) - Hispanic or Latino
Geographical mobility - Moved within same county (%) - American Indian and Alaska Native
Geographical mobility - Moved within same county (%) - Multirace
Geographical mobility - Moved within same county (%) - Other Race
Geographical mobility - Moved from different county within same state (%)
Geographical mobility - Moved from different county within same state (%) - White
Geographical mobility - Moved from different county within same state (%) - Black or African American
Geographical mobility - Moved from different county within same state (%) - Asian
Geographical mobility - Moved from different county within same state (%) - Hispanic or Latino
Geographical mobility - Moved from different county within same state (%) - American Indian and Alaska Native
Geographical mobility - Moved from different county within same state (%) - Multirace
Geographical mobility - Moved from different county within same state (%) - Other Race
Geographical mobility - Moved from different state (%)
Geographical mobility - Moved from different state (%) - White
Geographical mobility - Moved from different state (%) - Black or African American
Geographical mobility - Moved from different state (%) - Asian
Geographical mobility - Moved from different state (%) - Hispanic or Latino
Geographical mobility - Moved from different state (%) - American Indian and Alaska Native
Geographical mobility - Moved from different state (%) - Multirace
Geographical mobility - Moved from different state (%) - Other Race
Geographical mobility - Moved from abroad (%)
Geographical mobility - Moved from abroad (%) - White
Geographical mobility - Moved from abroad (%) - Black or African American
Geographical mobility - Moved from abroad (%) - Asian
Geographical mobility - Moved from abroad (%) - Hispanic or Latino
Geographical mobility - Moved from abroad (%) - American Indian and Alaska Native
Geographical mobility - Moved from abroad (%) - Multirace
Geographical mobility - Moved from abroad (%) - Other Race
Place of birth for the foreign-born population - Ireland (%)
Place of birth for the foreign-born population - Denmark (%)
Place of birth for the foreign-born population - Norway (%)
Place of birth for the foreign-born population - Sweden (%)
Place of birth for the foreign-born population - United Kingdom (%)
Place of birth for the foreign-born population - England (%)
Place of birth for the foreign-born population - Scotland (%)
Place of birth for the foreign-born population - Other Northern Europe (%)
Place of birth for the foreign-born population - Austria (%)
Place of birth for the foreign-born population - Belgium (%)
Place of birth for the foreign-born population - France (%)
Place of birth for the foreign-born population - Germany (%)
Place of birth for the foreign-born population - Netherlands (%)
Place of birth for the foreign-born population - Switzerland (%)
Place of birth for the foreign-born population - Other Western Europe (%)
Place of birth for the foreign-born population - Greece (%)
Place of birth for the foreign-born population - Italy (%)
Place of birth for the foreign-born population - Portugal (%)
Place of birth for the foreign-born population - Spain (%)
Place of birth for the foreign-born population - Other Southern Europe (%)
Place of birth for the foreign-born population - Albania (%)
Place of birth for the foreign-born population - Belarus (%)
Place of birth for the foreign-born population - Bosnia and Herzegovina (%)
Place of birth for the foreign-born population - Bulgaria (%)
Place of birth for the foreign-born population - Croatia (%)
Place of birth for the foreign-born population - Czechoslovakia (%)
Place of birth for the foreign-born population - Hungary (%)
Place of birth for the foreign-born population - Latvia (%)
Place of birth for the foreign-born population - Lithuania (%)
Place of birth for the foreign-born population - North Macedonia (Macedonia) (%)
Place of birth for the foreign-born population - Moldova (%)
Place of birth for the foreign-born population - Poland (%)
Place of birth for the foreign-born population - Romania (%)
Place of birth for the foreign-born population - Russia (%)
Place of birth for the foreign-born population - Serbia (%)
Place of birth for the foreign-born population - Ukraine (%)
Place of birth for the foreign-born population - Other Eastern Europe (%)
Place of birth for the foreign-born population - China (%)
Place of birth for the foreign-born population - Hong Kong (%)
Place of birth for the foreign-born population - Taiwan (%)
Place of birth for the foreign-born population - Japan (%)
Place of birth for the foreign-born population - Korea (%)
Place of birth for the foreign-born population - Other Eastern Asia (%)
Place of birth for the foreign-born population - Afghanistan (%)
Place of birth for the foreign-born population - Bangladesh (%)
Place of birth for the foreign-born population - India (%)
Place of birth for the foreign-born population - Iran (%)
Place of birth for the foreign-born population - Kazakhstan (%)
Place of birth for the foreign-born population - Nepal (%)
Place of birth for the foreign-born population - Pakistan (%)
Place of birth for the foreign-born population - Sri Lanka (%)
Place of birth for the foreign-born population - Uzbekistan (%)
Place of birth for the foreign-born population - Other South Central Asia (%)
Place of birth for the foreign-born population - Burma (%)
Place of birth for the foreign-born population - Cambodia (%)
Place of birth for the foreign-born population - Indonesia (%)
Place of birth for the foreign-born population - Laos (%)
Place of birth for the foreign-born population - Malaysia (%)
Place of birth for the foreign-born population - Philippines (%)
Place of birth for the foreign-born population - Singapore (%)
Place of birth for the foreign-born population - Thailand (%)
Place of birth for the foreign-born population - Vietnam (%)
Place of birth for the foreign-born population - Other South Eastern Asia (%)
Place of birth for the foreign-born population - Armenia (%)
Place of birth for the foreign-born population - Iraq (%)
Place of birth for the foreign-born population - Israel (%)
Place of birth for the foreign-born population - Jordan (%)
Place of birth for the foreign-born population - Kuwait (%)
Place of birth for the foreign-born population - Lebanon (%)
Place of birth for the foreign-born population - Saudi Arabia (%)
Place of birth for the foreign-born population - Syria (%)
Place of birth for the foreign-born population - Turkey (%)
Place of birth for the foreign-born population - Yemen (%)
Place of birth for the foreign-born population - Other Western Asia (%)
Place of birth for the foreign-born population - Eritrea (%)
Place of birth for the foreign-born population - Ethiopia (%)
Place of birth for the foreign-born population - Kenya (%)
Place of birth for the foreign-born population - Somalia (%)
Place of birth for the foreign-born population - Uganda (%)
Place of birth for the foreign-born population - Zimbabwe (%)
Place of birth for the foreign-born population - Other Eastern Africa (%)
Place of birth for the foreign-born population - Cameroon (%)
Place of birth for the foreign-born population - Congo (%)
Place of birth for the foreign-born population - Democratic Republic of Congo (Zaire) (%)
Place of birth for the foreign-born population - Other Middle Africa (%)
Place of birth for the foreign-born population - Egypt (%)
Place of birth for the foreign-born population - Morocco (%)
Place of birth for the foreign-born population - Sudan (%)
Place of birth for the foreign-born population - Other Northern Africa (%)
Place of birth for the foreign-born population - South Africa (%)
Place of birth for the foreign-born population - Other Southern Africa (%)
Place of birth for the foreign-born population - Cabo Verde (%)
Place of birth for the foreign-born population - Ghana (%)
Place of birth for the foreign-born population - Liberia (%)
Place of birth for the foreign-born population - Nigeria (%)
Place of birth for the foreign-born population - Senegal (%)
Place of birth for the foreign-born population - Sierra Leone (%)
Place of birth for the foreign-born population - Other Western Africa (%)
Place of birth for the foreign-born population - Australia (%)
Place of birth for the foreign-born population - New Zealand (%)
Place of birth for the foreign-born population - Fiji (%)
Place of birth for the foreign-born population - Micronesia (%)
Place of birth for the foreign-born population - Bahamas (%)
Place of birth for the foreign-born population - Barbados (%)
Place of birth for the foreign-born population - Cuba (%)
Place of birth for the foreign-born population - Dominica (%)
Place of birth for the foreign-born population - Dominican Republic (%)
Place of birth for the foreign-born population - Grenada (%)
Place of birth for the foreign-born population - Haiti (%)
Place of birth for the foreign-born population - Jamaica (%)
Place of birth for the foreign-born population - St. Vincent and the Grenadines (%)
Place of birth for the foreign-born population - Trinidad and Tobago (%)
Place of birth for the foreign-born population - West Indies (%)
Place of birth for the foreign-born population - Other Caribbean (%)
Place of birth for the foreign-born population - Belize (%)
Place of birth for the foreign-born population - Costa Rica (%)
Place of birth for the foreign-born population - El Salvador (%)
Place of birth for the foreign-born population - Guatemala (%)
Place of birth for the foreign-born population - Honduras (%)
Place of birth for the foreign-born population - Mexico (%)
Place of birth for the foreign-born population - Nicaragua (%)
Place of birth for the foreign-born population - Panama (%)
Place of birth for the foreign-born population - Other Central America (%)
Place of birth for the foreign-born population - Argentina (%)
Place of birth for the foreign-born population - Bolivia (%)
Place of birth for the foreign-born population - Brazil (%)
Place of birth for the foreign-born population - Chile (%)
Place of birth for the foreign-born population - Colombia (%)
Place of birth for the foreign-born population - Ecuador (%)
Place of birth for the foreign-born population - Guyana (%)
Place of birth for the foreign-born population - Peru (%)
Place of birth for the foreign-born population - Uruguay (%)
Place of birth for the foreign-born population - Venezuela (%)
Place of birth for the foreign-born population - Other South America (%)
Place of birth for the foreign-born population - Canada (%)
Place of birth for the foreign-born population - Other Northern America (%)
Place of birth for the foreign-born population - Other (%)
Latest news about races in Schaumburg, IL collected exclusively by city-data.com from local newspapers, TV, and radio stations
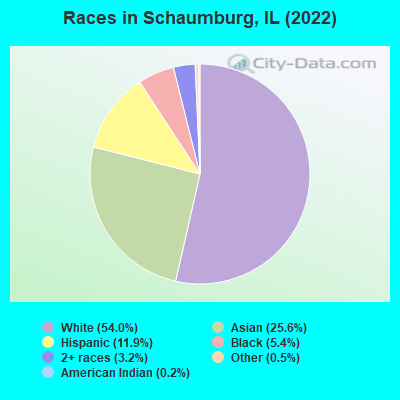
According to 2022 data, the most numerous races in Schaumburg, IL are White alone (40,980 residents), Hispanic (9,006 residents), and Black alone (4,092 residents). 48.5% of Schaumburg residents speak English at home. 31.9% of Schaumburg, IL residents are foreign-born (18.7% born in Asia, 7.5% born in Europe, 3.9% born in Latin America), which is 56.1% greater than the foreign-born rate of 14.0% across the entire state of Illinois.
Race distribution in Schaumburg
2000 2022
56,953 75.5% White alone 10,661 14.1% Asian alone 3,988 5.3% Hispanic 2,479 3.3% Black alone 1,100 1.5% Two or more races 97 0.1% Other race alone 66 0.09% American Indian alone 42 0.06% Native Hawaiian and Other
40,980 54.0% White alone 19,413 25.6% Asian alone 9,006 11.9% Hispanic 4,092 5.4% Black alone 2,404 3.2% Two or more races 365 0.5% Other race alone 140 0.2% American Indian alone 10 0.01% Native Hawaiian and Other
2000 2022
8,424,140 67.8% White alone 1,856,152 14.9% Black alone 1,530,262 12.3% Hispanic 419,916 3.4% Asian alone 153,996 1.2% Two or more races 13,479 0.1% Other race alone 18,232 0.1% American Indian alone 3,116 0.03% Native Hawaiian and Other
7,356,301 58.5% White alone 2,299,726 18.3% Hispanic 1,660,423 13.2% Black alone 747,296 5.9% Asian alone 458,599 3.6% Two or more races 45,386 0.4% Other race alone 10,405 0.08% American Indian alone 3,896 0.03% Native Hawaiian and Other
Income and house value in Schaumburg Median household income in 2022 $88,847 White non-Hispanic householders$113,238 Black householders$117,504 Asian householders$69,139 Some other race householders$96,789 Two or more races householders$88,304 Hispanic or Latino race householdersMedian 2022 house value $351,631 White Non-Hispanic householders$279,813 Black or African American householders$647,535 American Indian or Alaska Native householders $377,140 Asian householders$237,037 Some other race householders$295,904 Two or more races householders$299,632 Hispanic or Latino householders
Median age by race in Schaumburg
44.0 Median age for White residents39.8 50.1 53.8 Median age for Black or African American residents49.5 54.8 32.4 Median age for American Indian / Alaska Native residents41.4 15.8 38.6 Median age for Asian residents38.5 38.9 -666,666,666.0 Median age for Native Hawaiian / Pacific Islander residents-666,666,666.0 -666,666,666.0 40.6 Median age for Other race residents42.7 30.1 22.3 Median age for Two or more races residents21.2 23.0 44.3 Median age for White alone residents40.2 50.4 24.7 Median age for Hispanic or Latino residents32.4 24.1
Owner/renter occupied households by race in Schaumburg
House owners and renters - White residents 14,189 71.6% Owner occupied5,630 28.4% Renter occupiedHouse owners and renters - Black or African American residents 469 43.3% Owner occupied615 56.7% Renter occupiedHouse owners and renters - American Indian / Alaska Native residents 73 31.9% Owner occupied157 68.1% Renter occupiedHouse owners and renters - Asian residents 4,418 60.6% Owner occupied2,877 39.4% Renter occupiedHouse owners and renters - Other race residents 807 58.7% Owner occupied567 41.3% Renter occupiedHouse owners and renters - Two or more races residents 1,220 44.3% Owner occupied1,537 55.7% Renter occupiedHouse owners and renters - White alone residents 14,047 71.9% Owner occupied5,490 28.1% Renter occupiedHouse owners and renters - Hispanic or Latino residents 1,162 34.6% Owner occupied2,197 65.4% Renter occupied
Language usage in Schaumburg
English speakers - Total 48.5% of residents of Schaumburg speak English at home.
13.6% of residents speak Spanish at home 7,591 74.8% Speak English very well2,559 25.2% Speak English less than very well37.9% of residents speak other language at home 20,078 71.1% Speak English very well8,174 28.9% Speak English less than very well
English speakers - Born in the United States 80.2% of residents of Schaumburg speak English at home.
7.8% of residents speak Spanish at home 541 100.0% Speak English very well12.0% of residents speak other language at home 749 90.2% Speak English very well81 9.8% Speak English less than very well
English speakers - Native, born elsewhere 15.3% of residents of Schaumburg speak English at home.
2.5% of residents speak Spanish at home 39 100.0% Speak English less than very well82.3% of residents speak other language at home 1,251 96.8% Speak English very well42 3.2% Speak English less than very well
English speakers - Foreign-born 3.6% of residents of Schaumburg speak English at home.
19.4% of residents speak Spanish at home 3,012 58.4% Speak English very well2,149 41.6% Speak English less than very well77.0% of residents speak other language at home 12,690 61.9% Speak English very well7,805 38.1% Speak English less than very well
White (Caucasian) - Speak only English Native:
87.2% (28,595)Foreign-born:
7.3% (601)
White (Caucasian) - Speak another language Native:
12.8% (4,205)Foreign-born:
92.7% (7,586)
Black or African American - Speak only English Native:
95.6% (3,303)Foreign-born:
45.5% (299)
Black or African American - Speak another language Native:
4.5% (155)Foreign-born:
56.4% (370)
American Indian / Alaska Native - Speak another language Native:
42.4% (174)Foreign-born:
100.0% (168)
Asian - Speak only English Native:
33.0% (1,926)Foreign-born:
2.1% (277)
Asian - Speak another language Native:
67.0% (3,914)Foreign-born:
97.9% (12,843)
Other race - Speak only English Native:
38.5% (831)Foreign-born:
7.2% (115)
Other race - Speak another language Native:
62.6% (1,350)Foreign-born:
92.5% (1,476)
Two or more races - Speak another language Native:
57.6% (3,418)Foreign-born:
100.0% (3,619)
White alone - Speak only English Native:
87.5% (28,237)Foreign-born:
7.5% (601)
White alone - Speak another language Native:
12.5% (4,019)Foreign-born:
92.5% (7,449)
Hispanic or Latino - Speak another language Native:
69.9% (4,650)Foreign-born:
100.0% (5,161)
Foreign-born residents in Schaumburg 24,201 residents are foreign born (18.7% Asia , 7.5% Europe , 3.9% Latin America ).
This city:
31.9%Illinois:
14.1%
Marital status for residents in Schaumburg Marital status - White (Caucasian) population 15 years and over
Males 32.5% Never married56.9% Now married3.3% Separated3.2% Widowed4.0% DivorcedFemales 25.6% Never married47.1% Now married0.4% Separated10.1% Widowed16.7% DivorcedWomen who gave birth in the past 12 months Now married:
88.9% (386)Unmarried:
11.1% (48)
Women who did not give birth in the past 12 months Now married:
41.5% (3,208)Unmarried:
58.5% (4,522)
Marital status - Black or African American population 15 years and over
Males 44.5% Never married44.6% Now married4.7% Separated0.0% Widowed6.1% DivorcedFemales 37.0% Never married43.0% Now married3.5% Separated1.1% Widowed15.4% DivorcedWomen who did not give birth in the past 12 months Now married:
45.5% (572)Unmarried:
54.5% (686)
Marital status - American Indian / Alaska Native population 15 years and over
Males 46.6% Never married42.6% Now married6.8% Separated0.0% Widowed4.1% DivorcedFemales 43.4% Never married46.9% Now married0.0% Separated2.8% Widowed7.0% DivorcedWomen who did not give birth in the past 12 months Now married:
51.9% (101)Unmarried:
48.1% (94)
Marital status - Asian population 15 years and over
Males 23.6% Never married69.4% Now married0.0% Separated0.5% Widowed6.5% DivorcedFemales 19.1% Never married66.3% Now married1.0% Separated9.7% Widowed4.0% DivorcedWomen who gave birth in the past 12 months Now married:
72.4% (165)Unmarried:
27.6% (63)
Women who did not give birth in the past 12 months Now married:
67.9% (3,715)Unmarried:
32.1% (1,754)
Marital status - Other race population 15 years and over
Males 43.3% Never married44.5% Now married1.8% Separated0.0% Widowed10.4% DivorcedFemales 33.2% Never married47.8% Now married4.2% Separated0.0% Widowed14.8% DivorcedWomen who gave birth in the past 12 months Now married:
25.9% (17)Unmarried:
74.1% (49)
Women who did not give birth in the past 12 months Now married:
52.8% (524)Unmarried:
47.2% (468)
Marital status - Two or more races population 15 years and over
Males 44.5% Never married45.3% Now married4.6% Separated0.0% Widowed5.6% DivorcedFemales 55.2% Never married38.2% Now married0.4% Separated1.4% Widowed4.9% DivorcedWomen who gave birth in the past 12 months Now married:
50.0% (25)Unmarried:
50.0% (25)
Women who did not give birth in the past 12 months Now married:
32.6% (775)Unmarried:
67.4% (1,605)
Marital status - White alone, not Hispanic / Latino population 15 years and over
Males 32.7% Never married56.9% Now married3.4% Separated3.2% Widowed3.8% DivorcedFemales 25.4% Never married47.0% Now married0.4% Separated10.3% Widowed16.8% DivorcedWomen who gave birth in the past 12 months Now married:
87.6% (340)Unmarried:
12.4% (48)
Women who did not give birth in the past 12 months Now married:
41.6% (3,126)Unmarried:
58.4% (4,382)
Marital status - Hispanic or Latino population 15 years and over
Males 43.6% Never married46.3% Now married3.1% Separated0.1% Widowed7.0% DivorcedFemales 46.3% Never married41.0% Now married2.4% Separated1.6% Widowed8.8% DivorcedWomen who gave birth in the past 12 months Now married:
100.0% (201)Unmarried:
0.0% (0)
Women who did not give birth in the past 12 months Now married:
27.5% (1,038)Unmarried:
72.5% (2,735)
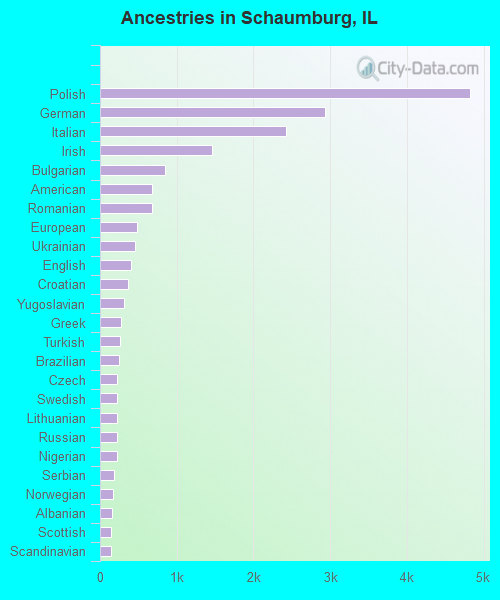
Ancestries in Schaumburg
4,828 11.2% Polish2,927 6.8% German2,423 5.6% Italian1,456 3.4% Irish842 2.0% Bulgarian681 1.6% American679 1.6% Romanian487 1.1% European456 1.1% Ukrainian408 0.9% English371 0.9% Croatian313 0.7% Yugoslavian273 0.6% Greek255 0.6% Turkish242 0.6% Brazilian224 0.5% Czech223 0.5% Swedish221 0.5% Lithuanian217 0.5% Russian216 0.5% Nigerian180 0.4% Serbian175 0.4% Norwegian162 0.4% Albanian146 0.3% Scottish141 0.3% Scandinavian122 0.3% Jamaican115 0.3% Macedonian99 0.2% Iranian99 0.2% Somali77 0.2% British71 0.2% Ethiopian71 0.2% Assyrian71 0.2% Portuguese64 0.1% Moroccan59 0.1% Dutch56 0.1% French56 0.1% Afghan54 0.1% African51 0.1% Armenian49 0.1% Austrian44 0.1% Eastern European38 0.09% Ugandan30 0.07% Palestinian28 0.06% Czechoslovakian26 0.06% Hungarian25 0.06% Slovak24 0.06% Iraqi21 0.05% Northern European21 0.05% Canadian21 0.05% Danish18 0.04% Scotch-Irish16 0.04% Welsh12 0.03% Jordanian10 0.02% Belgian10 0.02% Australian9 0.02% Arab6 0.01% Israeli5 0.01% Finnish5 0.01% Syrian4 0.01% Swiss
Geographical mobility in Schaumburg Same house 1 year ago 33,785 89.1% White (Caucasian)3,708 87.2% Black or African American587 80.6% American Indian / Alaska Native15,519 80.4% Asian6 60.6% Native Hawaiian / Pacific Islander3,203 80.0% Other race7,167 88.1% Two or more races36,435 89.4% White alone, not Hispanic / Latino7,808 87.4% Hispanic or LatinoMoved within same county 2,345 6.2% White / Caucasian269 6.3% Black or African American118 16.2% American Indian / Alaska Native1,844 9.6% Asian4 37.8% Native Hawaiian / Pacific Islander498 12.4% Other race504 6.2% Two or more races2,490 6.1% White alone, not Hispanic / Latino754 8.4% Hispanic or LatinoMoved within same state 685 1.8% White / Caucasian76 1.8% Black or African American528 2.7% Asian124 3.1% Other race93 1.1% Two or more races704 1.7% White alone, not Hispanic / Latino121 1.4% Hispanic or LatinoMoved from different state 735 1.9% White / Caucasian10 0.2% Black or African American24 3.3% American Indian / Alaska Native495 2.6% Asian75 1.9% Other race85 1.0% Two or more races754 1.9% White alone, not Hispanic / Latino102 1.1% Hispanic or LatinoMoved from abroad 291 0.8% White313 7.4% Black or African American13 1.8% American Indian / Alaska Native892 4.6% Asian80 2.0% Other race336 4.1% Two or more races299 0.7% White alone, not Hispanic / Latino179 2.0% Hispanic or Latino
Children Nativity (place of birth) in Schaumburg
Children under 6 years - Living with two parents Both parents native 1,247 100.0% NativeBoth parents foreign-born 2,006 82.4% Native428 17.6% Foreign-bornOne native, one foreign-born parent 430 100.0% NativeChildren under 6 years - Living with one parent Native parent 272 100.0% NativeForeign-born parent 93 100.0% NativeChildren 6 to 17 years - Living with two parents Both parents native 2,526 100.0% NativeBoth parents foreign-born 4,387 79.4% Native1,137 20.6% Foreign-bornOne native, one foreign-born parent 700 89.7% Native80 10.3% Foreign-bornChildren 6 to 17 years - Living with one parent Native parent 2,227 100.0% NativeForeign-born parent 2,488 50.0% Native2,488 50.0% Foreign-born
Place of birth for residents in Schaumburg 14,434 Asia9,079 South Central Asia5,795 Europe4,943 Eastern Europe3,257 Eastern Asia3,153 Americas3,019 Latin America2,168 Central America1,613 South Eastern Asia869 China787 Africa670 South America484 Western Asia387 Southern Europe307 Eastern Africa276 Southern Africa248 Western Europe215 Northern Europe179 Caribbean133 Northern America124 Western Africa40 Northern Africa38 Middle Africa31 Oceania31 Australia and New Zealand Subregion8,076 India2,432 Poland1,963 Mexico1,321 Philippines1,315 Korea962 Japan675 China611 Bulgaria578 Pakistan522 Ukraine326 Turkey304 Brazil266 South Africa265 Bosnia and Herzegovina230 Romania205 Germany202 Moldova189 Kazakhstan140 Russia133 Canada129 Vietnam128 Venezuela124 Nigeria123 Italy121 Albania112 Spain109 Honduras108 Peru107 Hong Kong98 Greece95 Jamaica86 Taiwan83 North Macedonia (Macedonia)82 Somalia80 Lithuania74 United Kingdom73 Guatemala72 Nepal69 England69 Uganda57 Colombia56 Cuba52 Cambodia51 Malaysia51 Iraq48 Serbia48 Portugal43 Afghanistan43 Iran39 Kenya34 Ethiopia31 Australia31 Argentina27 Syria26 Scotland26 Indonesia23 Armenia22 Belarus22 Nicaragua21 Czechoslovakia21 Uzbekistan21 Ireland21 Ecuador20 Bangladesh19 Belgium19 Morocco18 Chile18 Tanzania17 Dominican Republic17 Thailand16 Saudi Arabia13 France12 Israel11 Jordan11 Croatia10 Algeria9 Haiti9 Egypt8 Netherlands7 Laos7 Sweden6 Norway5 Singapore
Grandparents responsible for own grandchildren in Schaumburg
Grandparents (30 to 59 years) White / Caucasian 9 25.1% Responsible for grandchildren27 74.9% Not responsible for grandchildrenBlack or African American 66 36.2% Responsible for grandchildren116 63.8% Not responsible for grandchildrenAsian 13 22.6% Responsible for grandchildren44 77.4% Not responsible for grandchildrenOther race 115 100.0% Not responsible for grandchildrenWhite alone, not Hispanic / Latino 12 41.6% Responsible for grandchildren17 58.4% Not responsible for grandchildrenHispanic or Latino 105 100.0% Not responsible for grandchildrenGrandparents (60 years and over) White / Caucasian 22 7.3% Responsible for grandchildren279 92.7% Not responsible for grandchildrenBlack or African American 17 100.0% Not responsible for grandchildrenAsian 155 24.9% Responsible for grandchildren469 75.1% Not responsible for grandchildrenOther race 30 100.0% Not responsible for grandchildrenWhite alone, not Hispanic / Latino 27 6.9% Responsible for grandchildren358 93.1% Not responsible for grandchildrenHispanic or Latino 35 36.2% Responsible for grandchildren62 63.8% Not responsible for grandchildren