Races in Sayreville, New Jersey (NJ) Detailed Stats
Data:
Races - White alone (%)
Races - White alone (% change since 2000)
Races - Black alone (%)
Races - Black alone (% change since 2000)
Races - American Indian alone (%)
Races - American Indian alone (% change since 2000)
Races - Asian alone (%)
Races - Asian alone (% change since 2000)
Races - Hispanic (%)
Races - Hispanic (% change since 2000)
Races - Native Hawaiian and Other Pacific Islander alone (%)
Races - Native Hawaiian and Other Pacific Islander alone (% change since 2000)
Races - Two or more races(%)
Races - Two or more races(% change since 2000)
Races - Other race alone (%)
Races - Other race alone (% change since 2000)
Racial diversity
Place of birth - Born in state of residence (%)
Place of birth - Born in state of residence (%) - White
Place of birth - Born in state of residence (%) - Black or African American
Place of birth - Born in state of residence (%) - Asian
Place of birth - Born in state of residence (%) - Hispanic or Latino
Place of birth - Born in state of residence (%) - American Indian and Alaska Native
Place of birth - Born in state of residence (%) - Multirace
Place of birth - Born in state of residence (%) - Other Race
Place of birth - Born in other state (%)
Place of birth - Born in other state (%) - White
Place of birth - Born in other state (%) - Black or African American
Place of birth - Born in other state (%) - Asian
Place of birth - Born in other state (%) - Hispanic or Latino
Place of birth - Born in other state (%) - American Indian and Alaska Native
Place of birth - Born in other state (%) - Multirace
Place of birth - Born in other state (%) - Other Race
Place of birth - Native, outside of US (%)
Place of birth - Native, outside of US (%) - White
Place of birth - Native, outside of US (%) - Black or African American
Place of birth - Native, outside of US (%) - Asian
Place of birth - Native, outside of US (%) - Hispanic or Latino
Place of birth - Native, outside of US (%) - American Indian and Alaska Native
Place of birth - Native, outside of US (%) - Multirace
Place of birth - Native, outside of US (%) - Other Race
Place of birth - Foreign born (%)
Place of birth - Foreign born (%) - White
Place of birth - Foreign born (%) - Black or African American
Place of birth - Foreign born (%) - Asian
Place of birth - Foreign born (%) - Hispanic or Latino
Place of birth - Foreign born (%) - American Indian and Alaska Native
Place of birth - Foreign born (%) - Multirace
Place of birth - Foreign born (%) - Other Race
Residents speaking English at home (%)
Residents speaking English at home - Born in the United States (%)
Residents speaking English at home - Native, born elsewhere (%)
Residents speaking English at home - Foreign born (%)
Residents speaking Spanish at home (%)
Residents speaking Spanish at home - Born in the United States (%)
Residents speaking Spanish at home - Native, born elsewhere (%)
Residents speaking Spanish at home - Foreign born (%)
Residents speaking other language at home (%)
Residents speaking other language at home - Born in the United States (%)
Residents speaking other language at home - Native, born elsewhere (%)
Residents speaking other language at home - Foreign born (%)
Marital status - Never married (%)
Marital status - Now married (%)
Marital status - Separated (%)
Marital status - Widowed (%)
Marital status - Divorced (%)
Ancestries Reported - Arab (%)
Ancestries Reported - Czech (%)
Ancestries Reported - Danish (%)
Ancestries Reported - Dutch (%)
Ancestries Reported - English (%)
Ancestries Reported - French (%)
Ancestries Reported - French Canadian (%)
Ancestries Reported - German (%)
Ancestries Reported - Greek (%)
Ancestries Reported - Hungarian (%)
Ancestries Reported - Irish (%)
Ancestries Reported - Italian (%)
Ancestries Reported - Lithuanian (%)
Ancestries Reported - Norwegian (%)
Ancestries Reported - Polish (%)
Ancestries Reported - Portuguese (%)
Ancestries Reported - Russian (%)
Ancestries Reported - Scotch-Irish (%)
Ancestries Reported - Scottish (%)
Ancestries Reported - Slovak (%)
Ancestries Reported - Subsaharan African (%)
Ancestries Reported - Swedish (%)
Ancestries Reported - Swiss (%)
Ancestries Reported - Ukrainian (%)
Ancestries Reported - United States (%)
Ancestries Reported - Welsh (%)
Ancestries Reported - West Indian (%)
Ancestries Reported - Other (%)
Geographical mobility - Same house 1 year ago (%)
Geographical mobility - Same house 1 year ago (%) - White
Geographical mobility - Same house 1 year ago (%) - Black or African American
Geographical mobility - Same house 1 year ago (%) - Asian
Geographical mobility - Same house 1 year ago (%) - Hispanic or Latino
Geographical mobility - Same house 1 year ago (%) - American Indian and Alaska Native
Geographical mobility - Same house 1 year ago (%) - Multirace
Geographical mobility - Same house 1 year ago (%) - Other Race
Geographical mobility - Moved within same county (%)
Geographical mobility - Moved within same county (%) - White
Geographical mobility - Moved within same county (%) - Black or African American
Geographical mobility - Moved within same county (%) - Asian
Geographical mobility - Moved within same county (%) - Hispanic or Latino
Geographical mobility - Moved within same county (%) - American Indian and Alaska Native
Geographical mobility - Moved within same county (%) - Multirace
Geographical mobility - Moved within same county (%) - Other Race
Geographical mobility - Moved from different county within same state (%)
Geographical mobility - Moved from different county within same state (%) - White
Geographical mobility - Moved from different county within same state (%) - Black or African American
Geographical mobility - Moved from different county within same state (%) - Asian
Geographical mobility - Moved from different county within same state (%) - Hispanic or Latino
Geographical mobility - Moved from different county within same state (%) - American Indian and Alaska Native
Geographical mobility - Moved from different county within same state (%) - Multirace
Geographical mobility - Moved from different county within same state (%) - Other Race
Geographical mobility - Moved from different state (%)
Geographical mobility - Moved from different state (%) - White
Geographical mobility - Moved from different state (%) - Black or African American
Geographical mobility - Moved from different state (%) - Asian
Geographical mobility - Moved from different state (%) - Hispanic or Latino
Geographical mobility - Moved from different state (%) - American Indian and Alaska Native
Geographical mobility - Moved from different state (%) - Multirace
Geographical mobility - Moved from different state (%) - Other Race
Geographical mobility - Moved from abroad (%)
Geographical mobility - Moved from abroad (%) - White
Geographical mobility - Moved from abroad (%) - Black or African American
Geographical mobility - Moved from abroad (%) - Asian
Geographical mobility - Moved from abroad (%) - Hispanic or Latino
Geographical mobility - Moved from abroad (%) - American Indian and Alaska Native
Geographical mobility - Moved from abroad (%) - Multirace
Geographical mobility - Moved from abroad (%) - Other Race
Place of birth for the foreign-born population - Ireland (%)
Place of birth for the foreign-born population - Denmark (%)
Place of birth for the foreign-born population - Norway (%)
Place of birth for the foreign-born population - Sweden (%)
Place of birth for the foreign-born population - United Kingdom (%)
Place of birth for the foreign-born population - England (%)
Place of birth for the foreign-born population - Scotland (%)
Place of birth for the foreign-born population - Other Northern Europe (%)
Place of birth for the foreign-born population - Austria (%)
Place of birth for the foreign-born population - Belgium (%)
Place of birth for the foreign-born population - France (%)
Place of birth for the foreign-born population - Germany (%)
Place of birth for the foreign-born population - Netherlands (%)
Place of birth for the foreign-born population - Switzerland (%)
Place of birth for the foreign-born population - Other Western Europe (%)
Place of birth for the foreign-born population - Greece (%)
Place of birth for the foreign-born population - Italy (%)
Place of birth for the foreign-born population - Portugal (%)
Place of birth for the foreign-born population - Spain (%)
Place of birth for the foreign-born population - Other Southern Europe (%)
Place of birth for the foreign-born population - Albania (%)
Place of birth for the foreign-born population - Belarus (%)
Place of birth for the foreign-born population - Bosnia and Herzegovina (%)
Place of birth for the foreign-born population - Bulgaria (%)
Place of birth for the foreign-born population - Croatia (%)
Place of birth for the foreign-born population - Czechoslovakia (%)
Place of birth for the foreign-born population - Hungary (%)
Place of birth for the foreign-born population - Latvia (%)
Place of birth for the foreign-born population - Lithuania (%)
Place of birth for the foreign-born population - North Macedonia (Macedonia) (%)
Place of birth for the foreign-born population - Moldova (%)
Place of birth for the foreign-born population - Poland (%)
Place of birth for the foreign-born population - Romania (%)
Place of birth for the foreign-born population - Russia (%)
Place of birth for the foreign-born population - Serbia (%)
Place of birth for the foreign-born population - Ukraine (%)
Place of birth for the foreign-born population - Other Eastern Europe (%)
Place of birth for the foreign-born population - China (%)
Place of birth for the foreign-born population - Hong Kong (%)
Place of birth for the foreign-born population - Taiwan (%)
Place of birth for the foreign-born population - Japan (%)
Place of birth for the foreign-born population - Korea (%)
Place of birth for the foreign-born population - Other Eastern Asia (%)
Place of birth for the foreign-born population - Afghanistan (%)
Place of birth for the foreign-born population - Bangladesh (%)
Place of birth for the foreign-born population - India (%)
Place of birth for the foreign-born population - Iran (%)
Place of birth for the foreign-born population - Kazakhstan (%)
Place of birth for the foreign-born population - Nepal (%)
Place of birth for the foreign-born population - Pakistan (%)
Place of birth for the foreign-born population - Sri Lanka (%)
Place of birth for the foreign-born population - Uzbekistan (%)
Place of birth for the foreign-born population - Other South Central Asia (%)
Place of birth for the foreign-born population - Burma (%)
Place of birth for the foreign-born population - Cambodia (%)
Place of birth for the foreign-born population - Indonesia (%)
Place of birth for the foreign-born population - Laos (%)
Place of birth for the foreign-born population - Malaysia (%)
Place of birth for the foreign-born population - Philippines (%)
Place of birth for the foreign-born population - Singapore (%)
Place of birth for the foreign-born population - Thailand (%)
Place of birth for the foreign-born population - Vietnam (%)
Place of birth for the foreign-born population - Other South Eastern Asia (%)
Place of birth for the foreign-born population - Armenia (%)
Place of birth for the foreign-born population - Iraq (%)
Place of birth for the foreign-born population - Israel (%)
Place of birth for the foreign-born population - Jordan (%)
Place of birth for the foreign-born population - Kuwait (%)
Place of birth for the foreign-born population - Lebanon (%)
Place of birth for the foreign-born population - Saudi Arabia (%)
Place of birth for the foreign-born population - Syria (%)
Place of birth for the foreign-born population - Turkey (%)
Place of birth for the foreign-born population - Yemen (%)
Place of birth for the foreign-born population - Other Western Asia (%)
Place of birth for the foreign-born population - Eritrea (%)
Place of birth for the foreign-born population - Ethiopia (%)
Place of birth for the foreign-born population - Kenya (%)
Place of birth for the foreign-born population - Somalia (%)
Place of birth for the foreign-born population - Uganda (%)
Place of birth for the foreign-born population - Zimbabwe (%)
Place of birth for the foreign-born population - Other Eastern Africa (%)
Place of birth for the foreign-born population - Cameroon (%)
Place of birth for the foreign-born population - Congo (%)
Place of birth for the foreign-born population - Democratic Republic of Congo (Zaire) (%)
Place of birth for the foreign-born population - Other Middle Africa (%)
Place of birth for the foreign-born population - Egypt (%)
Place of birth for the foreign-born population - Morocco (%)
Place of birth for the foreign-born population - Sudan (%)
Place of birth for the foreign-born population - Other Northern Africa (%)
Place of birth for the foreign-born population - South Africa (%)
Place of birth for the foreign-born population - Other Southern Africa (%)
Place of birth for the foreign-born population - Cabo Verde (%)
Place of birth for the foreign-born population - Ghana (%)
Place of birth for the foreign-born population - Liberia (%)
Place of birth for the foreign-born population - Nigeria (%)
Place of birth for the foreign-born population - Senegal (%)
Place of birth for the foreign-born population - Sierra Leone (%)
Place of birth for the foreign-born population - Other Western Africa (%)
Place of birth for the foreign-born population - Australia (%)
Place of birth for the foreign-born population - New Zealand (%)
Place of birth for the foreign-born population - Fiji (%)
Place of birth for the foreign-born population - Micronesia (%)
Place of birth for the foreign-born population - Bahamas (%)
Place of birth for the foreign-born population - Barbados (%)
Place of birth for the foreign-born population - Cuba (%)
Place of birth for the foreign-born population - Dominica (%)
Place of birth for the foreign-born population - Dominican Republic (%)
Place of birth for the foreign-born population - Grenada (%)
Place of birth for the foreign-born population - Haiti (%)
Place of birth for the foreign-born population - Jamaica (%)
Place of birth for the foreign-born population - St. Vincent and the Grenadines (%)
Place of birth for the foreign-born population - Trinidad and Tobago (%)
Place of birth for the foreign-born population - West Indies (%)
Place of birth for the foreign-born population - Other Caribbean (%)
Place of birth for the foreign-born population - Belize (%)
Place of birth for the foreign-born population - Costa Rica (%)
Place of birth for the foreign-born population - El Salvador (%)
Place of birth for the foreign-born population - Guatemala (%)
Place of birth for the foreign-born population - Honduras (%)
Place of birth for the foreign-born population - Mexico (%)
Place of birth for the foreign-born population - Nicaragua (%)
Place of birth for the foreign-born population - Panama (%)
Place of birth for the foreign-born population - Other Central America (%)
Place of birth for the foreign-born population - Argentina (%)
Place of birth for the foreign-born population - Bolivia (%)
Place of birth for the foreign-born population - Brazil (%)
Place of birth for the foreign-born population - Chile (%)
Place of birth for the foreign-born population - Colombia (%)
Place of birth for the foreign-born population - Ecuador (%)
Place of birth for the foreign-born population - Guyana (%)
Place of birth for the foreign-born population - Peru (%)
Place of birth for the foreign-born population - Uruguay (%)
Place of birth for the foreign-born population - Venezuela (%)
Place of birth for the foreign-born population - Other South America (%)
Place of birth for the foreign-born population - Canada (%)
Place of birth for the foreign-born population - Other Northern America (%)
Place of birth for the foreign-born population - Other (%)
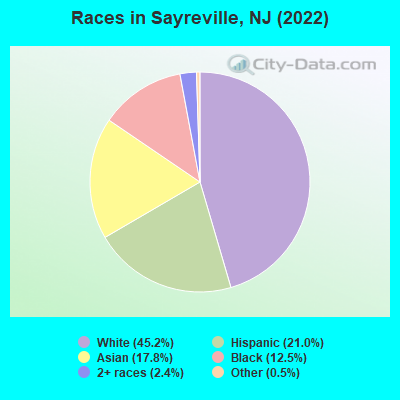
According to 2022 data, the most numerous races in Sayreville, NJ are White alone (20,409 residents), Hispanic (9,500 residents), and Black alone (5,651 residents). 60.1% of Sayreville residents speak English at home. 33.1% of Sayreville, NJ residents are foreign-born (13.1% born in Asia, 9.2% born in Latin America, 5.2% born in Europe, 5.1% born in Africa), which is 30.6% greater than the foreign-born rate of 23.0% across the entire state of New Jersey.
Race distribution in Sayreville
2000 2022
5,557,209 66.0% White alone 1,117,191 13.3% Hispanic 1,096,171 13.0% Black alone 477,012 5.7% Asian alone 133,689 1.6% Two or more races 19,565 0.2% Other race alone 11,338 0.1% American Indian alone 2,175 0.03% Native Hawaiian and Other
4,766,476 51.5% White alone 2,028,470 21.9% Hispanic 1,111,632 12.0% Black alone 923,546 10.0% Asian alone 332,237 3.6% Two or more races 89,847 1.0% Other race alone 8,557 0.09% American Indian alone 934 0.01% Native Hawaiian and Other
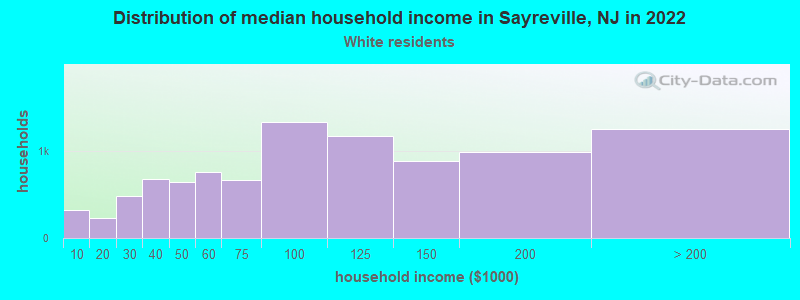
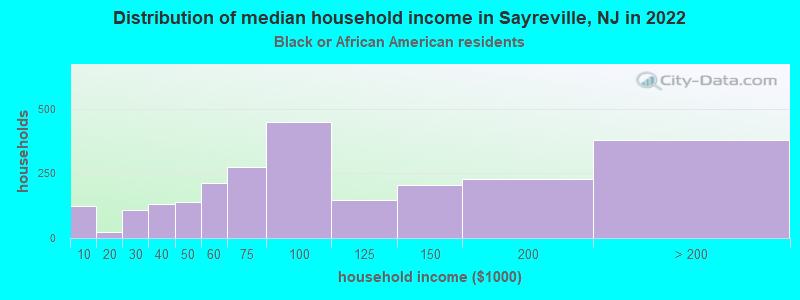
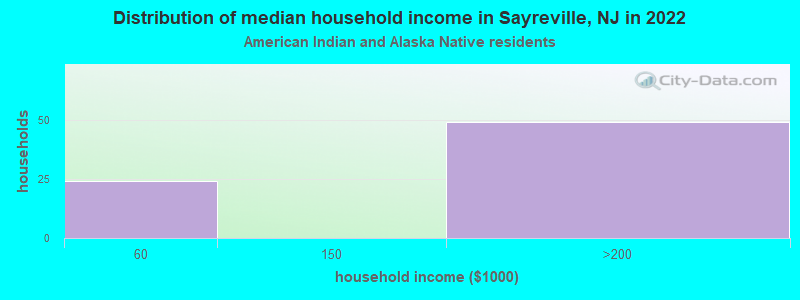
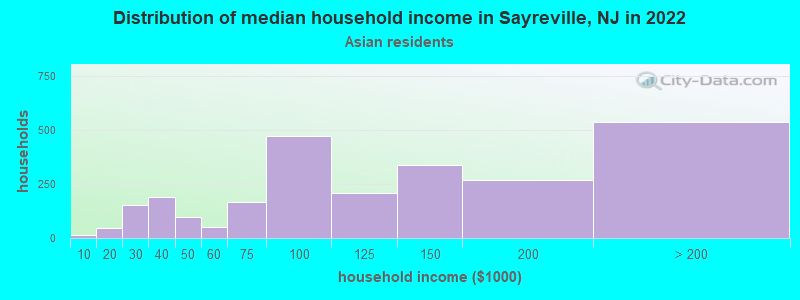
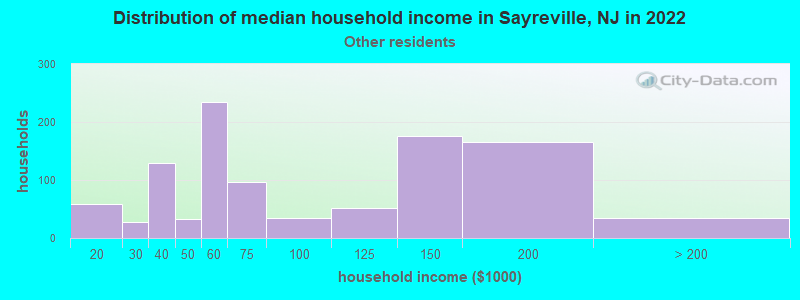
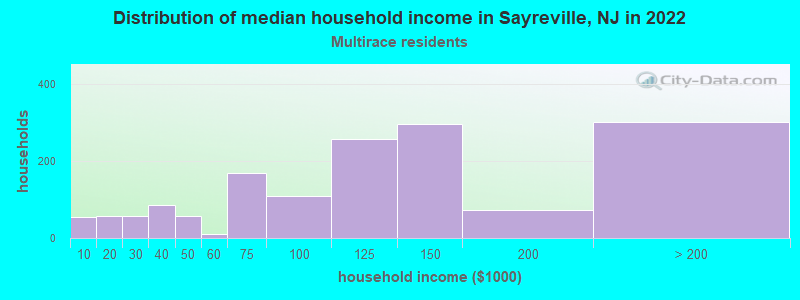
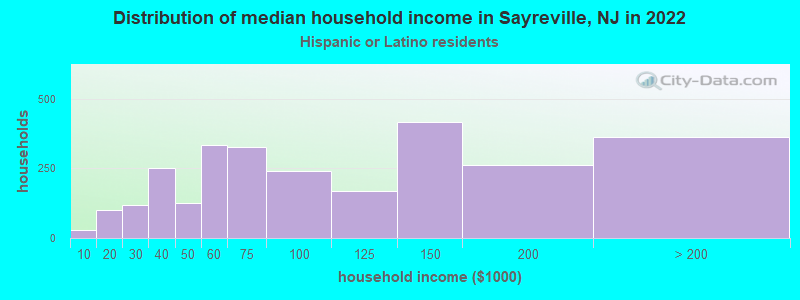
Income and house value in Sayreville Median household income in 2022 $91,925 White non-Hispanic householders$81,052 Black householders$143,476 American Indian and Alaska Native householders$108,085 Asian householders$93,341 Some other race householders$106,441 Two or more races householders$84,675 Hispanic or Latino race householdersMedian 2022 house value $401,507 White Non-Hispanic householders$445,442 Black or African American householders$390,391 American Indian or Alaska Native householders $476,674 Asian householders$381,392 Some other race householders$380,862 Two or more races householders$391,449 Hispanic or Latino householders
Median age by race in Sayreville
47.1 Median age for White residents47.0 46.5 35.4 Median age for Black or African American residents36.4 34.2 50.1 Median age for American Indian / Alaska Native residents38.8 60.1 36.0 Median age for Asian residents34.3 37.8 -939,393,938.5 Median age for Native Hawaiian / Pacific Islander residents-860,335,194.7 -713,070,378.3 33.1 Median age for Other race residents30.0 36.6 35.8 Median age for Two or more races residents37.6 33.8 48.9 Median age for White alone residents48.7 50.0 31.2 Median age for Hispanic or Latino residents32.4 30.4
Owner/renter occupied households by race in Sayreville
House owners and renters - White residents 6,932 73.8% Owner occupied2,466 26.2% Renter occupiedHouse owners and renters - Black or African American residents 756 30.7% Owner occupied1,703 69.3% Renter occupiedHouse owners and renters - American Indian / Alaska Native residents 81 100.0% Owner occupiedHouse owners and renters - Asian residents 1,692 68.2% Owner occupied789 31.8% Renter occupiedHouse owners and renters - Other race residents 420 43.4% Owner occupied548 56.6% Renter occupiedHouse owners and renters - Two or more races residents 1,162 76.0% Owner occupied366 24.0% Renter occupiedHouse owners and renters - White alone residents 6,835 73.9% Owner occupied2,412 26.1% Renter occupiedHouse owners and renters - Hispanic or Latino residents 1,463 54.4% Owner occupied1,225 45.6% Renter occupied
Language usage in Sayreville
English speakers - Total 60.1% of residents of Sayreville speak English at home.
11.8% of residents speak Spanish at home 3,224 63.8% Speak English very well1,826 36.2% Speak English less than very well27.8% of residents speak other language at home 7,280 61.3% Speak English very well4,588 38.7% Speak English less than very well
English speakers - Born in the United States 83.4% of residents of Sayreville speak English at home.
10.3% of residents speak Spanish at home 786 90.9% Speak English very well79 9.1% Speak English less than very well6.0% of residents speak other language at home 457 90.1% Speak English very well50 9.9% Speak English less than very well
English speakers - Native, born elsewhere 35.8% of residents of Sayreville speak English at home.
50.7% of residents speak Spanish at home 255 57.0% Speak English very well192 43.0% Speak English less than very well14.4% of residents speak other language at home 119 93.7% Speak English very well8 6.3% Speak English less than very well
English speakers - Foreign-born 19.5% of residents of Sayreville speak English at home.
17.5% of residents speak Spanish at home 1,282 48.0% Speak English very well1,389 52.0% Speak English less than very well62.5% of residents speak other language at home 5,113 53.4% Speak English very well4,455 46.6% Speak English less than very well
White (Caucasian) - Speak only English Native:
93.1% (16,368)Foreign-born:
9.6% (306)
White (Caucasian) - Speak another language Native:
7.4% (1,304)Foreign-born:
86.6% (2,761)
Black or African American - Speak only English Native:
93.7% (2,799)Foreign-born:
55.3% (1,677)
Black or African American - Speak another language Native:
6.4% (192)Foreign-born:
38.4% (1,163)
American Indian / Alaska Native - Speak another language Native:
55.1% (50)Foreign-born:
97.6% (107)
Asian - Speak only English Native:
41.0% (745)Foreign-born:
10.0% (571)
Asian - Speak another language Native:
59.1% (1,073)Foreign-born:
90.2% (5,161)
Other race - Speak only English Native:
69.3% (1,111)Foreign-born:
9.4% (100)
Other race - Speak another language Native:
40.4% (647)Foreign-born:
91.2% (972)
Two or more races - Speak only English Native:
62.2% (1,651)Foreign-born:
10.0% (154)
Two or more races - Speak another language Native:
37.7% (1,000)Foreign-born:
90.1% (1,383)
White alone - Speak only English Native:
96.0% (15,593)Foreign-born:
9.2% (328)
White alone - Speak another language Native:
4.4% (712)Foreign-born:
89.6% (3,207)
Hispanic or Latino - Speak only English Native:
54.7% (2,958)Foreign-born:
7.6% (233)
Hispanic or Latino - Speak another language Native:
47.1% (2,546)Foreign-born:
92.5% (2,832)
Foreign-born residents in Sayreville 14,983 residents are foreign born (13.1% Asia , 9.2% Latin America , 5.2% Europe , 5.1% Africa ).
This city:
33.1%New Jersey:
23.2%
Marital status for residents in Sayreville Marital status - White (Caucasian) population 15 years and over
Males 34.4% Never married50.8% Now married1.0% Separated3.7% Widowed10.0% DivorcedFemales 30.5% Never married48.9% Now married0.9% Separated9.2% Widowed10.5% DivorcedWomen who gave birth in the past 12 months Now married:
81.2% (78)Unmarried:
18.8% (18)
Women who did not give birth in the past 12 months Now married:
41.0% (1,733)Unmarried:
59.0% (2,494)
Marital status - Black or African American population 15 years and over
Males 40.0% Never married50.6% Now married2.3% Separated0.0% Widowed7.1% DivorcedFemales 39.9% Never married44.9% Now married5.9% Separated2.4% Widowed6.9% DivorcedWomen who gave birth in the past 12 months Now married:
100.0% (103)Unmarried:
0.0% (0)
Women who did not give birth in the past 12 months Now married:
45.5% (719)Unmarried:
54.5% (861)
Marital status - American Indian / Alaska Native population 15 years and over
Males 24.5% Never married75.5% Now married0.0% Separated0.0% Widowed0.0% DivorcedFemales 0.0% Never married81.8% Now married0.0% Separated0.0% Widowed18.2% DivorcedWomen who did not give birth in the past 12 months Now married:
100.0% (19)Unmarried:
0.0% (0)
Marital status - Asian population 15 years and over
Males 33.4% Never married61.4% Now married1.2% Separated0.5% Widowed3.5% DivorcedFemales 22.2% Never married65.8% Now married1.4% Separated7.4% Widowed3.2% DivorcedWomen who gave birth in the past 12 months Now married:
100.0% (121)Unmarried:
0.0% (0)
Women who did not give birth in the past 12 months Now married:
65.6% (1,283)Unmarried:
34.4% (673)
Marital status - Other race population 15 years and over
Males 45.3% Never married36.0% Now married5.7% Separated0.0% Widowed13.0% DivorcedFemales 41.4% Never married42.8% Now married1.2% Separated1.7% Widowed12.8% DivorcedWomen who gave birth in the past 12 months Now married:
93.3% (39)Unmarried:
6.7% (3)
Women who did not give birth in the past 12 months Now married:
34.2% (184)Unmarried:
65.8% (355)
Marital status - Two or more races population 15 years and over
Males 36.2% Never married55.6% Now married0.0% Separated0.0% Widowed8.2% DivorcedFemales 25.7% Never married53.5% Now married2.2% Separated0.6% Widowed18.0% DivorcedWomen who gave birth in the past 12 months Now married:
100.0% (211)Unmarried:
0.0% (0)
Women who did not give birth in the past 12 months Now married:
43.4% (513)Unmarried:
56.6% (669)
Marital status - White alone, not Hispanic / Latino population 15 years and over
Males 35.3% Never married49.6% Now married1.0% Separated4.1% Widowed10.0% DivorcedFemales 27.2% Never married50.1% Now married1.1% Separated10.6% Widowed11.0% DivorcedWomen who gave birth in the past 12 months Now married:
81.2% (91)Unmarried:
18.8% (21)
Women who did not give birth in the past 12 months Now married:
43.8% (1,675)Unmarried:
56.2% (2,147)
Marital status - Hispanic or Latino population 15 years and over
Males 34.8% Never married54.6% Now married2.3% Separated0.0% Widowed8.3% DivorcedFemales 42.5% Never married44.4% Now married1.4% Separated1.5% Widowed10.2% DivorcedWomen who gave birth in the past 12 months Now married:
98.9% (197)Unmarried:
1.1% (2)
Women who did not give birth in the past 12 months Now married:
30.7% (746)Unmarried:
69.3% (1,684)
Ancestries in Sayreville
2,456 9.1% Polish1,932 7.1% Italian1,499 5.5% Irish808 3.0% Egyptian663 2.4% American645 2.4% African528 1.9% Portuguese500 1.8% European471 1.7% German443 1.6% Ghanaian408 1.5% Brazilian237 0.9% English231 0.9% West Indian214 0.8% Russian190 0.7% Trinidadian and Tobagonian190 0.7% Nigerian189 0.7% Jamaican151 0.6% Greek150 0.6% Haitian136 0.5% Hungarian132 0.5% Ukrainian126 0.5% Slovak115 0.4% Eastern European95 0.4% Moroccan63 0.2% Guyanese62 0.2% Kenyan34 0.1% Lebanese31 0.1% Arab30 0.1% Palestinian29 0.1% Jordanian28 0.1% Dutch23 0.08% Lithuanian21 0.08% Scotch-Irish19 0.07% French19 0.07% British West Indian16 0.06% Czechoslovakian15 0.06% Barbadian15 0.06% Czech14 0.05% Maltese14 0.05% Estonian12 0.04% Belgian12 0.04% Croatian12 0.04% Slavic11 0.04% Norwegian10 0.04% Scottish8 0.03% Turkish6 0.02% Welsh4 0.01% Finnish4 0.01% Danish
Geographical mobility in Sayreville Same house 1 year ago 19,940 92.7% White (Caucasian)5,883 95.3% Black or African American192 96.6% American Indian / Alaska Native7,357 92.3% Asian28 100.0% Native Hawaiian / Pacific Islander2,709 89.2% Other race4,364 96.6% Two or more races18,870 93.0% White alone, not Hispanic / Latino8,502 90.6% Hispanic or LatinoMoved within same county 887 4.1% White / Caucasian153 2.5% Black or African American492 6.2% Asian123 4.1% Other race133 2.9% Two or more races763 3.8% White alone, not Hispanic / Latino463 4.9% Hispanic or LatinoMoved within same state 340 1.6% White / Caucasian105 1.7% Black or African American28 0.3% Asian49 1.6% Other race361 1.8% White alone, not Hispanic / Latino52 0.6% Hispanic or LatinoMoved from different state 313 1.5% White / Caucasian19 0.3% Black or African American107 1.3% Asian126 4.2% Other race27 0.6% Two or more races246 1.2% White alone, not Hispanic / Latino299 3.2% Hispanic or LatinoMoved from abroad 32 0.1% White69 0.9% Asian21 0.7% Other race45 1.0% Two or more races33 0.2% White alone, not Hispanic / Latino76 0.8% Hispanic or Latino
Children Nativity (place of birth) in Sayreville
Children under 6 years - Living with two parents Both parents native 979 100.0% NativeBoth parents foreign-born 1,066 89.3% Native128 10.7% Foreign-bornOne native, one foreign-born parent 149 100.0% NativeChildren under 6 years - Living with one parent Native parent 288 100.0% NativeForeign-born parent 375 100.0% NativeChildren 6 to 17 years - Living with two parents Both parents native 1,683 100.0% NativeBoth parents foreign-born 2,076 80.2% Native511 19.8% Foreign-bornOne native, one foreign-born parent 737 100.0% NativeChildren 6 to 17 years - Living with one parent Native parent 1,022 100.0% NativeForeign-born parent 301 53.5% Native261 46.5% Foreign-born
Place of birth for residents in Sayreville 6,005 Asia4,559 South Central Asia4,235 Americas4,206 Latin America2,403 Europe2,338 Africa2,163 Caribbean1,534 Eastern Europe1,354 South America929 Western Africa826 Northern Africa732 South Eastern Asia688 Central America640 Southern Europe518 Eastern Africa448 Eastern Asia260 China221 Western Asia145 Northern Europe56 Western Europe29 Northern America15 Southern Africa3,531 India1,198 Dominican Republic1,101 Poland727 Egypt642 Philippines575 Pakistan466 Kenya453 Portugal418 Ghana417 Brazil321 Honduras319 Dominica248 Venezuela236 Jamaica205 China201 Nigeria193 Nepal185 Bangladesh183 Guyana176 Ukraine171 Trinidad and Tobago158 Korea147 Peru145 Argentina125 Costa Rica120 Colombia120 Italy118 Togo108 Mexico99 Haiti97 Sierra Leone92 Liberia85 England77 Czechoslovakia70 Jordan61 Morocco58 Greece55 Russia54 Hungary53 Vietnam51 El Salvador49 Cuba44 Uganda40 Hong Kong39 Sri Lanka36 Nicaragua35 United Kingdom35 Uzbekistan34 Kuwait34 Germany33 Syria32 Saudi Arabia30 Ecuador29 Malaysia29 Japan29 Canada28 Bahamas24 Ireland24 Panama22 France22 Lebanon21 West Indies20 Guatemala20 Moldova19 Sudan18 Algeria18 Israel17 Uruguay16 Romania15 South Africa15 Chile15 Belarus14 Taiwan11 Barbados10 Grenada7 Zimbabwe7 Yemen6 Singapore4 Bolivia3 Turkey
Grandparents responsible for own grandchildren in Sayreville
Grandparents (30 to 59 years) White / Caucasian 25 100.0% Not responsible for grandchildrenBlack or African American 29 100.0% Not responsible for grandchildrenAsian 53 100.0% Not responsible for grandchildrenOther race 13 100.0% Not responsible for grandchildrenTwo or more races 163 100.0% Not responsible for grandchildrenWhite alone, not Hispanic / Latino 30 100.0% Not responsible for grandchildrenHispanic or Latino 183 100.0% Not responsible for grandchildrenGrandparents (60 years and over) White / Caucasian 18 4.6% Responsible for grandchildren369 95.4% Not responsible for grandchildrenBlack or African American 23 100.0% Not responsible for grandchildrenAsian 12 6.9% Responsible for grandchildren164 93.1% Not responsible for grandchildrenOther race 28 100.0% Not responsible for grandchildrenTwo or more races 19 9.7% Responsible for grandchildren173 90.3% Not responsible for grandchildrenWhite alone, not Hispanic / Latino 24 5.6% Responsible for grandchildren399 94.4% Not responsible for grandchildrenHispanic or Latino 6 3.3% Responsible for grandchildren190 96.7% Not responsible for grandchildren