Races in Savannah, Georgia (GA) Detailed Stats
Data:
Races - White alone (%)
Races - White alone (% change since 2000)
Races - Black alone (%)
Races - Black alone (% change since 2000)
Races - American Indian alone (%)
Races - American Indian alone (% change since 2000)
Races - Asian alone (%)
Races - Asian alone (% change since 2000)
Races - Hispanic (%)
Races - Hispanic (% change since 2000)
Races - Native Hawaiian and Other Pacific Islander alone (%)
Races - Native Hawaiian and Other Pacific Islander alone (% change since 2000)
Races - Two or more races(%)
Races - Two or more races(% change since 2000)
Races - Other race alone (%)
Races - Other race alone (% change since 2000)
Racial diversity
Place of birth - Born in state of residence (%)
Place of birth - Born in state of residence (%) - White
Place of birth - Born in state of residence (%) - Black or African American
Place of birth - Born in state of residence (%) - Asian
Place of birth - Born in state of residence (%) - Hispanic or Latino
Place of birth - Born in state of residence (%) - American Indian and Alaska Native
Place of birth - Born in state of residence (%) - Multirace
Place of birth - Born in state of residence (%) - Other Race
Place of birth - Born in other state (%)
Place of birth - Born in other state (%) - White
Place of birth - Born in other state (%) - Black or African American
Place of birth - Born in other state (%) - Asian
Place of birth - Born in other state (%) - Hispanic or Latino
Place of birth - Born in other state (%) - American Indian and Alaska Native
Place of birth - Born in other state (%) - Multirace
Place of birth - Born in other state (%) - Other Race
Place of birth - Native, outside of US (%)
Place of birth - Native, outside of US (%) - White
Place of birth - Native, outside of US (%) - Black or African American
Place of birth - Native, outside of US (%) - Asian
Place of birth - Native, outside of US (%) - Hispanic or Latino
Place of birth - Native, outside of US (%) - American Indian and Alaska Native
Place of birth - Native, outside of US (%) - Multirace
Place of birth - Native, outside of US (%) - Other Race
Place of birth - Foreign born (%)
Place of birth - Foreign born (%) - White
Place of birth - Foreign born (%) - Black or African American
Place of birth - Foreign born (%) - Asian
Place of birth - Foreign born (%) - Hispanic or Latino
Place of birth - Foreign born (%) - American Indian and Alaska Native
Place of birth - Foreign born (%) - Multirace
Place of birth - Foreign born (%) - Other Race
Residents speaking English at home (%)
Residents speaking English at home - Born in the United States (%)
Residents speaking English at home - Native, born elsewhere (%)
Residents speaking English at home - Foreign born (%)
Residents speaking Spanish at home (%)
Residents speaking Spanish at home - Born in the United States (%)
Residents speaking Spanish at home - Native, born elsewhere (%)
Residents speaking Spanish at home - Foreign born (%)
Residents speaking other language at home (%)
Residents speaking other language at home - Born in the United States (%)
Residents speaking other language at home - Native, born elsewhere (%)
Residents speaking other language at home - Foreign born (%)
Marital status - Never married (%)
Marital status - Now married (%)
Marital status - Separated (%)
Marital status - Widowed (%)
Marital status - Divorced (%)
Ancestries Reported - Arab (%)
Ancestries Reported - Czech (%)
Ancestries Reported - Danish (%)
Ancestries Reported - Dutch (%)
Ancestries Reported - English (%)
Ancestries Reported - French (%)
Ancestries Reported - French Canadian (%)
Ancestries Reported - German (%)
Ancestries Reported - Greek (%)
Ancestries Reported - Hungarian (%)
Ancestries Reported - Irish (%)
Ancestries Reported - Italian (%)
Ancestries Reported - Lithuanian (%)
Ancestries Reported - Norwegian (%)
Ancestries Reported - Polish (%)
Ancestries Reported - Portuguese (%)
Ancestries Reported - Russian (%)
Ancestries Reported - Scotch-Irish (%)
Ancestries Reported - Scottish (%)
Ancestries Reported - Slovak (%)
Ancestries Reported - Subsaharan African (%)
Ancestries Reported - Swedish (%)
Ancestries Reported - Swiss (%)
Ancestries Reported - Ukrainian (%)
Ancestries Reported - United States (%)
Ancestries Reported - Welsh (%)
Ancestries Reported - West Indian (%)
Ancestries Reported - Other (%)
Geographical mobility - Same house 1 year ago (%)
Geographical mobility - Same house 1 year ago (%) - White
Geographical mobility - Same house 1 year ago (%) - Black or African American
Geographical mobility - Same house 1 year ago (%) - Asian
Geographical mobility - Same house 1 year ago (%) - Hispanic or Latino
Geographical mobility - Same house 1 year ago (%) - American Indian and Alaska Native
Geographical mobility - Same house 1 year ago (%) - Multirace
Geographical mobility - Same house 1 year ago (%) - Other Race
Geographical mobility - Moved within same county (%)
Geographical mobility - Moved within same county (%) - White
Geographical mobility - Moved within same county (%) - Black or African American
Geographical mobility - Moved within same county (%) - Asian
Geographical mobility - Moved within same county (%) - Hispanic or Latino
Geographical mobility - Moved within same county (%) - American Indian and Alaska Native
Geographical mobility - Moved within same county (%) - Multirace
Geographical mobility - Moved within same county (%) - Other Race
Geographical mobility - Moved from different county within same state (%)
Geographical mobility - Moved from different county within same state (%) - White
Geographical mobility - Moved from different county within same state (%) - Black or African American
Geographical mobility - Moved from different county within same state (%) - Asian
Geographical mobility - Moved from different county within same state (%) - Hispanic or Latino
Geographical mobility - Moved from different county within same state (%) - American Indian and Alaska Native
Geographical mobility - Moved from different county within same state (%) - Multirace
Geographical mobility - Moved from different county within same state (%) - Other Race
Geographical mobility - Moved from different state (%)
Geographical mobility - Moved from different state (%) - White
Geographical mobility - Moved from different state (%) - Black or African American
Geographical mobility - Moved from different state (%) - Asian
Geographical mobility - Moved from different state (%) - Hispanic or Latino
Geographical mobility - Moved from different state (%) - American Indian and Alaska Native
Geographical mobility - Moved from different state (%) - Multirace
Geographical mobility - Moved from different state (%) - Other Race
Geographical mobility - Moved from abroad (%)
Geographical mobility - Moved from abroad (%) - White
Geographical mobility - Moved from abroad (%) - Black or African American
Geographical mobility - Moved from abroad (%) - Asian
Geographical mobility - Moved from abroad (%) - Hispanic or Latino
Geographical mobility - Moved from abroad (%) - American Indian and Alaska Native
Geographical mobility - Moved from abroad (%) - Multirace
Geographical mobility - Moved from abroad (%) - Other Race
Place of birth for the foreign-born population - Ireland (%)
Place of birth for the foreign-born population - Denmark (%)
Place of birth for the foreign-born population - Norway (%)
Place of birth for the foreign-born population - Sweden (%)
Place of birth for the foreign-born population - United Kingdom (%)
Place of birth for the foreign-born population - England (%)
Place of birth for the foreign-born population - Scotland (%)
Place of birth for the foreign-born population - Other Northern Europe (%)
Place of birth for the foreign-born population - Austria (%)
Place of birth for the foreign-born population - Belgium (%)
Place of birth for the foreign-born population - France (%)
Place of birth for the foreign-born population - Germany (%)
Place of birth for the foreign-born population - Netherlands (%)
Place of birth for the foreign-born population - Switzerland (%)
Place of birth for the foreign-born population - Other Western Europe (%)
Place of birth for the foreign-born population - Greece (%)
Place of birth for the foreign-born population - Italy (%)
Place of birth for the foreign-born population - Portugal (%)
Place of birth for the foreign-born population - Spain (%)
Place of birth for the foreign-born population - Other Southern Europe (%)
Place of birth for the foreign-born population - Albania (%)
Place of birth for the foreign-born population - Belarus (%)
Place of birth for the foreign-born population - Bosnia and Herzegovina (%)
Place of birth for the foreign-born population - Bulgaria (%)
Place of birth for the foreign-born population - Croatia (%)
Place of birth for the foreign-born population - Czechoslovakia (%)
Place of birth for the foreign-born population - Hungary (%)
Place of birth for the foreign-born population - Latvia (%)
Place of birth for the foreign-born population - Lithuania (%)
Place of birth for the foreign-born population - North Macedonia (Macedonia) (%)
Place of birth for the foreign-born population - Moldova (%)
Place of birth for the foreign-born population - Poland (%)
Place of birth for the foreign-born population - Romania (%)
Place of birth for the foreign-born population - Russia (%)
Place of birth for the foreign-born population - Serbia (%)
Place of birth for the foreign-born population - Ukraine (%)
Place of birth for the foreign-born population - Other Eastern Europe (%)
Place of birth for the foreign-born population - China (%)
Place of birth for the foreign-born population - Hong Kong (%)
Place of birth for the foreign-born population - Taiwan (%)
Place of birth for the foreign-born population - Japan (%)
Place of birth for the foreign-born population - Korea (%)
Place of birth for the foreign-born population - Other Eastern Asia (%)
Place of birth for the foreign-born population - Afghanistan (%)
Place of birth for the foreign-born population - Bangladesh (%)
Place of birth for the foreign-born population - India (%)
Place of birth for the foreign-born population - Iran (%)
Place of birth for the foreign-born population - Kazakhstan (%)
Place of birth for the foreign-born population - Nepal (%)
Place of birth for the foreign-born population - Pakistan (%)
Place of birth for the foreign-born population - Sri Lanka (%)
Place of birth for the foreign-born population - Uzbekistan (%)
Place of birth for the foreign-born population - Other South Central Asia (%)
Place of birth for the foreign-born population - Burma (%)
Place of birth for the foreign-born population - Cambodia (%)
Place of birth for the foreign-born population - Indonesia (%)
Place of birth for the foreign-born population - Laos (%)
Place of birth for the foreign-born population - Malaysia (%)
Place of birth for the foreign-born population - Philippines (%)
Place of birth for the foreign-born population - Singapore (%)
Place of birth for the foreign-born population - Thailand (%)
Place of birth for the foreign-born population - Vietnam (%)
Place of birth for the foreign-born population - Other South Eastern Asia (%)
Place of birth for the foreign-born population - Armenia (%)
Place of birth for the foreign-born population - Iraq (%)
Place of birth for the foreign-born population - Israel (%)
Place of birth for the foreign-born population - Jordan (%)
Place of birth for the foreign-born population - Kuwait (%)
Place of birth for the foreign-born population - Lebanon (%)
Place of birth for the foreign-born population - Saudi Arabia (%)
Place of birth for the foreign-born population - Syria (%)
Place of birth for the foreign-born population - Turkey (%)
Place of birth for the foreign-born population - Yemen (%)
Place of birth for the foreign-born population - Other Western Asia (%)
Place of birth for the foreign-born population - Eritrea (%)
Place of birth for the foreign-born population - Ethiopia (%)
Place of birth for the foreign-born population - Kenya (%)
Place of birth for the foreign-born population - Somalia (%)
Place of birth for the foreign-born population - Uganda (%)
Place of birth for the foreign-born population - Zimbabwe (%)
Place of birth for the foreign-born population - Other Eastern Africa (%)
Place of birth for the foreign-born population - Cameroon (%)
Place of birth for the foreign-born population - Congo (%)
Place of birth for the foreign-born population - Democratic Republic of Congo (Zaire) (%)
Place of birth for the foreign-born population - Other Middle Africa (%)
Place of birth for the foreign-born population - Egypt (%)
Place of birth for the foreign-born population - Morocco (%)
Place of birth for the foreign-born population - Sudan (%)
Place of birth for the foreign-born population - Other Northern Africa (%)
Place of birth for the foreign-born population - South Africa (%)
Place of birth for the foreign-born population - Other Southern Africa (%)
Place of birth for the foreign-born population - Cabo Verde (%)
Place of birth for the foreign-born population - Ghana (%)
Place of birth for the foreign-born population - Liberia (%)
Place of birth for the foreign-born population - Nigeria (%)
Place of birth for the foreign-born population - Senegal (%)
Place of birth for the foreign-born population - Sierra Leone (%)
Place of birth for the foreign-born population - Other Western Africa (%)
Place of birth for the foreign-born population - Australia (%)
Place of birth for the foreign-born population - New Zealand (%)
Place of birth for the foreign-born population - Fiji (%)
Place of birth for the foreign-born population - Micronesia (%)
Place of birth for the foreign-born population - Bahamas (%)
Place of birth for the foreign-born population - Barbados (%)
Place of birth for the foreign-born population - Cuba (%)
Place of birth for the foreign-born population - Dominica (%)
Place of birth for the foreign-born population - Dominican Republic (%)
Place of birth for the foreign-born population - Grenada (%)
Place of birth for the foreign-born population - Haiti (%)
Place of birth for the foreign-born population - Jamaica (%)
Place of birth for the foreign-born population - St. Vincent and the Grenadines (%)
Place of birth for the foreign-born population - Trinidad and Tobago (%)
Place of birth for the foreign-born population - West Indies (%)
Place of birth for the foreign-born population - Other Caribbean (%)
Place of birth for the foreign-born population - Belize (%)
Place of birth for the foreign-born population - Costa Rica (%)
Place of birth for the foreign-born population - El Salvador (%)
Place of birth for the foreign-born population - Guatemala (%)
Place of birth for the foreign-born population - Honduras (%)
Place of birth for the foreign-born population - Mexico (%)
Place of birth for the foreign-born population - Nicaragua (%)
Place of birth for the foreign-born population - Panama (%)
Place of birth for the foreign-born population - Other Central America (%)
Place of birth for the foreign-born population - Argentina (%)
Place of birth for the foreign-born population - Bolivia (%)
Place of birth for the foreign-born population - Brazil (%)
Place of birth for the foreign-born population - Chile (%)
Place of birth for the foreign-born population - Colombia (%)
Place of birth for the foreign-born population - Ecuador (%)
Place of birth for the foreign-born population - Guyana (%)
Place of birth for the foreign-born population - Peru (%)
Place of birth for the foreign-born population - Uruguay (%)
Place of birth for the foreign-born population - Venezuela (%)
Place of birth for the foreign-born population - Other South America (%)
Place of birth for the foreign-born population - Canada (%)
Place of birth for the foreign-born population - Other Northern America (%)
Place of birth for the foreign-born population - Other (%)
Latest news about races in Savannah, GA collected exclusively by city-data.com from local newspapers, TV, and radio stations
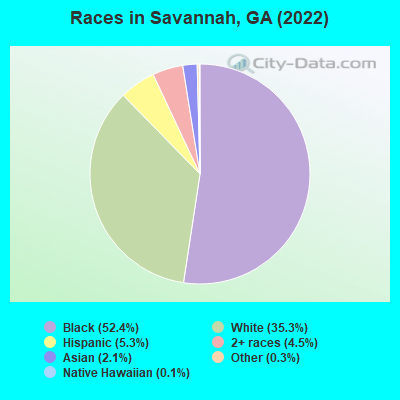
According to 2022 data, the most numerous races in Savannah, GA are White alone (52,187 residents), Black alone (77,527 residents), and Hispanic (7,889 residents). 93.4% of Savannah residents speak English at home. 6.4% of Savannah, GA residents are foreign-born (2.5% born in Asia, 2.4% born in Latin America, 0.7% born in Europe), which is 56.9% less than the foreign-born rate of 10.0% across the entire state of Georgia.
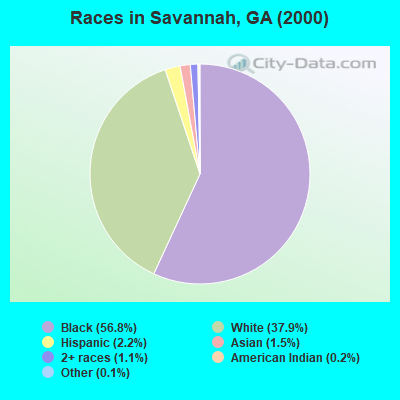
Race distribution in Savannah
2000 2022
74,691 56.8% Black alone 49,903 37.9% White alone 2,938 2.2% Hispanic 1,984 1.5% Asian alone 1,451 1.1% Two or more races 277 0.2% American Indian alone 188 0.1% Other race alone 78 0.06% Native Hawaiian and Other
77,527 52.4% Black alone 52,187 35.3% White alone 7,889 5.3% Hispanic 6,692 4.5% Two or more races 3,094 2.1% Asian alone 394 0.3% Other race alone 151 0.1% Native Hawaiian and Other 53 0.04% American Indian alone
2000 2022
5,128,661 62.6% White alone 2,331,465 28.5% Black alone 435,227 5.3% Hispanic 171,513 2.1% Asian alone 87,364 1.1% Two or more races 17,670 0.2% American Indian alone 11,275 0.1% Other race alone 3,278 0.04% Native Hawaiian and Other
5,415,657 49.6% White alone 3,349,240 30.7% Black alone 1,132,604 10.4% Hispanic 479,156 4.4% Asian alone 462,923 4.2% Two or more races 54,416 0.5% Other race alone 11,923 0.1% American Indian alone 6,957 0.06% Native Hawaiian and Other
Income and house value in Savannah Median household income in 2022 $72,160 White non-Hispanic householders$43,499 Black householders$59,410 Asian householders$43,611 Some other race householders$52,462 Two or more races householders$55,565 Hispanic or Latino race householdersMedian 2022 house value $295,865 White Non-Hispanic householders$202,015 Black or African American householders$265,006 American Indian or Alaska Native householders $283,776 Asian householders$212,832 Some other race householders$328,951 Two or more races householders$290,775 Hispanic or Latino householders
Median age by race in Savannah
37.5 Median age for White residents37.4 37.6 34.5 Median age for Black or African American residents33.0 36.9 39.2 Median age for American Indian / Alaska Native residents39.4 31.4 26.7 Median age for Asian residents26.8 25.1 -666,666,666.0 Median age for Native Hawaiian / Pacific Islander residents-666,666,666.0 -666,666,666.0 23.0 Median age for Other race residents25.4 22.8 29.1 Median age for Two or more races residents28.6 29.3 37.7 Median age for White alone residents37.8 37.7 27.7 Median age for Hispanic or Latino residents28.4 26.4
Owner/renter occupied households by race in Savannah
House owners and renters - White residents 13,187 53.8% Owner occupied11,304 46.2% Renter occupiedHouse owners and renters - Black or African American residents 12,409 39.7% Owner occupied18,853 60.3% Renter occupiedHouse owners and renters - American Indian / Alaska Native residents 16 11.2% Owner occupied128 88.8% Renter occupiedHouse owners and renters - Asian residents 604 56.6% Owner occupied463 43.4% Renter occupiedHouse owners and renters - Native Hawaiian / Pacific Islander residents 34 81.2% Owner occupied8 18.8% Renter occupiedHouse owners and renters - Other race residents 144 25.7% Owner occupied416 74.3% Renter occupiedHouse owners and renters - Two or more races residents 1,455 43.4% Owner occupied1,898 56.6% Renter occupiedHouse owners and renters - White alone residents 12,810 53.4% Owner occupied11,157 46.6% Renter occupiedHouse owners and renters - Hispanic or Latino residents 1,065 44.2% Owner occupied1,344 55.8% Renter occupied
Language usage in Savannah
English speakers - Total 93.4% of residents of Savannah speak English at home.
3.4% of residents speak Spanish at home 3,530 73.9% Speak English very well1,249 26.1% Speak English less than very well3.1% of residents speak other language at home 3,045 69.2% Speak English very well1,353 30.8% Speak English less than very well
English speakers - Born in the United States 94.1% of residents of Savannah speak English at home.
4.2% of residents speak Spanish at home 2,196 92.2% Speak English very well185 7.8% Speak English less than very well1.6% of residents speak other language at home 896 96.6% Speak English very well32 3.4% Speak English less than very well
English speakers - Native, born elsewhere 67.8% of residents of Savannah speak English at home.
27.7% of residents speak Spanish at home 549 66.6% Speak English very well275 33.4% Speak English less than very well4.5% of residents speak other language at home 66 49.6% Speak English very well67 50.4% Speak English less than very well
English speakers - Foreign-born 49.9% of residents of Savannah speak English at home.
14.9% of residents speak Spanish at home 611 47.5% Speak English very well676 52.5% Speak English less than very well35.3% of residents speak other language at home 1,934 63.3% Speak English very well1,122 36.7% Speak English less than very well
White (Caucasian) - Speak only English Native:
95.4% (48,269)Foreign-born:
60.4% (1,218)
White (Caucasian) - Speak another language Native:
4.6% (2,305)Foreign-born:
39.6% (799)
Black or African American - Speak only English Native:
99.0% (68,877)Foreign-born:
84.7% (2,433)
Black or African American - Speak another language Native:
1.0% (687)Foreign-born:
15.3% (439)
American Indian / Alaska Native - Speak only English Native:
73.8% (153)Foreign-born:
32.2% (57)
American Indian / Alaska Native - Speak another language Native:
23.8% (49)Foreign-born:
66.9% (119)
Asian - Speak only English Native:
81.0% (733)Foreign-born:
13.5% (299)
Asian - Speak another language Native:
19.0% (172)Foreign-born:
86.5% (1,908)
Other race - Speak only English Native:
55.8% (942)Foreign-born:
58.2% (117)
Other race - Speak another language Native:
44.2% (746)Foreign-born:
41.8% (84)
Two or more races - Speak only English Native:
88.7% (7,288)Foreign-born:
17.4% (210)
Two or more races - Speak another language Native:
11.3% (924)Foreign-born:
82.6% (995)
White alone - Speak only English Native:
96.4% (47,226)Foreign-born:
63.2% (1,218)
White alone - Speak another language Native:
3.6% (1,786)Foreign-born:
36.8% (709)
Hispanic or Latino - Speak only English Native:
57.3% (3,207)Foreign-born:
18.3% (288)
Hispanic or Latino - Speak another language Native:
42.7% (2,388)Foreign-born:
81.7% (1,287)
Foreign-born residents in Savannah 9,557 residents are foreign born (2.5% Asia , 2.4% Latin America , 0.7% Europe ).
This city:
6.4%Georgia:
10.4%
Marital status for residents in Savannah Marital status - White (Caucasian) population 15 years and over
Males 42.1% Never married40.2% Now married2.1% Separated1.3% Widowed14.3% DivorcedFemales 38.5% Never married36.8% Now married1.9% Separated8.6% Widowed14.1% DivorcedWomen who gave birth in the past 12 months Now married:
89.7% (191)Unmarried:
10.3% (22)
Women who did not give birth in the past 12 months Now married:
33.9% (4,868)Unmarried:
66.1% (9,480)
Marital status - Black or African American population 15 years and over
Males 52.6% Never married24.9% Now married4.5% Separated4.1% Widowed13.9% DivorcedFemales 56.1% Never married19.8% Now married3.2% Separated10.6% Widowed10.3% DivorcedWomen who gave birth in the past 12 months Now married:
17.9% (265)Unmarried:
82.1% (1,219)
Women who did not give birth in the past 12 months Now married:
20.2% (4,033)Unmarried:
79.8% (15,971)
Marital status - American Indian / Alaska Native population 15 years and over
Males 88.6% Never married5.7% Now married0.0% Separated2.1% Widowed3.6% DivorcedFemales 38.2% Never married31.6% Now married0.0% Separated14.5% Widowed15.8% DivorcedWomen who did not give birth in the past 12 months Now married:
16.7% (11)Unmarried:
83.3% (55)
Marital status - Asian population 15 years and over
Males 48.1% Never married43.9% Now married2.0% Separated0.0% Widowed5.9% DivorcedFemales 37.8% Never married46.2% Now married0.0% Separated11.6% Widowed4.4% DivorcedWomen who gave birth in the past 12 months Now married:
100.0% (54)Unmarried:
0.0% (0)
Women who did not give birth in the past 12 months Now married:
44.8% (610)Unmarried:
55.2% (750)
Marital status - Native Hawaiian / Pacific Islander population 15 years and over
Males 38.3% Never married61.7% Now married0.0% Separated0.0% Widowed0.0% DivorcedFemales 52.4% Never married34.9% Now married0.0% Separated12.7% Widowed0.0% DivorcedWomen who did not give birth in the past 12 months Now married:
34.0% (18)Unmarried:
66.0% (35)
Marital status - Other race population 15 years and over
Males 43.4% Never married47.6% Now married1.5% Separated0.0% Widowed7.5% DivorcedFemales 38.5% Never married38.4% Now married0.0% Separated6.1% Widowed16.9% DivorcedWomen who gave birth in the past 12 months Now married:
88.4% (128)Unmarried:
11.6% (17)
Women who did not give birth in the past 12 months Now married:
32.7% (287)Unmarried:
67.3% (590)
Marital status - Two or more races population 15 years and over
Males 54.6% Never married31.3% Now married1.4% Separated3.7% Widowed9.0% DivorcedFemales 53.2% Never married31.5% Now married0.4% Separated2.4% Widowed12.5% DivorcedWomen who gave birth in the past 12 months Now married:
64.2% (124)Unmarried:
35.8% (69)
Women who did not give birth in the past 12 months Now married:
22.9% (810)Unmarried:
77.1% (2,723)
Marital status - White alone, not Hispanic / Latino population 15 years and over
Males 42.2% Never married40.5% Now married2.2% Separated1.3% Widowed13.9% DivorcedFemales 38.8% Never married36.6% Now married1.9% Separated8.9% Widowed13.8% DivorcedWomen who gave birth in the past 12 months Now married:
88.4% (168)Unmarried:
11.6% (22)
Women who did not give birth in the past 12 months Now married:
33.9% (4,750)Unmarried:
66.1% (9,246)
Marital status - Hispanic or Latino population 15 years and over
Males 44.0% Never married45.5% Now married0.0% Separated0.0% Widowed10.5% DivorcedFemales 40.2% Never married41.9% Now married1.5% Separated6.0% Widowed10.5% DivorcedWomen who gave birth in the past 12 months Now married:
100.0% (229)Unmarried:
0.0% (0)
Women who did not give birth in the past 12 months Now married:
29.9% (690)Unmarried:
70.1% (1,621)
Ancestries in Savannah
4,280 4.8% English3,651 4.1% Irish3,529 4.0% American2,063 2.3% German1,462 1.7% Italian1,396 1.6% African1,030 1.2% Scottish920 1.0% European814 0.9% Jamaican565 0.6% Polish463 0.5% Scotch-Irish411 0.5% French259 0.3% Haitian183 0.2% Eastern European168 0.2% British152 0.2% Greek145 0.2% French Canadian141 0.2% Swedish136 0.2% Welsh129 0.1% Dutch114 0.1% Russian110 0.1% Lebanese106 0.1% Iranian103 0.1% West Indian101 0.1% Norwegian98 0.1% Arab91 0.1% Austrian86 0.10% Ghanaian84 0.09% Barbadian84 0.09% Ukrainian82 0.09% Northern European82 0.09% Scandinavian66 0.07% Trinidadian and Tobagonian62 0.07% Finnish60 0.07% Portuguese53 0.06% Serbian41 0.05% Turkish40 0.05% Canadian39 0.04% Swiss37 0.04% Hungarian32 0.04% Lithuanian31 0.04% Pennsylvania German29 0.03% South African29 0.03% Guyanese20 0.02% Czech20 0.02% Bahamian20 0.02% Romanian19 0.02% Cajun18 0.02% Nigerian17 0.02% Palestinian17 0.02% Israeli16 0.02% Ethiopian16 0.02% Moroccan15 0.02% Danish14 0.02% Australian14 0.02% Belgian11 0.01% Kenyan10 0.01% Zimbabwean10 0.01% Cypriot9 0.01% Latvian8 0.01% Syrian8 0.01% Estonian7 0.01% Slovak6 0.01% Croatian5 0.01% Brazilian
Geographical mobility in Savannah Same house 1 year ago 37,667 70.3% White (Caucasian)62,593 81.1% Black or African American100 46.3% American Indian / Alaska Native3,044 71.0% Asian121 99.9% Native Hawaiian / Pacific Islander2,197 70.3% Other race7,348 73.8% Two or more races36,370 70.2% White alone, not Hispanic / Latino5,141 65.8% Hispanic or LatinoMoved within same county 4,713 8.8% White / Caucasian6,094 7.9% Black or African American93 43.1% American Indian / Alaska Native476 11.1% Asian8 6.7% Native Hawaiian / Pacific Islander600 19.2% Other race622 6.2% Two or more races4,713 9.1% White alone, not Hispanic / Latino1,587 20.3% Hispanic or LatinoMoved within same state 3,620 6.8% White / Caucasian4,941 6.4% Black or African American23 10.6% American Indian / Alaska Native97 2.3% Asian72 2.3% Other race750 7.5% Two or more races3,426 6.6% White alone, not Hispanic / Latino469 6.0% Hispanic or LatinoMoved from different state 7,314 13.6% White / Caucasian3,066 4.0% Black or African American100 2.3% Asian291 9.3% Other race1,153 11.6% Two or more races7,060 13.6% White alone, not Hispanic / Latino522 6.7% Hispanic or LatinoMoved from abroad 277 0.5% White522 0.7% Black or African American437 10.2% Asian5 3.7% Native Hawaiian / Pacific Islander7 0.2% Other race89 0.9% Two or more races277 0.5% White alone, not Hispanic / Latino89 1.1% Hispanic or Latino
Children Nativity (place of birth) in Savannah
Children under 6 years - Living with two parents Both parents native 3,307 100.0% NativeBoth parents foreign-born 88 58.1% Native64 41.9% Foreign-bornOne native, one foreign-born parent 401 100.0% NativeChildren under 6 years - Living with one parent Native parent 6,461 100.0% Native2 0.0% Foreign-bornForeign-born parent 51 66.2% Native26 33.8% Foreign-bornChildren 6 to 17 years - Living with two parents Both parents native 5,889 99.8% Native10 0.2% Foreign-bornBoth parents foreign-born 376 54.3% Native317 45.7% Foreign-bornOne native, one foreign-born parent 707 100.0% NativeChildren 6 to 17 years - Living with one parent Native parent 9,632 100.0% NativeForeign-born parent 479 58.0% Native348 42.0% Foreign-born
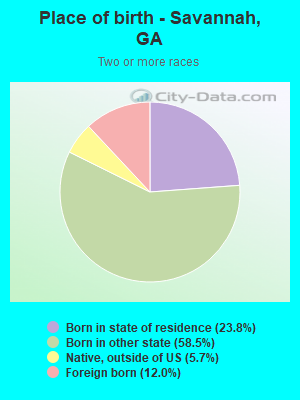
Place of birth for residents in Savannah
Grandparents responsible for own grandchildren in Savannah
Grandparents (30 to 59 years) White / Caucasian 46 39.8% Responsible for grandchildren69 60.2% Not responsible for grandchildrenBlack or African American 708 72.5% Responsible for grandchildren268 27.5% Not responsible for grandchildrenAsian 11 100.0% Not responsible for grandchildrenNative Hawaiian / Pacific Islander 22 100.0% Responsible for grandchildrenOther race 5 15.8% Responsible for grandchildren26 84.2% Not responsible for grandchildrenTwo or more races 13 100.0% Not responsible for grandchildrenWhite alone, not Hispanic / Latino 47 39.0% Responsible for grandchildren74 61.0% Not responsible for grandchildrenHispanic or Latino 19 100.0% Not responsible for grandchildrenGrandparents (60 years and over) White / Caucasian 32 14.4% Responsible for grandchildren191 85.6% Not responsible for grandchildrenBlack or African American 579 36.7% Responsible for grandchildren999 63.3% Not responsible for grandchildrenAsian 36 100.0% Not responsible for grandchildrenNative Hawaiian / Pacific Islander 18 100.0% Responsible for grandchildrenOther race 13 79.8% Responsible for grandchildren3 20.2% Not responsible for grandchildrenWhite alone, not Hispanic / Latino 33 15.2% Responsible for grandchildren181 84.8% Not responsible for grandchildrenHispanic or Latino 12 41.1% Responsible for grandchildren17 58.9% Not responsible for grandchildren