Races in Sandpoint, Idaho (ID) Detailed Stats
Ancestries, Foreign-born residents, place of birth
Settings
X


Recent posts about races in Sandpoint, Idaho on our local forum with over 2,400,000 registered users:
 | Sandpoint restaurants closing (13 replies) |
| Living around Sandpoint--what you wished you had known when you picked a house (28 replies) |
| South and North Idaho house prices (13 replies) |
| Sandpoint and surrounding areas - Employment, politics, etc??? (39 replies) |
| Winters in Sandpoint (25 replies) |
| Builder Recomendation-SANDPOINT (14 replies) |
Latest news about races in Sandpoint, ID collected exclusively by city-data.com from local newspapers, TV, and radio stations
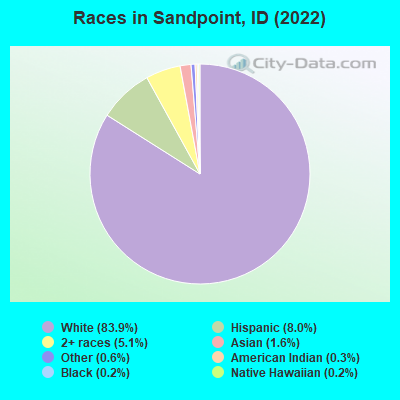
According to 2022 data, the most numerous races in Sandpoint, ID are White alone (7,808 residents), Hispanic (742 residents), and Two or more races (477 residents). 95.7% of Sandpoint residents speak English at home. 3.4% of Sandpoint, ID residents are foreign-born (1.1% born in Asia, 1.1% born in Europe, 1.1% born in Latin America), which is 46.3% less than the foreign-born rate of 5.0% across the entire state of Idaho.
Race distribution in Sandpoint
2000
2022

- 6,46794.6%White alone
- 1682.5%Hispanic
- 971.4%Two or more races
- 600.9%American Indian alone
- 270.4%Asian alone
- 80.1%Black alone
- 50.07%Other race alone
- 30.04%Native Hawaiian and Other
Pacific Islander alone

-
- 7,80883.9%White alone
- 7428.0%Hispanic
- 4775.1%Two or more races
- 1451.6%Asian alone
- 600.6%Other race alone
- 250.3%American Indian alone
- 220.2%Black alone
- 220.2%Native Hawaiian and Other
Pacific Islander alone
2000
2022
-
- 1,139,29188.0%White alone
- 101,6907.9%Hispanic
- 18,2611.4%Two or more races
- 15,7891.2%American Indian alone
- 11,6410.9%Asian alone
- 4,8890.4%Black alone
- 1,1920.09%Other race alone
- 1,2000.09%Native Hawaiian and Other
Pacific Islander alone

-
- 1,531,21979.0%White alone
- 261,92113.5%Hispanic
- 81,1124.2%Two or more races
- 25,1741.3%Asian alone
- 15,8250.8%American Indian alone
- 11,8680.6%Black alone
- 8,7520.5%Other race alone
- 3,1620.2%Native Hawaiian and Other
Pacific Islander alone

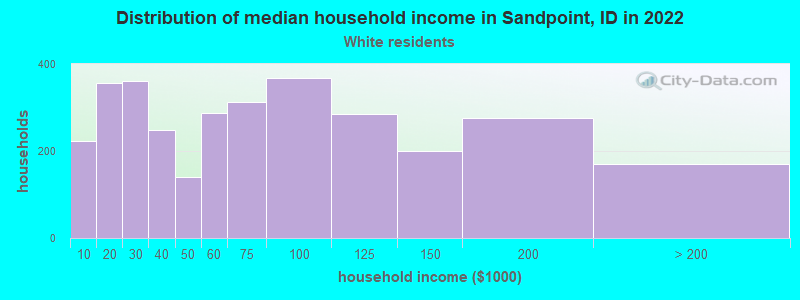
Income and house value in Sandpoint
- Median household income in 2022
- $61,233White non-Hispanic householders
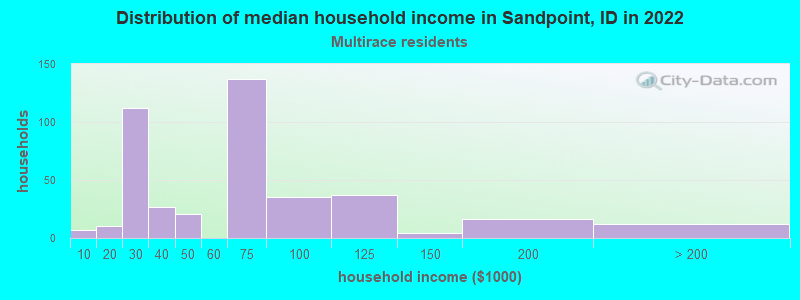
- $71,844Two or more races householders
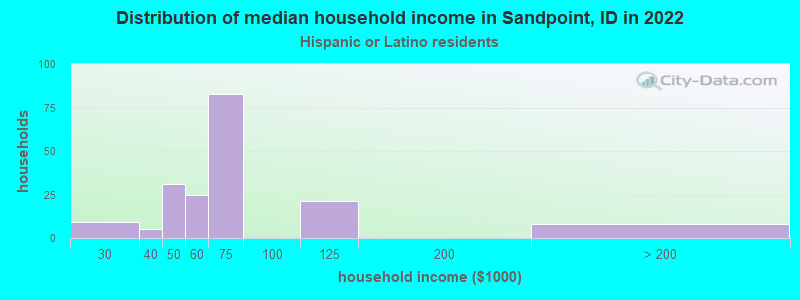
- $71,735Hispanic or Latino race householders
- Median 2022 house value
- $562,220White Non-Hispanic householders
- $428,214Two or more races householders
- $377,836Hispanic or Latino householders
Household income for White non-Hispanic householders
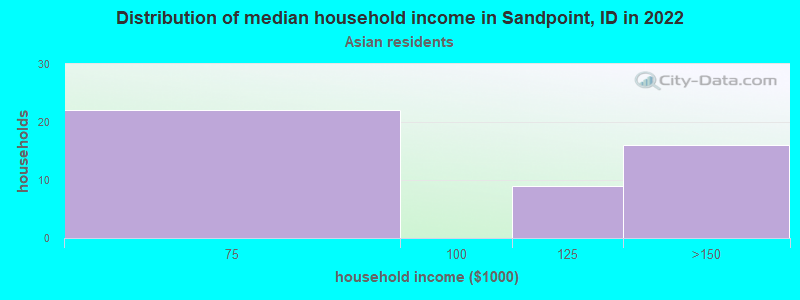
Household income for Asian householders
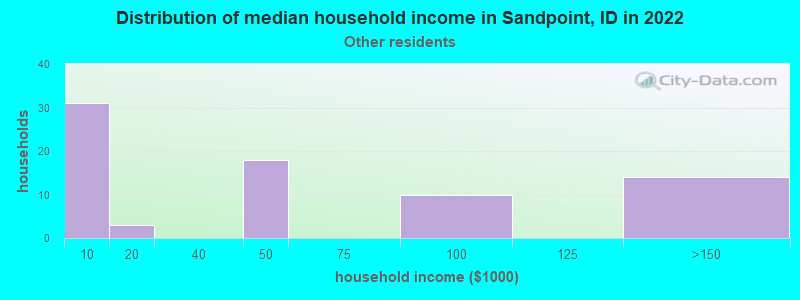
Household income for Some other race householders
Household income for Two or more races householders
Household income for Hispanic or Latino race householders
Median age by race in Sandpoint
- 44.0Median age for White residents
- 42.1Males
- 46.0Females
- 54.9Median age for Black or African American residents
- 43.7Males
- -869,696,968.8Females
- 25.6Median age for American Indian / Alaska Native residents
- -708,860,758.8Males
- 31.8Females
- 33.8Median age for Asian residents
- 28.5Males
- 48.5Females
- 4.8Median age for Native Hawaiian / Pacific Islander residents
- -355,119,825.4Males
- 8.3Females
- 39.9Median age for Other race residents
- 52.3Males
- 36.2Females
- 43.2Median age for Two or more races residents
- 13.8Males
- 45.8Females
- 45.1Median age for White alone residents
- 42.8Males
- 46.3Females
- 30.7Median age for Hispanic or Latino residents
- 28.3Males
- 33.0Females
Owner/renter occupied households by race in Sandpoint
- House owners and renters - White residents
- 1,99061.4%Owner occupied
- 1,25238.6%Renter occupied
- House owners and renters - American Indian / Alaska Native residents
- 2100.0%Renter occupied
- House owners and renters - Asian residents
- 51100.0%Owner occupied
- House owners and renters - Native Hawaiian / Pacific Islander residents
- 4100.0%Renter occupied
- House owners and renters - Other race residents
- 2535.1%Owner occupied
- 4664.9%Renter occupied
- House owners and renters - Two or more races residents
- 12030.4%Owner occupied
- 27569.6%Renter occupied
- House owners and renters - White alone residents
- 1,97260.8%Owner occupied
- 1,27039.2%Renter occupied
- House owners and renters - Hispanic or Latino residents
- 7137.0%Owner occupied
- 12163.0%Renter occupied
Language usage in Sandpoint
- English speakers - Total
- 95.7% of residents of Sandpoint speak English at home.
- 2.3% of residents speak Spanish at home
- 14972.0%Speak English very well
- 5828.0%Speak English less than very well
- 1.7% of residents speak other language at home
- 9964.7%Speak English very well
- 5435.3%Speak English less than very well
- English speakers - Born in the United States
- 98.4% of residents of Sandpoint speak English at home.
- 1.0% of residents speak Spanish at home
- 62100.0%Speak English very well
- 0.3% of residents speak other language at home
- 17100.0%Speak English very well
- English speakers - Native, born elsewhere
- 26.5% of residents of Sandpoint speak English at home.
- 58.8% of residents speak Spanish at home
- 20100.0%Speak English less than very well
- 26.5% of residents speak other language at home
- 9100.0%Speak English less than very well
- English speakers - Foreign-born
- 39.0% of residents of Sandpoint speak English at home.
- 29.6% of residents speak Spanish at home
- 5859.8%Speak English very well
- 3940.2%Speak English less than very well
- 30.5% of residents speak other language at home
- 5757.0%Speak English very well
- 4343.0%Speak English less than very well
White (Caucasian) - Speak only English
| Native: | 99.6% (7,378) |
| Foreign-born: | 63.0% (86) |
White (Caucasian) - Speak another language
| Native: | 0.9% (64) |
| Foreign-born: | 35.0% (48) |
Asian - Speak only English
| Native: | 59.1% (27) |
| Foreign-born: | 18.1% (16) |
Asian - Speak another language
| Native: | 36.7% (17) |
| Foreign-born: | 81.0% (72) |
Other race - Speak another language
| Native: | 21.9% (24) |
| Foreign-born: | 99.1% (52) |
Two or more races - Speak only English
| Native: | 90.9% (809) |
| Foreign-born: | 75.8% (16) |
Two or more races - Speak another language
| Native: | 6.4% (57) |
| Foreign-born: | 41.7% (9) |
White alone - Speak only English
| Native: | 98.9% (7,212) |
| Foreign-born: | 68.2% (93) |
White alone - Speak another language
| Native: | 1.1% (80) |
| Foreign-born: | 12.3% (17) |
Hispanic or Latino - Speak another language
| Native: | 6.5% (39) |
| Foreign-born: | 98.8% (100) |
Foreign-born residents in Sandpoint
318 residents are foreign born (1.1% Asia, 1.1% Europe, 1.1% Latin America).
| This city: | 3.4% |
| Idaho: | 5.7% |


Marital status for residents in Sandpoint
Marital status - White (Caucasian) population 15 years and over
- Males
- 31.2%Never married
- 52.0%Now married
- 1.4%Separated
- 3.1%Widowed
- 12.2%Divorced
- Females
- 28.3%Never married
- 42.6%Now married
- 2.1%Separated
- 14.6%Widowed
- 12.3%Divorced
Women who gave birth in the past 12 months
| Now married: | 83.3% (56) |
| Unmarried: | 16.7% (11) |
Women who did not give birth in the past 12 months
| Now married: | 44.1% (658) |
| Unmarried: | 55.9% (835) |
Marital status - Black or African American population 15 years and over
- Males
- 55.6%Never married
- 44.4%Now married
- 0.0%Separated
- 0.0%Widowed
- 0.0%Divorced
- Females
- 100.0%Never married
- 0.0%Now married
- 0.0%Separated
- 0.0%Widowed
- 0.0%Divorced
Marital status - American Indian / Alaska Native population 15 years and over
- Males
- 100.0%Never married
- 0.0%Now married
- 0.0%Separated
- 0.0%Widowed
- 0.0%Divorced
- Females
- 31.2%Never married
- 12.5%Now married
- 0.0%Separated
- 0.0%Widowed
- 56.2%Divorced
Women who did not give birth in the past 12 months
| Now married: | 12.5% (2) |
| Unmarried: | 87.5% (16) |
Marital status - Asian population 15 years and over
- Males
- 59.3%Never married
- 40.7%Now married
- 0.0%Separated
- 0.0%Widowed
- 0.0%Divorced
- Females
- 14.5%Never married
- 56.6%Now married
- 0.0%Separated
- 0.0%Widowed
- 28.9%Divorced
Women who did not give birth in the past 12 months
| Now married: | 38.9% (22) |
| Unmarried: | 61.1% (35) |
Marital status - Other race population 15 years and over
- Males
- 34.9%Never married
- 30.2%Now married
- 19.8%Separated
- 0.0%Widowed
- 15.1%Divorced
- Females
- 0.0%Never married
- 84.6%Now married
- 0.0%Separated
- 0.0%Widowed
- 15.4%Divorced
Women who did not give birth in the past 12 months
| Now married: | 100.0% (36) |
| Unmarried: | 0.0% (0) |
Marital status - Two or more races population 15 years and over
- Males
- 23.4%Never married
- 37.8%Now married
- 9.0%Separated
- 0.0%Widowed
- 29.7%Divorced
- Females
- 15.9%Never married
- 51.9%Now married
- 0.0%Separated
- 1.2%Widowed
- 30.9%Divorced
Women who did not give birth in the past 12 months
| Now married: | 80.2% (195) |
| Unmarried: | 19.8% (48) |
Marital status - White alone, not Hispanic / Latino population 15 years and over
- Males
- 29.9%Never married
- 52.7%Now married
- 1.5%Separated
- 3.2%Widowed
- 12.7%Divorced
- Females
- 28.8%Never married
- 41.9%Now married
- 2.1%Separated
- 14.7%Widowed
- 12.4%Divorced
Women who gave birth in the past 12 months
| Now married: | 77.6% (39) |
| Unmarried: | 22.4% (11) |
Women who did not give birth in the past 12 months
| Now married: | 43.5% (658) |
| Unmarried: | 56.5% (854) |
Marital status - Hispanic or Latino population 15 years and over
- Males
- 47.5%Never married
- 34.0%Now married
- 7.1%Separated
- 0.0%Widowed
- 11.3%Divorced
- Females
- 3.1%Never married
- 91.8%Now married
- 0.0%Separated
- 2.6%Widowed
- 2.6%Divorced
Women who gave birth in the past 12 months
| Now married: | 100.0% (18) |
| Unmarried: | 0.0% (0) |
Women who did not give birth in the past 12 months
| Now married: | 100.0% (144) |
| Unmarried: | 0.0% (0) |
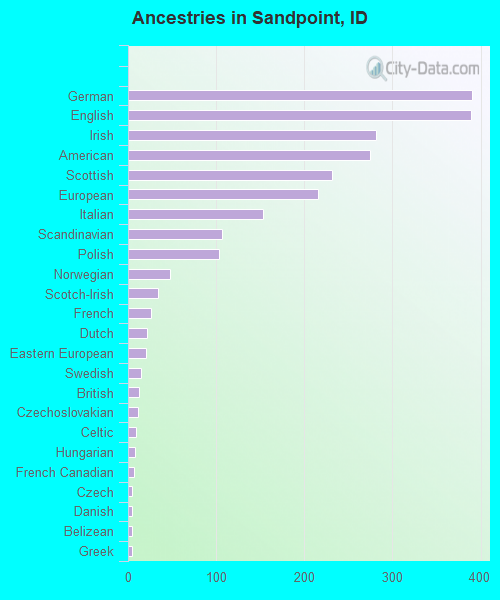
Ancestries in Sandpoint

- 39012.0%German
- 38911.9%English
- 2818.6%Irish
- 2758.4%American
- 2317.1%Scottish
- 2166.6%European
- 1534.7%Italian
- 1073.3%Scandinavian
- 1033.2%Polish
- 481.5%Norwegian
- 341.0%Scotch-Irish
- 260.8%French
- 220.7%Dutch
- 200.6%Eastern European
- 150.5%Swedish
- 130.4%British
- 110.3%Czechoslovakian
- 90.3%Celtic
- 80.2%Hungarian
- 70.2%French Canadian
- 50.2%Czech
- 50.2%Danish
- 50.2%Belizean
- 40.1%Greek
Geographical mobility in Sandpoint

- Same house 1 year ago
- 6,19179.2%White (Caucasian)
- 1672.1%Black or African American
- 929.3%American Indian / Alaska Native
- 10068.8%Asian
- 18100.0%Native Hawaiian / Pacific Islander
- 16291.2%Other race
- 74976.5%Two or more races
- 6,17279.9%White alone, not Hispanic / Latino
- 59482.0%Hispanic or Latino

-
- Moved within same county
- 80310.3%White / Caucasian
- 126.9%Other race
- 10310.5%Two or more races
- 7459.6%White alone, not Hispanic / Latino
- 8611.8%Hispanic or Latino

-
- Moved within same state
- 1822.3%White / Caucasian
- 724.2%American Indian / Alaska Native
- 565.7%Two or more races
- 1862.4%White alone, not Hispanic / Latino
- 40.6%Hispanic or Latino

-
- Moved from different state
- 5597.2%White / Caucasian
- 625.0%Black or African American
- 931.9%American Indian / Alaska Native
- 626.4%Two or more races
- 5667.3%White alone, not Hispanic / Latino

-
- Moved from abroad
- 540.7%White
- 7349.9%Asian
- 250.3%White alone, not Hispanic / Latino
- 172.3%Hispanic or Latino

Children Nativity (place of birth) in Sandpoint
Place of birth for residents in Sandpoint
![Place of birth for the foreign-born population - Regions]()
- 114Americas
- 103Asia
- 100Europe
- 97Latin America
- 89Western Europe
- 70Central America
- 62Eastern Asia
- 48China
- 31South Central Asia
- 21South America
- 16Northern America
- 11Northern Europe
- 9South Eastern Asia
- 6Caribbean

![Place of birth for the foreign-born population - Countries]()
- 56Germany
- 53Mexico
- 48China
- 31Nepal
- 22France
- 21Colombia
- 17El Salvador
- 16Canada
- 13Korea
- 11England
- 11Netherlands
- 8Indonesia
- 6Cuba
- 1Thailand

Grandparents responsible for own grandchildren in Sandpoint
Zip codes: 83864.