Races in Salmon Creek, Washington (WA) Detailed Stats
Data:
Races - White alone (%)
Races - White alone (% change since 2000)
Races - Black alone (%)
Races - Black alone (% change since 2000)
Races - American Indian alone (%)
Races - American Indian alone (% change since 2000)
Races - Asian alone (%)
Races - Asian alone (% change since 2000)
Races - Hispanic (%)
Races - Hispanic (% change since 2000)
Races - Native Hawaiian and Other Pacific Islander alone (%)
Races - Native Hawaiian and Other Pacific Islander alone (% change since 2000)
Races - Two or more races(%)
Races - Two or more races(% change since 2000)
Races - Other race alone (%)
Races - Other race alone (% change since 2000)
Racial diversity
Place of birth - Born in state of residence (%)
Place of birth - Born in state of residence (%) - White
Place of birth - Born in state of residence (%) - Black or African American
Place of birth - Born in state of residence (%) - Asian
Place of birth - Born in state of residence (%) - Hispanic or Latino
Place of birth - Born in state of residence (%) - American Indian and Alaska Native
Place of birth - Born in state of residence (%) - Multirace
Place of birth - Born in state of residence (%) - Other Race
Place of birth - Born in other state (%)
Place of birth - Born in other state (%) - White
Place of birth - Born in other state (%) - Black or African American
Place of birth - Born in other state (%) - Asian
Place of birth - Born in other state (%) - Hispanic or Latino
Place of birth - Born in other state (%) - American Indian and Alaska Native
Place of birth - Born in other state (%) - Multirace
Place of birth - Born in other state (%) - Other Race
Place of birth - Native, outside of US (%)
Place of birth - Native, outside of US (%) - White
Place of birth - Native, outside of US (%) - Black or African American
Place of birth - Native, outside of US (%) - Asian
Place of birth - Native, outside of US (%) - Hispanic or Latino
Place of birth - Native, outside of US (%) - American Indian and Alaska Native
Place of birth - Native, outside of US (%) - Multirace
Place of birth - Native, outside of US (%) - Other Race
Place of birth - Foreign born (%)
Place of birth - Foreign born (%) - White
Place of birth - Foreign born (%) - Black or African American
Place of birth - Foreign born (%) - Asian
Place of birth - Foreign born (%) - Hispanic or Latino
Place of birth - Foreign born (%) - American Indian and Alaska Native
Place of birth - Foreign born (%) - Multirace
Place of birth - Foreign born (%) - Other Race
Residents speaking English at home (%)
Residents speaking English at home - Born in the United States (%)
Residents speaking English at home - Native, born elsewhere (%)
Residents speaking English at home - Foreign born (%)
Residents speaking Spanish at home (%)
Residents speaking Spanish at home - Born in the United States (%)
Residents speaking Spanish at home - Native, born elsewhere (%)
Residents speaking Spanish at home - Foreign born (%)
Residents speaking other language at home (%)
Residents speaking other language at home - Born in the United States (%)
Residents speaking other language at home - Native, born elsewhere (%)
Residents speaking other language at home - Foreign born (%)
Marital status - Never married (%)
Marital status - Now married (%)
Marital status - Separated (%)
Marital status - Widowed (%)
Marital status - Divorced (%)
Ancestries Reported - Arab (%)
Ancestries Reported - Czech (%)
Ancestries Reported - Danish (%)
Ancestries Reported - Dutch (%)
Ancestries Reported - English (%)
Ancestries Reported - French (%)
Ancestries Reported - French Canadian (%)
Ancestries Reported - German (%)
Ancestries Reported - Greek (%)
Ancestries Reported - Hungarian (%)
Ancestries Reported - Irish (%)
Ancestries Reported - Italian (%)
Ancestries Reported - Lithuanian (%)
Ancestries Reported - Norwegian (%)
Ancestries Reported - Polish (%)
Ancestries Reported - Portuguese (%)
Ancestries Reported - Russian (%)
Ancestries Reported - Scotch-Irish (%)
Ancestries Reported - Scottish (%)
Ancestries Reported - Slovak (%)
Ancestries Reported - Subsaharan African (%)
Ancestries Reported - Swedish (%)
Ancestries Reported - Swiss (%)
Ancestries Reported - Ukrainian (%)
Ancestries Reported - United States (%)
Ancestries Reported - Welsh (%)
Ancestries Reported - West Indian (%)
Ancestries Reported - Other (%)
Geographical mobility - Same house 1 year ago (%)
Geographical mobility - Same house 1 year ago (%) - White
Geographical mobility - Same house 1 year ago (%) - Black or African American
Geographical mobility - Same house 1 year ago (%) - Asian
Geographical mobility - Same house 1 year ago (%) - Hispanic or Latino
Geographical mobility - Same house 1 year ago (%) - American Indian and Alaska Native
Geographical mobility - Same house 1 year ago (%) - Multirace
Geographical mobility - Same house 1 year ago (%) - Other Race
Geographical mobility - Moved within same county (%)
Geographical mobility - Moved within same county (%) - White
Geographical mobility - Moved within same county (%) - Black or African American
Geographical mobility - Moved within same county (%) - Asian
Geographical mobility - Moved within same county (%) - Hispanic or Latino
Geographical mobility - Moved within same county (%) - American Indian and Alaska Native
Geographical mobility - Moved within same county (%) - Multirace
Geographical mobility - Moved within same county (%) - Other Race
Geographical mobility - Moved from different county within same state (%)
Geographical mobility - Moved from different county within same state (%) - White
Geographical mobility - Moved from different county within same state (%) - Black or African American
Geographical mobility - Moved from different county within same state (%) - Asian
Geographical mobility - Moved from different county within same state (%) - Hispanic or Latino
Geographical mobility - Moved from different county within same state (%) - American Indian and Alaska Native
Geographical mobility - Moved from different county within same state (%) - Multirace
Geographical mobility - Moved from different county within same state (%) - Other Race
Geographical mobility - Moved from different state (%)
Geographical mobility - Moved from different state (%) - White
Geographical mobility - Moved from different state (%) - Black or African American
Geographical mobility - Moved from different state (%) - Asian
Geographical mobility - Moved from different state (%) - Hispanic or Latino
Geographical mobility - Moved from different state (%) - American Indian and Alaska Native
Geographical mobility - Moved from different state (%) - Multirace
Geographical mobility - Moved from different state (%) - Other Race
Geographical mobility - Moved from abroad (%)
Geographical mobility - Moved from abroad (%) - White
Geographical mobility - Moved from abroad (%) - Black or African American
Geographical mobility - Moved from abroad (%) - Asian
Geographical mobility - Moved from abroad (%) - Hispanic or Latino
Geographical mobility - Moved from abroad (%) - American Indian and Alaska Native
Geographical mobility - Moved from abroad (%) - Multirace
Geographical mobility - Moved from abroad (%) - Other Race
Place of birth for the foreign-born population - Ireland (%)
Place of birth for the foreign-born population - Denmark (%)
Place of birth for the foreign-born population - Norway (%)
Place of birth for the foreign-born population - Sweden (%)
Place of birth for the foreign-born population - United Kingdom (%)
Place of birth for the foreign-born population - England (%)
Place of birth for the foreign-born population - Scotland (%)
Place of birth for the foreign-born population - Other Northern Europe (%)
Place of birth for the foreign-born population - Austria (%)
Place of birth for the foreign-born population - Belgium (%)
Place of birth for the foreign-born population - France (%)
Place of birth for the foreign-born population - Germany (%)
Place of birth for the foreign-born population - Netherlands (%)
Place of birth for the foreign-born population - Switzerland (%)
Place of birth for the foreign-born population - Other Western Europe (%)
Place of birth for the foreign-born population - Greece (%)
Place of birth for the foreign-born population - Italy (%)
Place of birth for the foreign-born population - Portugal (%)
Place of birth for the foreign-born population - Spain (%)
Place of birth for the foreign-born population - Other Southern Europe (%)
Place of birth for the foreign-born population - Albania (%)
Place of birth for the foreign-born population - Belarus (%)
Place of birth for the foreign-born population - Bosnia and Herzegovina (%)
Place of birth for the foreign-born population - Bulgaria (%)
Place of birth for the foreign-born population - Croatia (%)
Place of birth for the foreign-born population - Czechoslovakia (%)
Place of birth for the foreign-born population - Hungary (%)
Place of birth for the foreign-born population - Latvia (%)
Place of birth for the foreign-born population - Lithuania (%)
Place of birth for the foreign-born population - North Macedonia (Macedonia) (%)
Place of birth for the foreign-born population - Moldova (%)
Place of birth for the foreign-born population - Poland (%)
Place of birth for the foreign-born population - Romania (%)
Place of birth for the foreign-born population - Russia (%)
Place of birth for the foreign-born population - Serbia (%)
Place of birth for the foreign-born population - Ukraine (%)
Place of birth for the foreign-born population - Other Eastern Europe (%)
Place of birth for the foreign-born population - China (%)
Place of birth for the foreign-born population - Hong Kong (%)
Place of birth for the foreign-born population - Taiwan (%)
Place of birth for the foreign-born population - Japan (%)
Place of birth for the foreign-born population - Korea (%)
Place of birth for the foreign-born population - Other Eastern Asia (%)
Place of birth for the foreign-born population - Afghanistan (%)
Place of birth for the foreign-born population - Bangladesh (%)
Place of birth for the foreign-born population - India (%)
Place of birth for the foreign-born population - Iran (%)
Place of birth for the foreign-born population - Kazakhstan (%)
Place of birth for the foreign-born population - Nepal (%)
Place of birth for the foreign-born population - Pakistan (%)
Place of birth for the foreign-born population - Sri Lanka (%)
Place of birth for the foreign-born population - Uzbekistan (%)
Place of birth for the foreign-born population - Other South Central Asia (%)
Place of birth for the foreign-born population - Burma (%)
Place of birth for the foreign-born population - Cambodia (%)
Place of birth for the foreign-born population - Indonesia (%)
Place of birth for the foreign-born population - Laos (%)
Place of birth for the foreign-born population - Malaysia (%)
Place of birth for the foreign-born population - Philippines (%)
Place of birth for the foreign-born population - Singapore (%)
Place of birth for the foreign-born population - Thailand (%)
Place of birth for the foreign-born population - Vietnam (%)
Place of birth for the foreign-born population - Other South Eastern Asia (%)
Place of birth for the foreign-born population - Armenia (%)
Place of birth for the foreign-born population - Iraq (%)
Place of birth for the foreign-born population - Israel (%)
Place of birth for the foreign-born population - Jordan (%)
Place of birth for the foreign-born population - Kuwait (%)
Place of birth for the foreign-born population - Lebanon (%)
Place of birth for the foreign-born population - Saudi Arabia (%)
Place of birth for the foreign-born population - Syria (%)
Place of birth for the foreign-born population - Turkey (%)
Place of birth for the foreign-born population - Yemen (%)
Place of birth for the foreign-born population - Other Western Asia (%)
Place of birth for the foreign-born population - Eritrea (%)
Place of birth for the foreign-born population - Ethiopia (%)
Place of birth for the foreign-born population - Kenya (%)
Place of birth for the foreign-born population - Somalia (%)
Place of birth for the foreign-born population - Uganda (%)
Place of birth for the foreign-born population - Zimbabwe (%)
Place of birth for the foreign-born population - Other Eastern Africa (%)
Place of birth for the foreign-born population - Cameroon (%)
Place of birth for the foreign-born population - Congo (%)
Place of birth for the foreign-born population - Democratic Republic of Congo (Zaire) (%)
Place of birth for the foreign-born population - Other Middle Africa (%)
Place of birth for the foreign-born population - Egypt (%)
Place of birth for the foreign-born population - Morocco (%)
Place of birth for the foreign-born population - Sudan (%)
Place of birth for the foreign-born population - Other Northern Africa (%)
Place of birth for the foreign-born population - South Africa (%)
Place of birth for the foreign-born population - Other Southern Africa (%)
Place of birth for the foreign-born population - Cabo Verde (%)
Place of birth for the foreign-born population - Ghana (%)
Place of birth for the foreign-born population - Liberia (%)
Place of birth for the foreign-born population - Nigeria (%)
Place of birth for the foreign-born population - Senegal (%)
Place of birth for the foreign-born population - Sierra Leone (%)
Place of birth for the foreign-born population - Other Western Africa (%)
Place of birth for the foreign-born population - Australia (%)
Place of birth for the foreign-born population - New Zealand (%)
Place of birth for the foreign-born population - Fiji (%)
Place of birth for the foreign-born population - Micronesia (%)
Place of birth for the foreign-born population - Bahamas (%)
Place of birth for the foreign-born population - Barbados (%)
Place of birth for the foreign-born population - Cuba (%)
Place of birth for the foreign-born population - Dominica (%)
Place of birth for the foreign-born population - Dominican Republic (%)
Place of birth for the foreign-born population - Grenada (%)
Place of birth for the foreign-born population - Haiti (%)
Place of birth for the foreign-born population - Jamaica (%)
Place of birth for the foreign-born population - St. Vincent and the Grenadines (%)
Place of birth for the foreign-born population - Trinidad and Tobago (%)
Place of birth for the foreign-born population - West Indies (%)
Place of birth for the foreign-born population - Other Caribbean (%)
Place of birth for the foreign-born population - Belize (%)
Place of birth for the foreign-born population - Costa Rica (%)
Place of birth for the foreign-born population - El Salvador (%)
Place of birth for the foreign-born population - Guatemala (%)
Place of birth for the foreign-born population - Honduras (%)
Place of birth for the foreign-born population - Mexico (%)
Place of birth for the foreign-born population - Nicaragua (%)
Place of birth for the foreign-born population - Panama (%)
Place of birth for the foreign-born population - Other Central America (%)
Place of birth for the foreign-born population - Argentina (%)
Place of birth for the foreign-born population - Bolivia (%)
Place of birth for the foreign-born population - Brazil (%)
Place of birth for the foreign-born population - Chile (%)
Place of birth for the foreign-born population - Colombia (%)
Place of birth for the foreign-born population - Ecuador (%)
Place of birth for the foreign-born population - Guyana (%)
Place of birth for the foreign-born population - Peru (%)
Place of birth for the foreign-born population - Uruguay (%)
Place of birth for the foreign-born population - Venezuela (%)
Place of birth for the foreign-born population - Other South America (%)
Place of birth for the foreign-born population - Canada (%)
Place of birth for the foreign-born population - Other Northern America (%)
Place of birth for the foreign-born population - Other (%)
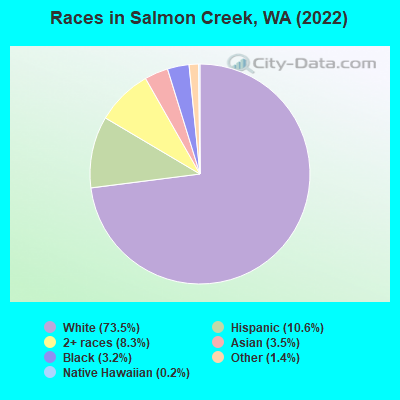
According to 2022 data, the most numerous races in Salmon Creek, WA are White alone (15,313 residents), Hispanic (2,204 residents), and Asian alone (726 residents). 87.5% of Salmon Creek residents speak English at home. 9.4% of Salmon Creek, WA residents are foreign-born (3.3% born in Asia, 3.1% born in Latin America, 1.7% born in Europe), which is 59.4% less than the foreign-born rate of 15.0% across the entire state of Washington.
Race distribution in Salmon Creek
2000 2022
4,652,490 78.9% White alone 441,509 7.5% Hispanic 319,401 5.4% Asian alone 184,631 3.1% Black alone 175,926 3.0% Two or more races 85,396 1.4% American Indian alone 22,779 0.4% Native Hawaiian and Other 11,989 0.2% Other race alone
4,941,456 63.5% White alone 1,093,313 14.0% Hispanic 755,832 9.7% Asian alone 523,448 6.7% Two or more races 299,537 3.8% Black alone 69,024 0.9% American Indian alone 52,231 0.7% Native Hawaiian and Other 50,945 0.7% Other race alone
Income and house value in Salmon Creek Median household income in 2022 $90,779 White non-Hispanic householders$108,514 Asian householders$59,741 Some other race householders$111,668 Two or more races householders$99,182 Hispanic or Latino race householdersMedian 2022 house value $560,051 White Non-Hispanic householders$520,455 Black or African American householders$411,062 American Indian or Alaska Native householders $587,231 Asian householders$377,506 Native Hawaiian and other Pacific Islander householders$545,286 Some other race householders$568,104 Two or more races householders$530,522 Hispanic or Latino householders
Median age by race in Salmon Creek
50.5 Median age for White residents49.3 51.6 26.0 Median age for Black or African American residents27.9 26.4 30.5 Median age for American Indian / Alaska Native residents30.7 51.0 45.0 Median age for Asian residents48.6 43.4 -779,279,278.5 Median age for Native Hawaiian / Pacific Islander residents-779,310,344.0 -928,017,717.8 32.9 Median age for Other race residents28.1 39.0 25.7 Median age for Two or more races residents26.8 18.2 50.9 Median age for White alone residents50.5 51.5 27.7 Median age for Hispanic or Latino residents25.3 33.0
Owner/renter occupied households by race in Salmon Creek
House owners and renters - White residents 5,294 76.7% Owner occupied1,608 23.3% Renter occupiedHouse owners and renters - Black or African American residents 66 34.0% Owner occupied129 66.0% Renter occupiedHouse owners and renters - American Indian / Alaska Native residents 40 100.0% Owner occupiedHouse owners and renters - Asian residents 162 71.8% Owner occupied64 28.2% Renter occupiedHouse owners and renters - Other race residents 158 67.8% Owner occupied75 32.2% Renter occupiedHouse owners and renters - Two or more races residents 695 81.3% Owner occupied160 18.7% Renter occupiedHouse owners and renters - White alone residents 5,235 76.9% Owner occupied1,571 23.1% Renter occupiedHouse owners and renters - Hispanic or Latino residents 386 64.1% Owner occupied216 35.9% Renter occupied
Language usage in Salmon Creek
English speakers - Total 87.5% of residents of Salmon Creek speak English at home.
7.0% of residents speak Spanish at home 1,110 80.6% Speak English very well268 19.4% Speak English less than very well6.1% of residents speak other language at home 1,002 83.5% Speak English very well198 16.5% Speak English less than very well
English speakers - Born in the United States 92.0% of residents of Salmon Creek speak English at home.
5.8% of residents speak Spanish at home 638 94.4% Speak English very well38 5.6% Speak English less than very well2.2% of residents speak other language at home 217 85.1% Speak English very well38 14.9% Speak English less than very well
All residents speak only English at home
English speakers - Foreign-born 29.0% of residents of Salmon Creek speak English at home.
30.5% of residents speak Spanish at home 364 65.7% Speak English very well190 34.3% Speak English less than very well44.8% of residents speak other language at home 645 79.2% Speak English very well169 20.8% Speak English less than very well
White (Caucasian) - Speak only English Native:
96.4% (13,825)Foreign-born:
61.9% (395)
White (Caucasian) - Speak another language Native:
3.7% (527)Foreign-born:
47.2% (301)
Black or African American - Speak only English Native:
96.3% (313)Foreign-born:
17.4% (19)
Black or African American - Speak another language Native:
4.5% (15)Foreign-born:
82.0% (88)
American Indian / Alaska Native - Speak another language Native:
99.0% (72)Foreign-born:
100.0% (134)
Asian - Speak only English Native:
64.1% (95)Foreign-born:
19.7% (118)
Asian - Speak another language Native:
35.6% (53)Foreign-born:
80.1% (477)
Other race - Speak another language Native:
29.2% (154)Foreign-born:
100.0% (224)
Two or more races - Speak only English Native:
84.6% (2,030)Foreign-born:
7.4% (9)
Two or more races - Speak another language Native:
12.1% (291)Foreign-born:
82.8% (96)
White alone - Speak only English Native:
97.4% (13,829)Foreign-born:
63.6% (331)
White alone - Speak another language Native:
2.3% (333)Foreign-born:
41.5% (216)
Hispanic or Latino - Speak only English Native:
51.5% (731)Foreign-born:
15.3% (89)
Hispanic or Latino - Speak another language Native:
48.8% (692)Foreign-born:
87.6% (512)
Foreign-born residents in Salmon Creek 1,959 residents are foreign born (3.3% Asia , 3.1% Latin America , 1.7% Europe ).
This city:
9.4%Washington:
14.9%
Marital status for residents in Salmon Creek Marital status - White (Caucasian) population 15 years and over
Males 25.2% Never married59.9% Now married0.7% Separated5.1% Widowed9.2% DivorcedFemales 17.6% Never married51.4% Now married2.5% Separated11.5% Widowed17.0% DivorcedWomen who gave birth in the past 12 months Now married:
100.0% (105)Unmarried:
0.0% (0)
Women who did not give birth in the past 12 months Now married:
43.3% (1,357)Unmarried:
56.7% (1,776)
Marital status - Black or African American population 15 years and over
Males 59.8% Never married34.3% Now married5.9% Separated0.0% Widowed0.0% DivorcedFemales 55.1% Never married44.9% Now married0.0% Separated0.0% Widowed0.0% DivorcedWomen who gave birth in the past 12 months Now married:
100.0% (17)Unmarried:
0.0% (0)
Women who did not give birth in the past 12 months Now married:
0.0% (0)Unmarried:
100.0% (65)
Marital status - American Indian / Alaska Native population 15 years and over
Males 64.4% Never married35.6% Now married0.0% Separated0.0% Widowed0.0% DivorcedFemales 47.7% Never married52.3% Now married0.0% Separated0.0% Widowed0.0% DivorcedWomen who did not give birth in the past 12 months Now married:
0.0% (0)Unmarried:
100.0% (35)
Marital status - Asian population 15 years and over
Males 19.1% Never married67.7% Now married0.0% Separated13.2% Widowed0.0% DivorcedFemales 25.2% Never married69.7% Now married0.0% Separated5.1% Widowed0.0% DivorcedWomen who gave birth in the past 12 months Now married:
100.0% (37)Unmarried:
0.0% (0)
Women who did not give birth in the past 12 months Now married:
57.2% (105)Unmarried:
42.8% (79)
Marital status - Other race population 15 years and over
Males 61.7% Never married38.3% Now married0.0% Separated0.0% Widowed0.0% DivorcedFemales 52.6% Never married38.8% Now married3.1% Separated0.0% Widowed5.5% DivorcedWomen who did not give birth in the past 12 months Now married:
20.8% (46)Unmarried:
79.2% (177)
Marital status - Two or more races population 15 years and over
Males 60.4% Never married35.1% Now married3.3% Separated0.1% Widowed1.1% DivorcedFemales 47.7% Never married38.8% Now married0.0% Separated3.9% Widowed9.7% DivorcedWomen who gave birth in the past 12 months Now married:
17.6% (30)Unmarried:
82.4% (142)
Women who did not give birth in the past 12 months Now married:
38.7% (144)Unmarried:
61.3% (228)
Marital status - White alone, not Hispanic / Latino population 15 years and over
Males 24.0% Never married60.5% Now married0.7% Separated5.3% Widowed9.5% DivorcedFemales 17.6% Never married51.3% Now married2.6% Separated11.1% Widowed17.5% DivorcedWomen who gave birth in the past 12 months Now married:
100.0% (109)Unmarried:
0.0% (0)
Women who did not give birth in the past 12 months Now married:
41.7% (1,271)Unmarried:
58.3% (1,778)
Marital status - Hispanic or Latino population 15 years and over
Males 56.5% Never married43.5% Now married0.0% Separated0.0% Widowed0.0% DivorcedFemales 42.9% Never married45.3% Now married1.3% Separated8.5% Widowed1.9% DivorcedWomen who gave birth in the past 12 months Now married:
100.0% (24)Unmarried:
0.0% (0)
Women who did not give birth in the past 12 months Now married:
37.5% (202)Unmarried:
62.5% (336)
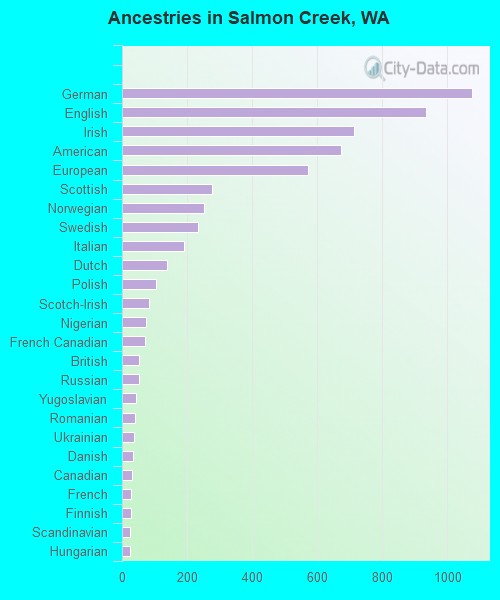
Ancestries in Salmon Creek
1,074 12.4% German934 10.8% English713 8.2% Irish672 7.7% American571 6.6% European278 3.2% Scottish253 2.9% Norwegian232 2.7% Swedish190 2.2% Italian138 1.6% Dutch103 1.2% Polish82 0.9% Scotch-Irish73 0.8% Nigerian70 0.8% French Canadian52 0.6% British52 0.6% Russian42 0.5% Yugoslavian40 0.5% Romanian36 0.4% Ukrainian34 0.4% Danish30 0.3% Canadian29 0.3% French27 0.3% Finnish25 0.3% Scandinavian24 0.3% Hungarian18 0.2% Eastern European13 0.1% Slovak12 0.1% Czech7 0.08% Portuguese7 0.08% Greek7 0.08% Swiss4 0.05% Slavic2 0.02% Lebanese1 0.01% Northern European
Children Nativity (place of birth) in Salmon Creek
Children under 6 years - Living with two parents Both parents native 783 100.0% NativeBoth parents foreign-born 145 100.0% NativeOne native, one foreign-born parent 40 100.0% NativeChildren under 6 years - Living with one parent Native parent 301 100.0% NativeChildren 6 to 17 years - Living with two parents Both parents native 1,629 99.0% Native17 1.0% Foreign-bornBoth parents foreign-born 176 73.5% Native63 26.5% Foreign-bornOne native, one foreign-born parent 191 100.0% NativeChildren 6 to 17 years - Living with one parent Native parent 383 96.1% Native15 3.9% Foreign-bornForeign-born parent 86 67.1% Native42 32.9% Foreign-born
Grandparents responsible for own grandchildren in Salmon Creek
Grandparents (30 to 59 years) White / Caucasian 42 52.1% Responsible for grandchildren39 47.9% Not responsible for grandchildrenAsian 18 100.0% Not responsible for grandchildrenTwo or more races 16 100.0% Responsible for grandchildrenWhite alone, not Hispanic / Latino 23 33.8% Responsible for grandchildren45 66.2% Not responsible for grandchildrenHispanic or Latino 38 100.0% Responsible for grandchildrenGrandparents (60 years and over) White / Caucasian 60 36.3% Responsible for grandchildren106 63.7% Not responsible for grandchildrenWhite alone, not Hispanic / Latino 64 36.5% Responsible for grandchildren111 63.5% Not responsible for grandchildren