Races in Rossville, Maryland (MD) Detailed Stats
Data:
Races - White alone (%)
Races - White alone (% change since 2000)
Races - Black alone (%)
Races - Black alone (% change since 2000)
Races - American Indian alone (%)
Races - American Indian alone (% change since 2000)
Races - Asian alone (%)
Races - Asian alone (% change since 2000)
Races - Hispanic (%)
Races - Hispanic (% change since 2000)
Races - Native Hawaiian and Other Pacific Islander alone (%)
Races - Native Hawaiian and Other Pacific Islander alone (% change since 2000)
Races - Two or more races(%)
Races - Two or more races(% change since 2000)
Races - Other race alone (%)
Races - Other race alone (% change since 2000)
Racial diversity
Place of birth - Born in state of residence (%)
Place of birth - Born in state of residence (%) - White
Place of birth - Born in state of residence (%) - Black or African American
Place of birth - Born in state of residence (%) - Asian
Place of birth - Born in state of residence (%) - Hispanic or Latino
Place of birth - Born in state of residence (%) - American Indian and Alaska Native
Place of birth - Born in state of residence (%) - Multirace
Place of birth - Born in state of residence (%) - Other Race
Place of birth - Born in other state (%)
Place of birth - Born in other state (%) - White
Place of birth - Born in other state (%) - Black or African American
Place of birth - Born in other state (%) - Asian
Place of birth - Born in other state (%) - Hispanic or Latino
Place of birth - Born in other state (%) - American Indian and Alaska Native
Place of birth - Born in other state (%) - Multirace
Place of birth - Born in other state (%) - Other Race
Place of birth - Native, outside of US (%)
Place of birth - Native, outside of US (%) - White
Place of birth - Native, outside of US (%) - Black or African American
Place of birth - Native, outside of US (%) - Asian
Place of birth - Native, outside of US (%) - Hispanic or Latino
Place of birth - Native, outside of US (%) - American Indian and Alaska Native
Place of birth - Native, outside of US (%) - Multirace
Place of birth - Native, outside of US (%) - Other Race
Place of birth - Foreign born (%)
Place of birth - Foreign born (%) - White
Place of birth - Foreign born (%) - Black or African American
Place of birth - Foreign born (%) - Asian
Place of birth - Foreign born (%) - Hispanic or Latino
Place of birth - Foreign born (%) - American Indian and Alaska Native
Place of birth - Foreign born (%) - Multirace
Place of birth - Foreign born (%) - Other Race
Residents speaking English at home (%)
Residents speaking English at home - Born in the United States (%)
Residents speaking English at home - Native, born elsewhere (%)
Residents speaking English at home - Foreign born (%)
Residents speaking Spanish at home (%)
Residents speaking Spanish at home - Born in the United States (%)
Residents speaking Spanish at home - Native, born elsewhere (%)
Residents speaking Spanish at home - Foreign born (%)
Residents speaking other language at home (%)
Residents speaking other language at home - Born in the United States (%)
Residents speaking other language at home - Native, born elsewhere (%)
Residents speaking other language at home - Foreign born (%)
Marital status - Never married (%)
Marital status - Now married (%)
Marital status - Separated (%)
Marital status - Widowed (%)
Marital status - Divorced (%)
Ancestries Reported - Arab (%)
Ancestries Reported - Czech (%)
Ancestries Reported - Danish (%)
Ancestries Reported - Dutch (%)
Ancestries Reported - English (%)
Ancestries Reported - French (%)
Ancestries Reported - French Canadian (%)
Ancestries Reported - German (%)
Ancestries Reported - Greek (%)
Ancestries Reported - Hungarian (%)
Ancestries Reported - Irish (%)
Ancestries Reported - Italian (%)
Ancestries Reported - Lithuanian (%)
Ancestries Reported - Norwegian (%)
Ancestries Reported - Polish (%)
Ancestries Reported - Portuguese (%)
Ancestries Reported - Russian (%)
Ancestries Reported - Scotch-Irish (%)
Ancestries Reported - Scottish (%)
Ancestries Reported - Slovak (%)
Ancestries Reported - Subsaharan African (%)
Ancestries Reported - Swedish (%)
Ancestries Reported - Swiss (%)
Ancestries Reported - Ukrainian (%)
Ancestries Reported - United States (%)
Ancestries Reported - Welsh (%)
Ancestries Reported - West Indian (%)
Ancestries Reported - Other (%)
Geographical mobility - Same house 1 year ago (%)
Geographical mobility - Same house 1 year ago (%) - White
Geographical mobility - Same house 1 year ago (%) - Black or African American
Geographical mobility - Same house 1 year ago (%) - Asian
Geographical mobility - Same house 1 year ago (%) - Hispanic or Latino
Geographical mobility - Same house 1 year ago (%) - American Indian and Alaska Native
Geographical mobility - Same house 1 year ago (%) - Multirace
Geographical mobility - Same house 1 year ago (%) - Other Race
Geographical mobility - Moved within same county (%)
Geographical mobility - Moved within same county (%) - White
Geographical mobility - Moved within same county (%) - Black or African American
Geographical mobility - Moved within same county (%) - Asian
Geographical mobility - Moved within same county (%) - Hispanic or Latino
Geographical mobility - Moved within same county (%) - American Indian and Alaska Native
Geographical mobility - Moved within same county (%) - Multirace
Geographical mobility - Moved within same county (%) - Other Race
Geographical mobility - Moved from different county within same state (%)
Geographical mobility - Moved from different county within same state (%) - White
Geographical mobility - Moved from different county within same state (%) - Black or African American
Geographical mobility - Moved from different county within same state (%) - Asian
Geographical mobility - Moved from different county within same state (%) - Hispanic or Latino
Geographical mobility - Moved from different county within same state (%) - American Indian and Alaska Native
Geographical mobility - Moved from different county within same state (%) - Multirace
Geographical mobility - Moved from different county within same state (%) - Other Race
Geographical mobility - Moved from different state (%)
Geographical mobility - Moved from different state (%) - White
Geographical mobility - Moved from different state (%) - Black or African American
Geographical mobility - Moved from different state (%) - Asian
Geographical mobility - Moved from different state (%) - Hispanic or Latino
Geographical mobility - Moved from different state (%) - American Indian and Alaska Native
Geographical mobility - Moved from different state (%) - Multirace
Geographical mobility - Moved from different state (%) - Other Race
Geographical mobility - Moved from abroad (%)
Geographical mobility - Moved from abroad (%) - White
Geographical mobility - Moved from abroad (%) - Black or African American
Geographical mobility - Moved from abroad (%) - Asian
Geographical mobility - Moved from abroad (%) - Hispanic or Latino
Geographical mobility - Moved from abroad (%) - American Indian and Alaska Native
Geographical mobility - Moved from abroad (%) - Multirace
Geographical mobility - Moved from abroad (%) - Other Race
Place of birth for the foreign-born population - Ireland (%)
Place of birth for the foreign-born population - Denmark (%)
Place of birth for the foreign-born population - Norway (%)
Place of birth for the foreign-born population - Sweden (%)
Place of birth for the foreign-born population - United Kingdom (%)
Place of birth for the foreign-born population - England (%)
Place of birth for the foreign-born population - Scotland (%)
Place of birth for the foreign-born population - Other Northern Europe (%)
Place of birth for the foreign-born population - Austria (%)
Place of birth for the foreign-born population - Belgium (%)
Place of birth for the foreign-born population - France (%)
Place of birth for the foreign-born population - Germany (%)
Place of birth for the foreign-born population - Netherlands (%)
Place of birth for the foreign-born population - Switzerland (%)
Place of birth for the foreign-born population - Other Western Europe (%)
Place of birth for the foreign-born population - Greece (%)
Place of birth for the foreign-born population - Italy (%)
Place of birth for the foreign-born population - Portugal (%)
Place of birth for the foreign-born population - Spain (%)
Place of birth for the foreign-born population - Other Southern Europe (%)
Place of birth for the foreign-born population - Albania (%)
Place of birth for the foreign-born population - Belarus (%)
Place of birth for the foreign-born population - Bosnia and Herzegovina (%)
Place of birth for the foreign-born population - Bulgaria (%)
Place of birth for the foreign-born population - Croatia (%)
Place of birth for the foreign-born population - Czechoslovakia (%)
Place of birth for the foreign-born population - Hungary (%)
Place of birth for the foreign-born population - Latvia (%)
Place of birth for the foreign-born population - Lithuania (%)
Place of birth for the foreign-born population - North Macedonia (Macedonia) (%)
Place of birth for the foreign-born population - Moldova (%)
Place of birth for the foreign-born population - Poland (%)
Place of birth for the foreign-born population - Romania (%)
Place of birth for the foreign-born population - Russia (%)
Place of birth for the foreign-born population - Serbia (%)
Place of birth for the foreign-born population - Ukraine (%)
Place of birth for the foreign-born population - Other Eastern Europe (%)
Place of birth for the foreign-born population - China (%)
Place of birth for the foreign-born population - Hong Kong (%)
Place of birth for the foreign-born population - Taiwan (%)
Place of birth for the foreign-born population - Japan (%)
Place of birth for the foreign-born population - Korea (%)
Place of birth for the foreign-born population - Other Eastern Asia (%)
Place of birth for the foreign-born population - Afghanistan (%)
Place of birth for the foreign-born population - Bangladesh (%)
Place of birth for the foreign-born population - India (%)
Place of birth for the foreign-born population - Iran (%)
Place of birth for the foreign-born population - Kazakhstan (%)
Place of birth for the foreign-born population - Nepal (%)
Place of birth for the foreign-born population - Pakistan (%)
Place of birth for the foreign-born population - Sri Lanka (%)
Place of birth for the foreign-born population - Uzbekistan (%)
Place of birth for the foreign-born population - Other South Central Asia (%)
Place of birth for the foreign-born population - Burma (%)
Place of birth for the foreign-born population - Cambodia (%)
Place of birth for the foreign-born population - Indonesia (%)
Place of birth for the foreign-born population - Laos (%)
Place of birth for the foreign-born population - Malaysia (%)
Place of birth for the foreign-born population - Philippines (%)
Place of birth for the foreign-born population - Singapore (%)
Place of birth for the foreign-born population - Thailand (%)
Place of birth for the foreign-born population - Vietnam (%)
Place of birth for the foreign-born population - Other South Eastern Asia (%)
Place of birth for the foreign-born population - Armenia (%)
Place of birth for the foreign-born population - Iraq (%)
Place of birth for the foreign-born population - Israel (%)
Place of birth for the foreign-born population - Jordan (%)
Place of birth for the foreign-born population - Kuwait (%)
Place of birth for the foreign-born population - Lebanon (%)
Place of birth for the foreign-born population - Saudi Arabia (%)
Place of birth for the foreign-born population - Syria (%)
Place of birth for the foreign-born population - Turkey (%)
Place of birth for the foreign-born population - Yemen (%)
Place of birth for the foreign-born population - Other Western Asia (%)
Place of birth for the foreign-born population - Eritrea (%)
Place of birth for the foreign-born population - Ethiopia (%)
Place of birth for the foreign-born population - Kenya (%)
Place of birth for the foreign-born population - Somalia (%)
Place of birth for the foreign-born population - Uganda (%)
Place of birth for the foreign-born population - Zimbabwe (%)
Place of birth for the foreign-born population - Other Eastern Africa (%)
Place of birth for the foreign-born population - Cameroon (%)
Place of birth for the foreign-born population - Congo (%)
Place of birth for the foreign-born population - Democratic Republic of Congo (Zaire) (%)
Place of birth for the foreign-born population - Other Middle Africa (%)
Place of birth for the foreign-born population - Egypt (%)
Place of birth for the foreign-born population - Morocco (%)
Place of birth for the foreign-born population - Sudan (%)
Place of birth for the foreign-born population - Other Northern Africa (%)
Place of birth for the foreign-born population - South Africa (%)
Place of birth for the foreign-born population - Other Southern Africa (%)
Place of birth for the foreign-born population - Cabo Verde (%)
Place of birth for the foreign-born population - Ghana (%)
Place of birth for the foreign-born population - Liberia (%)
Place of birth for the foreign-born population - Nigeria (%)
Place of birth for the foreign-born population - Senegal (%)
Place of birth for the foreign-born population - Sierra Leone (%)
Place of birth for the foreign-born population - Other Western Africa (%)
Place of birth for the foreign-born population - Australia (%)
Place of birth for the foreign-born population - New Zealand (%)
Place of birth for the foreign-born population - Fiji (%)
Place of birth for the foreign-born population - Micronesia (%)
Place of birth for the foreign-born population - Bahamas (%)
Place of birth for the foreign-born population - Barbados (%)
Place of birth for the foreign-born population - Cuba (%)
Place of birth for the foreign-born population - Dominica (%)
Place of birth for the foreign-born population - Dominican Republic (%)
Place of birth for the foreign-born population - Grenada (%)
Place of birth for the foreign-born population - Haiti (%)
Place of birth for the foreign-born population - Jamaica (%)
Place of birth for the foreign-born population - St. Vincent and the Grenadines (%)
Place of birth for the foreign-born population - Trinidad and Tobago (%)
Place of birth for the foreign-born population - West Indies (%)
Place of birth for the foreign-born population - Other Caribbean (%)
Place of birth for the foreign-born population - Belize (%)
Place of birth for the foreign-born population - Costa Rica (%)
Place of birth for the foreign-born population - El Salvador (%)
Place of birth for the foreign-born population - Guatemala (%)
Place of birth for the foreign-born population - Honduras (%)
Place of birth for the foreign-born population - Mexico (%)
Place of birth for the foreign-born population - Nicaragua (%)
Place of birth for the foreign-born population - Panama (%)
Place of birth for the foreign-born population - Other Central America (%)
Place of birth for the foreign-born population - Argentina (%)
Place of birth for the foreign-born population - Bolivia (%)
Place of birth for the foreign-born population - Brazil (%)
Place of birth for the foreign-born population - Chile (%)
Place of birth for the foreign-born population - Colombia (%)
Place of birth for the foreign-born population - Ecuador (%)
Place of birth for the foreign-born population - Guyana (%)
Place of birth for the foreign-born population - Peru (%)
Place of birth for the foreign-born population - Uruguay (%)
Place of birth for the foreign-born population - Venezuela (%)
Place of birth for the foreign-born population - Other South America (%)
Place of birth for the foreign-born population - Canada (%)
Place of birth for the foreign-born population - Other Northern America (%)
Place of birth for the foreign-born population - Other (%)
Latest news about races in Rossville, MD collected exclusively by city-data.com from local newspapers, TV, and radio stations
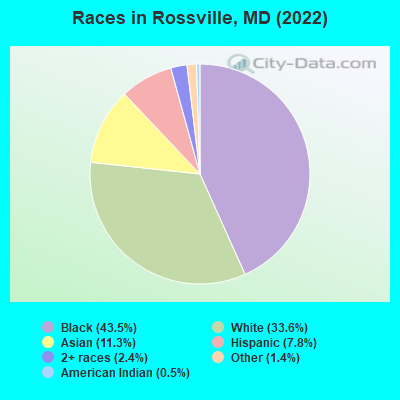
According to 2022 data, the most numerous races in Rossville, MD are White alone (5,180 residents), Black alone (6,707 residents), and Hispanic (1,210 residents). 75.9% of Rossville residents speak English at home. 21.4% of Rossville, MD residents are foreign-born (8.3% born in Asia, 6.8% born in Africa, 3.6% born in Latin America), which is 25.1% greater than the foreign-born rate of 16.0% across the entire state of Maryland.
Race distribution in Rossville
2000 2022
3,286,547 62.1% White alone 1,464,735 27.7% Black alone 227,916 4.3% Hispanic 209,738 4.0% Asian alone 82,946 1.6% Two or more races 13,312 0.3% American Indian alone 9,379 0.2% Other race alone 1,913 0.04% Native Hawaiian and Other
2,906,492 47.1% White alone 1,800,914 29.2% Black alone 705,842 11.4% Hispanic 401,818 6.5% Asian alone 291,317 4.7% Two or more races 46,930 0.8% Other race alone 8,930 0.1% American Indian alone 2,417 0.04% Native Hawaiian and Other
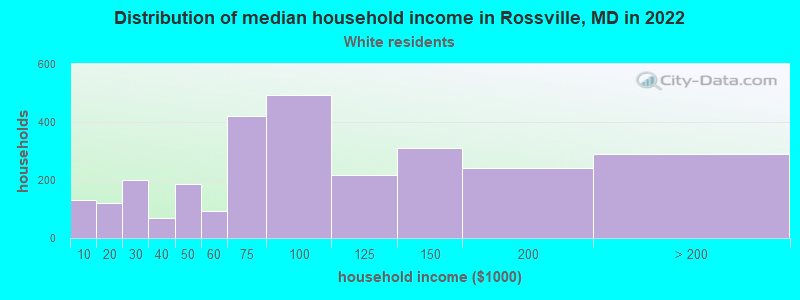
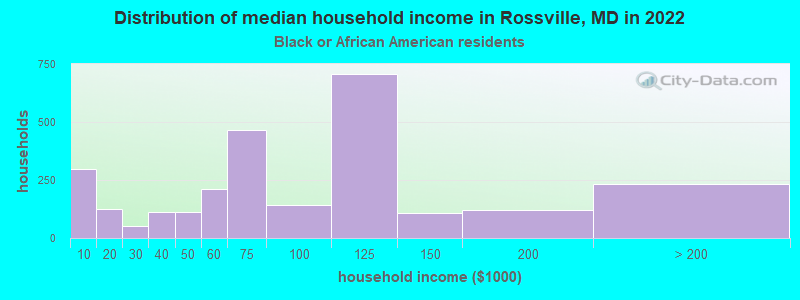
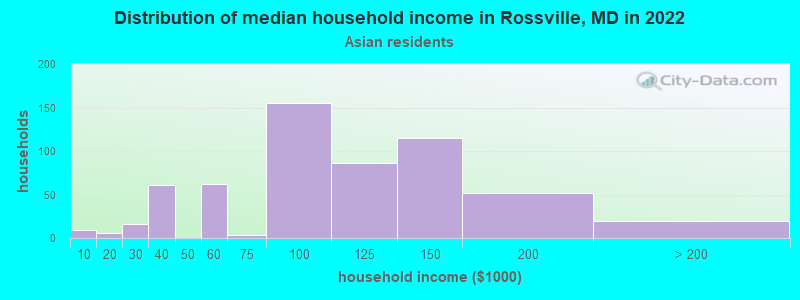
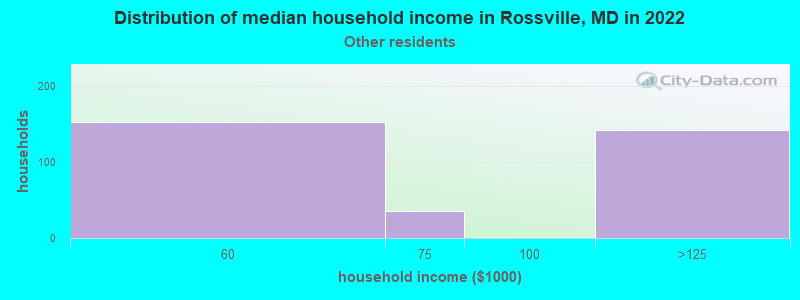
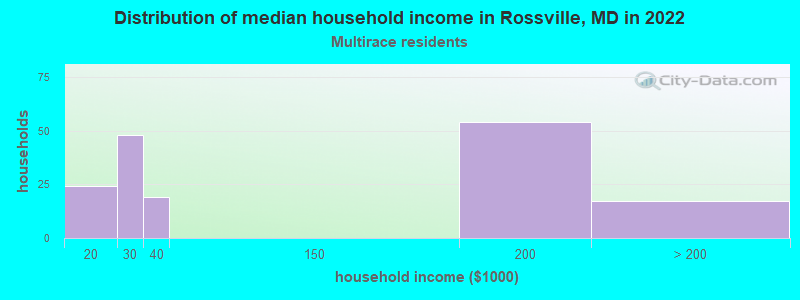
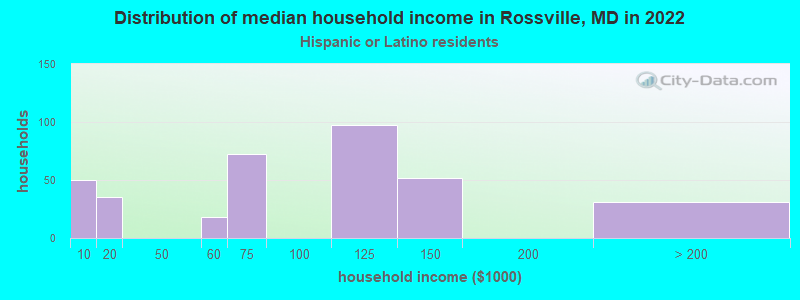
Income and house value in Rossville Median household income in 2022 $81,685 White non-Hispanic householders$73,655 Black householders$96,522 Asian householders$106,858 Some other race householders$94,649 Hispanic or Latino race householdersMedian 2022 house value $296,048 White Non-Hispanic householders$316,035 Black or African American householders$281,059 American Indian or Alaska Native householders $173,632 Asian householders$281,059 Some other race householders$274,063 Two or more races householders$274,563 Hispanic or Latino householders
Median age by race in Rossville
44.8 Median age for White residents37.6 51.5 35.1 Median age for Black or African American residents31.6 36.6 31.1 Median age for American Indian / Alaska Native residents-867,632,849.4 27.8 41.1 Median age for Asian residents40.0 42.9 -1,541,125,539.6 Median age for Native Hawaiian / Pacific Islander residents-790,901,136.6 -760,942,760.2 40.1 Median age for Other race residents43.6 28.3 33.5 Median age for Two or more races residents45.0 22.2 45.5 Median age for White alone residents39.1 51.5 35.6 Median age for Hispanic or Latino residents36.4 28.7
Owner/renter occupied households by race in Rossville
House owners and renters - White residents 1,926 69.9% Owner occupied828 30.1% Renter occupiedHouse owners and renters - Black or African American residents 987 37.5% Owner occupied1,644 62.5% Renter occupiedHouse owners and renters - Asian residents 447 82.4% Owner occupied95 17.6% Renter occupiedHouse owners and renters - Other race residents 17 4.8% Owner occupied337 95.2% Renter occupiedHouse owners and renters - Two or more races residents 186 100.0% Owner occupiedHouse owners and renters - White alone residents 1,907 72.8% Owner occupied713 27.2% Renter occupiedHouse owners and renters - Hispanic or Latino residents 48 11.9% Owner occupied351 88.1% Renter occupied
Language usage in Rossville
English speakers - Total 75.9% of residents of Rossville speak English at home.
5.6% of residents speak Spanish at home 616 76.4% Speak English very well190 23.6% Speak English less than very well18.0% of residents speak other language at home 1,575 60.5% Speak English very well1,027 39.5% Speak English less than very well
English speakers - Born in the United States 90.4% of residents of Rossville speak English at home.
9.0% of residents speak Spanish at home 244 92.4% Speak English very well20 7.6% Speak English less than very well0.9% of residents speak other language at home 27 100.0% Speak English very well
English speakers - Native, born elsewhere 42.7% of residents of Rossville speak English at home.
2.1% of residents speak Spanish at home 5 100.0% Speak English less than very well33.2% of residents speak other language at home 14 17.5% Speak English very well66 82.5% Speak English less than very well
English speakers - Foreign-born 23.1% of residents of Rossville speak English at home.
7.9% of residents speak Spanish at home 74 29.2% Speak English very well179 70.8% Speak English less than very well68.0% of residents speak other language at home 1,332 61.0% Speak English very well852 39.0% Speak English less than very well
White (Caucasian) - Speak only English Native:
94.7% (4,786)Foreign-born:
21.8% (72)
White (Caucasian) - Speak another language Native:
4.6% (233)Foreign-born:
77.7% (256)
Black or African American - Speak only English Native:
95.8% (4,583)Foreign-born:
42.2% (568)
Black or African American - Speak another language Native:
3.8% (181)Foreign-born:
56.5% (761)
Asian - Speak only English Native:
60.0% (203)Foreign-born:
5.5% (74)
Asian - Speak another language Native:
40.2% (136)Foreign-born:
93.5% (1,266)
Other race - Speak another language Native:
64.1% (480)Foreign-born:
100.0% (15)
Two or more races - Speak only English Native:
97.3% (411)Foreign-born:
92.0% (54)
Two or more races - Speak another language Native:
5.1% (21)Foreign-born:
30.1% (17)
White alone - Speak only English Native:
94.1% (4,679)Foreign-born:
44.1% (49)
White alone - Speak another language Native:
5.2% (256)Foreign-born:
55.0% (61)
Hispanic or Latino - Speak only English Native:
50.4% (399)Foreign-born:
8.6% (25)
Hispanic or Latino - Speak another language Native:
47.6% (376)Foreign-born:
91.4% (260)
Foreign-born residents in Rossville 3,295 residents are foreign born (8.3% Asia , 6.8% Africa , 3.6% Latin America ).
This city:
21.4%Maryland:
15.7%
Marital status for residents in Rossville Marital status - White (Caucasian) population 15 years and over
Males 38.0% Never married47.8% Now married0.0% Separated4.8% Widowed9.3% DivorcedFemales 23.8% Never married46.2% Now married0.2% Separated12.7% Widowed17.1% DivorcedWomen who gave birth in the past 12 months Now married:
100.0% (15)Unmarried:
0.0% (0)
Women who did not give birth in the past 12 months Now married:
45.1% (508)Unmarried:
54.9% (618)
Marital status - Black or African American population 15 years and over
Males 45.3% Never married32.5% Now married4.1% Separated0.5% Widowed17.6% DivorcedFemales 55.2% Never married31.3% Now married0.0% Separated4.3% Widowed9.2% DivorcedWomen who gave birth in the past 12 months Now married:
36.4% (60)Unmarried:
63.6% (105)
Women who did not give birth in the past 12 months Now married:
20.3% (420)Unmarried:
79.7% (1,649)
Marital status - American Indian / Alaska Native population 15 years and over
Males 100.0% Never married0.0% Now married0.0% Separated0.0% Widowed0.0% DivorcedFemales 57.4% Never married42.6% Now married0.0% Separated0.0% Widowed0.0% DivorcedWomen who did not give birth in the past 12 months Now married:
0.0% (0)Unmarried:
100.0% (46)
Marital status - Asian population 15 years and over
Males 36.4% Never married58.3% Now married0.0% Separated2.2% Widowed3.1% DivorcedFemales 26.6% Never married61.7% Now married0.0% Separated4.5% Widowed7.2% DivorcedWomen who gave birth in the past 12 months Now married:
100.0% (21)Unmarried:
0.0% (0)
Women who did not give birth in the past 12 months Now married:
62.2% (281)Unmarried:
37.8% (171)
Marital status - Other race population 15 years and over
Males 74.5% Never married15.9% Now married0.0% Separated9.6% Widowed0.0% DivorcedFemales 85.0% Never married15.0% Now married0.0% Separated0.0% Widowed0.0% DivorcedWomen who gave birth in the past 12 months Now married:
23.9% (40)Unmarried:
76.1% (126)
Women who did not give birth in the past 12 months Now married:
21.2% (10)Unmarried:
78.8% (38)
Marital status - Two or more races population 15 years and over
Males 26.8% Never married26.3% Now married0.0% Separated14.4% Widowed32.5% DivorcedFemales 63.6% Never married28.9% Now married0.0% Separated7.4% Widowed0.0% DivorcedWomen who did not give birth in the past 12 months Now married:
0.0% (0)Unmarried:
100.0% (98)
Marital status - White alone, not Hispanic / Latino population 15 years and over
Males 39.5% Never married45.2% Now married0.0% Separated5.2% Widowed10.2% DivorcedFemales 25.1% Never married45.6% Now married0.2% Separated13.4% Widowed15.8% DivorcedWomen who gave birth in the past 12 months Now married:
100.0% (15)Unmarried:
0.0% (0)
Women who did not give birth in the past 12 months Now married:
43.9% (473)Unmarried:
56.1% (606)
Marital status - Hispanic or Latino population 15 years and over
Males 49.3% Never married40.5% Now married0.0% Separated0.0% Widowed10.3% DivorcedFemales 43.6% Never married34.1% Now married0.0% Separated0.0% Widowed22.3% DivorcedWomen who gave birth in the past 12 months Now married:
100.0% (29)Unmarried:
0.0% (0)
Women who did not give birth in the past 12 months Now married:
38.4% (51)Unmarried:
61.6% (83)
Ancestries in Rossville
777 7.9% Nigerian498 5.1% German497 5.1% Ethiopian411 4.2% English409 4.2% Palestinian296 3.0% American256 2.6% Kenyan250 2.6% Polish235 2.4% Irish213 2.2% African137 1.4% Italian49 0.5% Russian44 0.4% European40 0.4% Jamaican31 0.3% Liberian28 0.3% Armenian27 0.3% Scottish24 0.2% Greek16 0.2% British16 0.2% Eastern European16 0.2% Trinidadian and Tobagonian15 0.2% Norwegian14 0.1% Hungarian12 0.1% Northern European11 0.1% Welsh6 0.06% Czech
Geographical mobility in Rossville Same house 1 year ago 4,535 81.9% White (Caucasian)4,751 71.9% Black or African American110 98.9% American Indian / Alaska Native1,649 95.5% Asian426 58.8% Other race211 41.7% Two or more races4,345 84.2% White alone, not Hispanic / Latino816 68.8% Hispanic or LatinoMoved within same county 408 7.4% White / Caucasian1,283 19.4% Black or African American42 2.4% Asian211 29.1% Other race59 11.6% Two or more races429 8.3% White alone, not Hispanic / Latino116 9.8% Hispanic or LatinoMoved within same state 185 3.3% White / Caucasian394 6.0% Black or African American32 1.8% Asian25 3.4% Other race135 2.6% White alone, not Hispanic / Latino47 4.0% Hispanic or LatinoMoved from different state 238 4.3% White / Caucasian51 0.8% Black or African American187 37.0% Two or more races239 4.6% White alone, not Hispanic / Latino57 4.8% Hispanic or LatinoMoved from abroad 205 3.7% White107 1.6% Black or African American14 0.3% White alone, not Hispanic / Latino235 19.8% Hispanic or Latino
Children Nativity (place of birth) in Rossville
Children under 6 years - Living with two parents Both parents native 292 88.6% Native38 11.4% Foreign-bornBoth parents foreign-born 438 71.2% Native177 28.8% Foreign-bornChildren under 6 years - Living with one parent Native parent 349 100.0% NativeChildren 6 to 17 years - Living with two parents Both parents native 367 100.0% NativeBoth parents foreign-born 320 92.6% Native25 7.4% Foreign-bornOne native, one foreign-born parent 29 100.0% NativeChildren 6 to 17 years - Living with one parent Native parent 387 100.0% NativeForeign-born parent 22 50.5% Native22 49.5% Foreign-born
Grandparents responsible for own grandchildren in Rossville
Grandparents (30 to 59 years) White / Caucasian 7 30.7% Responsible for grandchildren16 69.3% Not responsible for grandchildrenBlack or African American 31 51.9% Responsible for grandchildren29 48.1% Not responsible for grandchildrenAmerican Indian / Alaska Native 25 100.0% Not responsible for grandchildrenWhite alone, not Hispanic / Latino 7 31.5% Responsible for grandchildren15 68.5% Not responsible for grandchildren
Grandparents (60 years and over) White / Caucasian 90 100.0% Not responsible for grandchildrenBlack or African American 151 100.0% Not responsible for grandchildrenWhite alone, not Hispanic / Latino 14 100.0% Not responsible for grandchildren