Races in Roselle Park, New Jersey (NJ) Detailed Stats
Data:
Races - White alone (%)
Races - White alone (% change since 2000)
Races - Black alone (%)
Races - Black alone (% change since 2000)
Races - American Indian alone (%)
Races - American Indian alone (% change since 2000)
Races - Asian alone (%)
Races - Asian alone (% change since 2000)
Races - Hispanic (%)
Races - Hispanic (% change since 2000)
Races - Native Hawaiian and Other Pacific Islander alone (%)
Races - Native Hawaiian and Other Pacific Islander alone (% change since 2000)
Races - Two or more races(%)
Races - Two or more races(% change since 2000)
Races - Other race alone (%)
Races - Other race alone (% change since 2000)
Racial diversity
Place of birth - Born in state of residence (%)
Place of birth - Born in state of residence (%) - White
Place of birth - Born in state of residence (%) - Black or African American
Place of birth - Born in state of residence (%) - Asian
Place of birth - Born in state of residence (%) - Hispanic or Latino
Place of birth - Born in state of residence (%) - American Indian and Alaska Native
Place of birth - Born in state of residence (%) - Multirace
Place of birth - Born in state of residence (%) - Other Race
Place of birth - Born in other state (%)
Place of birth - Born in other state (%) - White
Place of birth - Born in other state (%) - Black or African American
Place of birth - Born in other state (%) - Asian
Place of birth - Born in other state (%) - Hispanic or Latino
Place of birth - Born in other state (%) - American Indian and Alaska Native
Place of birth - Born in other state (%) - Multirace
Place of birth - Born in other state (%) - Other Race
Place of birth - Native, outside of US (%)
Place of birth - Native, outside of US (%) - White
Place of birth - Native, outside of US (%) - Black or African American
Place of birth - Native, outside of US (%) - Asian
Place of birth - Native, outside of US (%) - Hispanic or Latino
Place of birth - Native, outside of US (%) - American Indian and Alaska Native
Place of birth - Native, outside of US (%) - Multirace
Place of birth - Native, outside of US (%) - Other Race
Place of birth - Foreign born (%)
Place of birth - Foreign born (%) - White
Place of birth - Foreign born (%) - Black or African American
Place of birth - Foreign born (%) - Asian
Place of birth - Foreign born (%) - Hispanic or Latino
Place of birth - Foreign born (%) - American Indian and Alaska Native
Place of birth - Foreign born (%) - Multirace
Place of birth - Foreign born (%) - Other Race
Residents speaking English at home (%)
Residents speaking English at home - Born in the United States (%)
Residents speaking English at home - Native, born elsewhere (%)
Residents speaking English at home - Foreign born (%)
Residents speaking Spanish at home (%)
Residents speaking Spanish at home - Born in the United States (%)
Residents speaking Spanish at home - Native, born elsewhere (%)
Residents speaking Spanish at home - Foreign born (%)
Residents speaking other language at home (%)
Residents speaking other language at home - Born in the United States (%)
Residents speaking other language at home - Native, born elsewhere (%)
Residents speaking other language at home - Foreign born (%)
Marital status - Never married (%)
Marital status - Now married (%)
Marital status - Separated (%)
Marital status - Widowed (%)
Marital status - Divorced (%)
Ancestries Reported - Arab (%)
Ancestries Reported - Czech (%)
Ancestries Reported - Danish (%)
Ancestries Reported - Dutch (%)
Ancestries Reported - English (%)
Ancestries Reported - French (%)
Ancestries Reported - French Canadian (%)
Ancestries Reported - German (%)
Ancestries Reported - Greek (%)
Ancestries Reported - Hungarian (%)
Ancestries Reported - Irish (%)
Ancestries Reported - Italian (%)
Ancestries Reported - Lithuanian (%)
Ancestries Reported - Norwegian (%)
Ancestries Reported - Polish (%)
Ancestries Reported - Portuguese (%)
Ancestries Reported - Russian (%)
Ancestries Reported - Scotch-Irish (%)
Ancestries Reported - Scottish (%)
Ancestries Reported - Slovak (%)
Ancestries Reported - Subsaharan African (%)
Ancestries Reported - Swedish (%)
Ancestries Reported - Swiss (%)
Ancestries Reported - Ukrainian (%)
Ancestries Reported - United States (%)
Ancestries Reported - Welsh (%)
Ancestries Reported - West Indian (%)
Ancestries Reported - Other (%)
Geographical mobility - Same house 1 year ago (%)
Geographical mobility - Same house 1 year ago (%) - White
Geographical mobility - Same house 1 year ago (%) - Black or African American
Geographical mobility - Same house 1 year ago (%) - Asian
Geographical mobility - Same house 1 year ago (%) - Hispanic or Latino
Geographical mobility - Same house 1 year ago (%) - American Indian and Alaska Native
Geographical mobility - Same house 1 year ago (%) - Multirace
Geographical mobility - Same house 1 year ago (%) - Other Race
Geographical mobility - Moved within same county (%)
Geographical mobility - Moved within same county (%) - White
Geographical mobility - Moved within same county (%) - Black or African American
Geographical mobility - Moved within same county (%) - Asian
Geographical mobility - Moved within same county (%) - Hispanic or Latino
Geographical mobility - Moved within same county (%) - American Indian and Alaska Native
Geographical mobility - Moved within same county (%) - Multirace
Geographical mobility - Moved within same county (%) - Other Race
Geographical mobility - Moved from different county within same state (%)
Geographical mobility - Moved from different county within same state (%) - White
Geographical mobility - Moved from different county within same state (%) - Black or African American
Geographical mobility - Moved from different county within same state (%) - Asian
Geographical mobility - Moved from different county within same state (%) - Hispanic or Latino
Geographical mobility - Moved from different county within same state (%) - American Indian and Alaska Native
Geographical mobility - Moved from different county within same state (%) - Multirace
Geographical mobility - Moved from different county within same state (%) - Other Race
Geographical mobility - Moved from different state (%)
Geographical mobility - Moved from different state (%) - White
Geographical mobility - Moved from different state (%) - Black or African American
Geographical mobility - Moved from different state (%) - Asian
Geographical mobility - Moved from different state (%) - Hispanic or Latino
Geographical mobility - Moved from different state (%) - American Indian and Alaska Native
Geographical mobility - Moved from different state (%) - Multirace
Geographical mobility - Moved from different state (%) - Other Race
Geographical mobility - Moved from abroad (%)
Geographical mobility - Moved from abroad (%) - White
Geographical mobility - Moved from abroad (%) - Black or African American
Geographical mobility - Moved from abroad (%) - Asian
Geographical mobility - Moved from abroad (%) - Hispanic or Latino
Geographical mobility - Moved from abroad (%) - American Indian and Alaska Native
Geographical mobility - Moved from abroad (%) - Multirace
Geographical mobility - Moved from abroad (%) - Other Race
Place of birth for the foreign-born population - Ireland (%)
Place of birth for the foreign-born population - Denmark (%)
Place of birth for the foreign-born population - Norway (%)
Place of birth for the foreign-born population - Sweden (%)
Place of birth for the foreign-born population - United Kingdom (%)
Place of birth for the foreign-born population - England (%)
Place of birth for the foreign-born population - Scotland (%)
Place of birth for the foreign-born population - Other Northern Europe (%)
Place of birth for the foreign-born population - Austria (%)
Place of birth for the foreign-born population - Belgium (%)
Place of birth for the foreign-born population - France (%)
Place of birth for the foreign-born population - Germany (%)
Place of birth for the foreign-born population - Netherlands (%)
Place of birth for the foreign-born population - Switzerland (%)
Place of birth for the foreign-born population - Other Western Europe (%)
Place of birth for the foreign-born population - Greece (%)
Place of birth for the foreign-born population - Italy (%)
Place of birth for the foreign-born population - Portugal (%)
Place of birth for the foreign-born population - Spain (%)
Place of birth for the foreign-born population - Other Southern Europe (%)
Place of birth for the foreign-born population - Albania (%)
Place of birth for the foreign-born population - Belarus (%)
Place of birth for the foreign-born population - Bosnia and Herzegovina (%)
Place of birth for the foreign-born population - Bulgaria (%)
Place of birth for the foreign-born population - Croatia (%)
Place of birth for the foreign-born population - Czechoslovakia (%)
Place of birth for the foreign-born population - Hungary (%)
Place of birth for the foreign-born population - Latvia (%)
Place of birth for the foreign-born population - Lithuania (%)
Place of birth for the foreign-born population - North Macedonia (Macedonia) (%)
Place of birth for the foreign-born population - Moldova (%)
Place of birth for the foreign-born population - Poland (%)
Place of birth for the foreign-born population - Romania (%)
Place of birth for the foreign-born population - Russia (%)
Place of birth for the foreign-born population - Serbia (%)
Place of birth for the foreign-born population - Ukraine (%)
Place of birth for the foreign-born population - Other Eastern Europe (%)
Place of birth for the foreign-born population - China (%)
Place of birth for the foreign-born population - Hong Kong (%)
Place of birth for the foreign-born population - Taiwan (%)
Place of birth for the foreign-born population - Japan (%)
Place of birth for the foreign-born population - Korea (%)
Place of birth for the foreign-born population - Other Eastern Asia (%)
Place of birth for the foreign-born population - Afghanistan (%)
Place of birth for the foreign-born population - Bangladesh (%)
Place of birth for the foreign-born population - India (%)
Place of birth for the foreign-born population - Iran (%)
Place of birth for the foreign-born population - Kazakhstan (%)
Place of birth for the foreign-born population - Nepal (%)
Place of birth for the foreign-born population - Pakistan (%)
Place of birth for the foreign-born population - Sri Lanka (%)
Place of birth for the foreign-born population - Uzbekistan (%)
Place of birth for the foreign-born population - Other South Central Asia (%)
Place of birth for the foreign-born population - Burma (%)
Place of birth for the foreign-born population - Cambodia (%)
Place of birth for the foreign-born population - Indonesia (%)
Place of birth for the foreign-born population - Laos (%)
Place of birth for the foreign-born population - Malaysia (%)
Place of birth for the foreign-born population - Philippines (%)
Place of birth for the foreign-born population - Singapore (%)
Place of birth for the foreign-born population - Thailand (%)
Place of birth for the foreign-born population - Vietnam (%)
Place of birth for the foreign-born population - Other South Eastern Asia (%)
Place of birth for the foreign-born population - Armenia (%)
Place of birth for the foreign-born population - Iraq (%)
Place of birth for the foreign-born population - Israel (%)
Place of birth for the foreign-born population - Jordan (%)
Place of birth for the foreign-born population - Kuwait (%)
Place of birth for the foreign-born population - Lebanon (%)
Place of birth for the foreign-born population - Saudi Arabia (%)
Place of birth for the foreign-born population - Syria (%)
Place of birth for the foreign-born population - Turkey (%)
Place of birth for the foreign-born population - Yemen (%)
Place of birth for the foreign-born population - Other Western Asia (%)
Place of birth for the foreign-born population - Eritrea (%)
Place of birth for the foreign-born population - Ethiopia (%)
Place of birth for the foreign-born population - Kenya (%)
Place of birth for the foreign-born population - Somalia (%)
Place of birth for the foreign-born population - Uganda (%)
Place of birth for the foreign-born population - Zimbabwe (%)
Place of birth for the foreign-born population - Other Eastern Africa (%)
Place of birth for the foreign-born population - Cameroon (%)
Place of birth for the foreign-born population - Congo (%)
Place of birth for the foreign-born population - Democratic Republic of Congo (Zaire) (%)
Place of birth for the foreign-born population - Other Middle Africa (%)
Place of birth for the foreign-born population - Egypt (%)
Place of birth for the foreign-born population - Morocco (%)
Place of birth for the foreign-born population - Sudan (%)
Place of birth for the foreign-born population - Other Northern Africa (%)
Place of birth for the foreign-born population - South Africa (%)
Place of birth for the foreign-born population - Other Southern Africa (%)
Place of birth for the foreign-born population - Cabo Verde (%)
Place of birth for the foreign-born population - Ghana (%)
Place of birth for the foreign-born population - Liberia (%)
Place of birth for the foreign-born population - Nigeria (%)
Place of birth for the foreign-born population - Senegal (%)
Place of birth for the foreign-born population - Sierra Leone (%)
Place of birth for the foreign-born population - Other Western Africa (%)
Place of birth for the foreign-born population - Australia (%)
Place of birth for the foreign-born population - New Zealand (%)
Place of birth for the foreign-born population - Fiji (%)
Place of birth for the foreign-born population - Micronesia (%)
Place of birth for the foreign-born population - Bahamas (%)
Place of birth for the foreign-born population - Barbados (%)
Place of birth for the foreign-born population - Cuba (%)
Place of birth for the foreign-born population - Dominica (%)
Place of birth for the foreign-born population - Dominican Republic (%)
Place of birth for the foreign-born population - Grenada (%)
Place of birth for the foreign-born population - Haiti (%)
Place of birth for the foreign-born population - Jamaica (%)
Place of birth for the foreign-born population - St. Vincent and the Grenadines (%)
Place of birth for the foreign-born population - Trinidad and Tobago (%)
Place of birth for the foreign-born population - West Indies (%)
Place of birth for the foreign-born population - Other Caribbean (%)
Place of birth for the foreign-born population - Belize (%)
Place of birth for the foreign-born population - Costa Rica (%)
Place of birth for the foreign-born population - El Salvador (%)
Place of birth for the foreign-born population - Guatemala (%)
Place of birth for the foreign-born population - Honduras (%)
Place of birth for the foreign-born population - Mexico (%)
Place of birth for the foreign-born population - Nicaragua (%)
Place of birth for the foreign-born population - Panama (%)
Place of birth for the foreign-born population - Other Central America (%)
Place of birth for the foreign-born population - Argentina (%)
Place of birth for the foreign-born population - Bolivia (%)
Place of birth for the foreign-born population - Brazil (%)
Place of birth for the foreign-born population - Chile (%)
Place of birth for the foreign-born population - Colombia (%)
Place of birth for the foreign-born population - Ecuador (%)
Place of birth for the foreign-born population - Guyana (%)
Place of birth for the foreign-born population - Peru (%)
Place of birth for the foreign-born population - Uruguay (%)
Place of birth for the foreign-born population - Venezuela (%)
Place of birth for the foreign-born population - Other South America (%)
Place of birth for the foreign-born population - Canada (%)
Place of birth for the foreign-born population - Other Northern America (%)
Place of birth for the foreign-born population - Other (%)
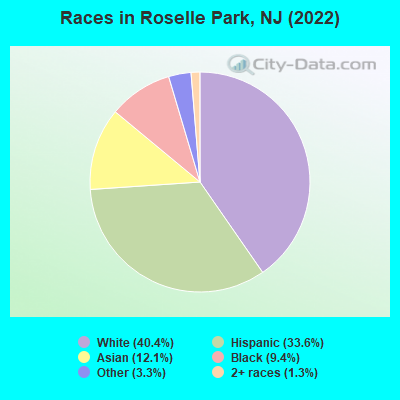
According to 2022 data, the most numerous races in Roselle Park, NJ are White alone (5,620 residents), Hispanic (4,675 residents), and Black alone (1,306 residents). 55.0% of Roselle Park residents speak English at home. 34.3% of Roselle Park, NJ residents are foreign-born (18.4% born in Latin America, 10.1% born in Asia, 3.5% born in Europe), which is 33.0% greater than the foreign-born rate of 23.0% across the entire state of New Jersey.
Race distribution in Roselle Park
2000 2022
5,557,209 66.0% White alone 1,117,191 13.3% Hispanic 1,096,171 13.0% Black alone 477,012 5.7% Asian alone 133,689 1.6% Two or more races 19,565 0.2% Other race alone 11,338 0.1% American Indian alone 2,175 0.03% Native Hawaiian and Other
4,766,476 51.5% White alone 2,028,470 21.9% Hispanic 1,111,632 12.0% Black alone 923,546 10.0% Asian alone 332,237 3.6% Two or more races 89,847 1.0% Other race alone 8,557 0.09% American Indian alone 934 0.01% Native Hawaiian and Other
Income and house value in Roselle Park Median household income in 2022 $98,239 White non-Hispanic householders$91,229 Black householders$133,348 Asian householders$87,185 Some other race householders$93,022 Two or more races householders$105,934 Hispanic or Latino race householdersMedian 2022 house value $391,379 White Non-Hispanic householders$363,370 Black or African American householders $441,199 Asian householders$349,737 Some other race householders$340,814 Two or more races householders$369,814 Hispanic or Latino householders
Median age by race in Roselle Park
40.4 Median age for White residents43.4 37.9 41.4 Median age for Black or African American residents45.4 38.5 -656,626,505.4 Median age for American Indian / Alaska Native residents-749,529,189.5 -612,668,742.9 43.6 Median age for Asian residents43.7 44.7 -1,010,045,661.1 Median age for Native Hawaiian / Pacific Islander residents-860,335,194.7 -713,070,378.3 37.8 Median age for Other race residents36.1 38.6 33.5 Median age for Two or more races residents31.6 41.9 44.5 Median age for White alone residents47.5 38.7 34.1 Median age for Hispanic or Latino residents32.5 36.7
Owner/renter occupied households by race in Roselle Park
House owners and renters - White residents 1,656 68.3% Owner occupied768 31.7% Renter occupiedHouse owners and renters - Black or African American residents 167 26.0% Owner occupied475 74.0% Renter occupiedHouse owners and renters - Asian residents 368 68.5% Owner occupied169 31.5% Renter occupiedHouse owners and renters - Other race residents 445 54.5% Owner occupied371 45.5% Renter occupiedHouse owners and renters - Two or more races residents 517 66.4% Owner occupied261 33.6% Renter occupiedHouse owners and renters - White alone residents 1,573 67.5% Owner occupied756 32.5% Renter occupiedHouse owners and renters - Hispanic or Latino residents 933 62.6% Owner occupied557 37.4% Renter occupied
Language usage in Roselle Park
English speakers - Total 55.0% of residents of Roselle Park speak English at home.
25.0% of residents speak Spanish at home 2,008 61.1% Speak English very well1,276 38.9% Speak English less than very well19.6% of residents speak other language at home 1,526 59.4% Speak English very well1,043 40.6% Speak English less than very well
English speakers - Born in the United States 82.8% of residents of Roselle Park speak English at home.
4.3% of residents speak Spanish at home 76 100.0% Speak English very well13.9% of residents speak other language at home 181 73.3% Speak English very well66 26.7% Speak English less than very well
English speakers - Native, born elsewhere 61.3% of residents of Roselle Park speak English at home.
32.8% of residents speak Spanish at home 89 94.7% Speak English very well5 5.3% Speak English less than very well1.0% of residents speak other language at home 3 100.0% Speak English very well
English speakers - Foreign-born 12.1% of residents of Roselle Park speak English at home.
42.7% of residents speak Spanish at home 849 40.7% Speak English very well1,235 59.3% Speak English less than very well43.5% of residents speak other language at home 1,136 53.5% Speak English very well988 46.5% Speak English less than very well
White (Caucasian) - Speak only English Native:
90.0% (4,530)Foreign-born:
29.2% (234)
White (Caucasian) - Speak another language Native:
10.3% (519)Foreign-born:
71.8% (576)
Black or African American - Speak another language Native:
9.8% (87)Foreign-born:
100.0% (452)
Asian - Speak only English Native:
69.2% (203)Foreign-born:
15.2% (205)
Asian - Speak another language Native:
31.9% (94)Foreign-born:
84.8% (1,143)
Other race - Speak only English Native:
43.3% (436)Foreign-born:
7.7% (109)
Other race - Speak another language Native:
58.9% (594)Foreign-born:
93.3% (1,319)
Two or more races - Speak only English Native:
72.3% (783)Foreign-born:
5.2% (46)
Two or more races - Speak another language Native:
22.2% (240)Foreign-born:
94.5% (834)
White alone - Speak only English Native:
90.3% (4,241)Foreign-born:
29.4% (231)
White alone - Speak another language Native:
9.7% (456)Foreign-born:
68.5% (538)
Hispanic or Latino - Speak only English Native:
53.9% (1,084)Foreign-born:
3.7% (82)
Hispanic or Latino - Speak another language Native:
46.4% (933)Foreign-born:
96.3% (2,137)
Foreign-born residents in Roselle Park 4,776 residents are foreign born (18.4% Latin America , 10.1% Asia , 3.5% Europe ).
This city:
34.3%New Jersey:
23.2%
Marital status for residents in Roselle Park Marital status - White (Caucasian) population 15 years and over
Males 34.5% Never married56.3% Now married0.0% Separated2.2% Widowed7.0% DivorcedFemales 33.8% Never married48.5% Now married0.0% Separated7.9% Widowed9.8% DivorcedWomen who gave birth in the past 12 months Now married:
100.0% (58)Unmarried:
0.0% (0)
Women who did not give birth in the past 12 months Now married:
38.9% (556)Unmarried:
61.1% (874)
Marital status - Black or African American population 15 years and over
Males 41.4% Never married38.0% Now married0.0% Separated0.0% Widowed20.6% DivorcedFemales 42.5% Never married41.1% Now married0.0% Separated4.8% Widowed11.6% DivorcedWomen who gave birth in the past 12 months Now married:
100.0% (72)Unmarried:
0.0% (0)
Women who did not give birth in the past 12 months Now married:
38.4% (149)Unmarried:
61.6% (238)
Marital status - Asian population 15 years and over
Males 24.9% Never married70.0% Now married0.0% Separated2.7% Widowed2.5% DivorcedFemales 22.9% Never married67.2% Now married0.0% Separated6.8% Widowed3.1% DivorcedWomen who did not give birth in the past 12 months Now married:
53.3% (213)Unmarried:
46.7% (186)
Marital status - Other race population 15 years and over
Males 29.3% Never married45.6% Now married10.7% Separated4.0% Widowed10.4% DivorcedFemales 30.3% Never married53.1% Now married5.7% Separated1.8% Widowed9.0% DivorcedWomen who did not give birth in the past 12 months Now married:
44.6% (230)Unmarried:
55.4% (286)
Marital status - Two or more races population 15 years and over
Males 69.2% Never married30.8% Now married0.0% Separated0.0% Widowed0.0% DivorcedFemales 25.6% Never married46.3% Now married10.8% Separated2.7% Widowed14.5% DivorcedWomen who did not give birth in the past 12 months Now married:
53.8% (270)Unmarried:
46.2% (231)
Marital status - White alone, not Hispanic / Latino population 15 years and over
Males 36.3% Never married54.2% Now married0.0% Separated2.4% Widowed7.0% DivorcedFemales 31.0% Never married49.9% Now married0.0% Separated8.7% Widowed10.4% DivorcedWomen who gave birth in the past 12 months Now married:
100.0% (63)Unmarried:
0.0% (0)
Women who did not give birth in the past 12 months Now married:
39.0% (495)Unmarried:
61.0% (775)
Marital status - Hispanic or Latino population 15 years and over
Males 44.0% Never married46.5% Now married1.1% Separated2.3% Widowed6.2% DivorcedFemales 34.7% Never married44.0% Now married6.8% Separated3.4% Widowed11.2% DivorcedWomen who did not give birth in the past 12 months Now married:
44.8% (445)Unmarried:
55.2% (550)
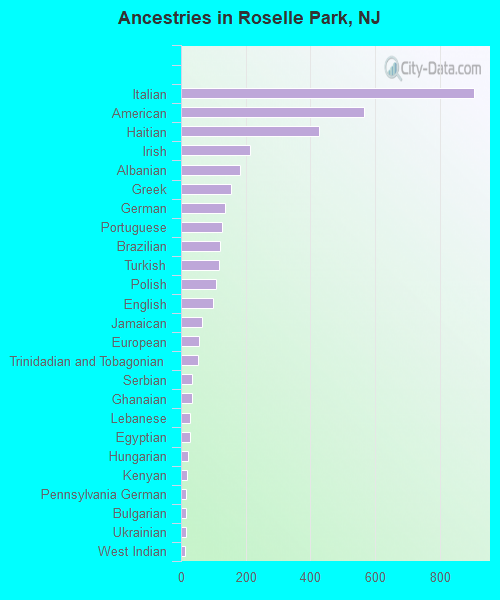
Ancestries in Roselle Park
907 11.9% Italian567 7.4% American427 5.6% Haitian212 2.8% Irish183 2.4% Albanian156 2.0% Greek137 1.8% German126 1.7% Portuguese121 1.6% Brazilian117 1.5% Turkish107 1.4% Polish100 1.3% English66 0.9% Jamaican55 0.7% European53 0.7% Trinidadian and Tobagonian33 0.4% Serbian33 0.4% Ghanaian29 0.4% Lebanese28 0.4% Egyptian23 0.3% Hungarian20 0.3% Kenyan17 0.2% Pennsylvania German14 0.2% Bulgarian14 0.2% Ukrainian12 0.2% West Indian11 0.1% Iranian11 0.1% Slovak9 0.1% Russian8 0.1% French4 0.05% Eastern European
Geographical mobility in Roselle Park Same house 1 year ago 4,975 83.5% White (Caucasian)1,389 94.7% Black or African American9 96.6% American Indian / Alaska Native1,591 94.7% Asian1,838 76.0% Other race2,301 97.1% Two or more races4,628 82.8% White alone, not Hispanic / Latino4,080 88.2% Hispanic or LatinoMoved within same county 731 12.3% White / Caucasian42 2.8% Black or African American387 16.0% Other race794 14.2% White alone, not Hispanic / Latino366 7.9% Hispanic or LatinoMoved within same state 120 2.0% White / Caucasian64 2.6% Other race45 1.9% Two or more races114 2.0% White alone, not Hispanic / Latino81 1.7% Hispanic or LatinoMoved from different state 45 0.8% White / Caucasian53 3.6% Black or African American70 4.2% Asian94 3.9% Other race59 1.3% Hispanic or LatinoMoved from abroad 26 0.4% White4 0.2% Two or more races21 0.4% White alone, not Hispanic / Latino25 0.5% Hispanic or Latino
Children Nativity (place of birth) in Roselle Park
Children under 6 years - Living with two parents Both parents native 278 100.0% NativeBoth parents foreign-born 147 100.0% NativeOne native, one foreign-born parent 140 100.0% NativeChildren under 6 years - Living with one parent Native parent 66 100.0% NativeForeign-born parent 109 100.0% NativeChildren 6 to 17 years - Living with two parents Both parents native 784 100.0% NativeBoth parents foreign-born 450 88.3% Native59 11.7% Foreign-bornOne native, one foreign-born parent 136 100.0% NativeChildren 6 to 17 years - Living with one parent Native parent 206 100.0% NativeForeign-born parent 249 50.2% Native247 49.8% Foreign-born
Grandparents responsible for own grandchildren in Roselle Park
Grandparents (30 to 59 years) White / Caucasian 18 67.3% Responsible for grandchildren9 32.7% Not responsible for grandchildrenAsian 28 100.0% Not responsible for grandchildrenOther race 74 100.0% Responsible for grandchildrenWhite alone, not Hispanic / Latino 8 42.3% Responsible for grandchildren11 57.7% Not responsible for grandchildrenHispanic or Latino 33 100.0% Responsible for grandchildren
Grandparents (60 years and over) White / Caucasian 62 100.0% Not responsible for grandchildrenAsian 60 100.0% Not responsible for grandchildrenOther race 57 100.0% Not responsible for grandchildrenWhite alone, not Hispanic / Latino 63 100.0% Not responsible for grandchildrenHispanic or Latino 45 100.0% Not responsible for grandchildren