Races in Roselle, Illinois (IL) Detailed Stats
Data:
Races - White alone (%)
Races - White alone (% change since 2000)
Races - Black alone (%)
Races - Black alone (% change since 2000)
Races - American Indian alone (%)
Races - American Indian alone (% change since 2000)
Races - Asian alone (%)
Races - Asian alone (% change since 2000)
Races - Hispanic (%)
Races - Hispanic (% change since 2000)
Races - Native Hawaiian and Other Pacific Islander alone (%)
Races - Native Hawaiian and Other Pacific Islander alone (% change since 2000)
Races - Two or more races(%)
Races - Two or more races(% change since 2000)
Races - Other race alone (%)
Races - Other race alone (% change since 2000)
Racial diversity
Place of birth - Born in state of residence (%)
Place of birth - Born in state of residence (%) - White
Place of birth - Born in state of residence (%) - Black or African American
Place of birth - Born in state of residence (%) - Asian
Place of birth - Born in state of residence (%) - Hispanic or Latino
Place of birth - Born in state of residence (%) - American Indian and Alaska Native
Place of birth - Born in state of residence (%) - Multirace
Place of birth - Born in state of residence (%) - Other Race
Place of birth - Born in other state (%)
Place of birth - Born in other state (%) - White
Place of birth - Born in other state (%) - Black or African American
Place of birth - Born in other state (%) - Asian
Place of birth - Born in other state (%) - Hispanic or Latino
Place of birth - Born in other state (%) - American Indian and Alaska Native
Place of birth - Born in other state (%) - Multirace
Place of birth - Born in other state (%) - Other Race
Place of birth - Native, outside of US (%)
Place of birth - Native, outside of US (%) - White
Place of birth - Native, outside of US (%) - Black or African American
Place of birth - Native, outside of US (%) - Asian
Place of birth - Native, outside of US (%) - Hispanic or Latino
Place of birth - Native, outside of US (%) - American Indian and Alaska Native
Place of birth - Native, outside of US (%) - Multirace
Place of birth - Native, outside of US (%) - Other Race
Place of birth - Foreign born (%)
Place of birth - Foreign born (%) - White
Place of birth - Foreign born (%) - Black or African American
Place of birth - Foreign born (%) - Asian
Place of birth - Foreign born (%) - Hispanic or Latino
Place of birth - Foreign born (%) - American Indian and Alaska Native
Place of birth - Foreign born (%) - Multirace
Place of birth - Foreign born (%) - Other Race
Residents speaking English at home (%)
Residents speaking English at home - Born in the United States (%)
Residents speaking English at home - Native, born elsewhere (%)
Residents speaking English at home - Foreign born (%)
Residents speaking Spanish at home (%)
Residents speaking Spanish at home - Born in the United States (%)
Residents speaking Spanish at home - Native, born elsewhere (%)
Residents speaking Spanish at home - Foreign born (%)
Residents speaking other language at home (%)
Residents speaking other language at home - Born in the United States (%)
Residents speaking other language at home - Native, born elsewhere (%)
Residents speaking other language at home - Foreign born (%)
Marital status - Never married (%)
Marital status - Now married (%)
Marital status - Separated (%)
Marital status - Widowed (%)
Marital status - Divorced (%)
Ancestries Reported - Arab (%)
Ancestries Reported - Czech (%)
Ancestries Reported - Danish (%)
Ancestries Reported - Dutch (%)
Ancestries Reported - English (%)
Ancestries Reported - French (%)
Ancestries Reported - French Canadian (%)
Ancestries Reported - German (%)
Ancestries Reported - Greek (%)
Ancestries Reported - Hungarian (%)
Ancestries Reported - Irish (%)
Ancestries Reported - Italian (%)
Ancestries Reported - Lithuanian (%)
Ancestries Reported - Norwegian (%)
Ancestries Reported - Polish (%)
Ancestries Reported - Portuguese (%)
Ancestries Reported - Russian (%)
Ancestries Reported - Scotch-Irish (%)
Ancestries Reported - Scottish (%)
Ancestries Reported - Slovak (%)
Ancestries Reported - Subsaharan African (%)
Ancestries Reported - Swedish (%)
Ancestries Reported - Swiss (%)
Ancestries Reported - Ukrainian (%)
Ancestries Reported - United States (%)
Ancestries Reported - Welsh (%)
Ancestries Reported - West Indian (%)
Ancestries Reported - Other (%)
Geographical mobility - Same house 1 year ago (%)
Geographical mobility - Same house 1 year ago (%) - White
Geographical mobility - Same house 1 year ago (%) - Black or African American
Geographical mobility - Same house 1 year ago (%) - Asian
Geographical mobility - Same house 1 year ago (%) - Hispanic or Latino
Geographical mobility - Same house 1 year ago (%) - American Indian and Alaska Native
Geographical mobility - Same house 1 year ago (%) - Multirace
Geographical mobility - Same house 1 year ago (%) - Other Race
Geographical mobility - Moved within same county (%)
Geographical mobility - Moved within same county (%) - White
Geographical mobility - Moved within same county (%) - Black or African American
Geographical mobility - Moved within same county (%) - Asian
Geographical mobility - Moved within same county (%) - Hispanic or Latino
Geographical mobility - Moved within same county (%) - American Indian and Alaska Native
Geographical mobility - Moved within same county (%) - Multirace
Geographical mobility - Moved within same county (%) - Other Race
Geographical mobility - Moved from different county within same state (%)
Geographical mobility - Moved from different county within same state (%) - White
Geographical mobility - Moved from different county within same state (%) - Black or African American
Geographical mobility - Moved from different county within same state (%) - Asian
Geographical mobility - Moved from different county within same state (%) - Hispanic or Latino
Geographical mobility - Moved from different county within same state (%) - American Indian and Alaska Native
Geographical mobility - Moved from different county within same state (%) - Multirace
Geographical mobility - Moved from different county within same state (%) - Other Race
Geographical mobility - Moved from different state (%)
Geographical mobility - Moved from different state (%) - White
Geographical mobility - Moved from different state (%) - Black or African American
Geographical mobility - Moved from different state (%) - Asian
Geographical mobility - Moved from different state (%) - Hispanic or Latino
Geographical mobility - Moved from different state (%) - American Indian and Alaska Native
Geographical mobility - Moved from different state (%) - Multirace
Geographical mobility - Moved from different state (%) - Other Race
Geographical mobility - Moved from abroad (%)
Geographical mobility - Moved from abroad (%) - White
Geographical mobility - Moved from abroad (%) - Black or African American
Geographical mobility - Moved from abroad (%) - Asian
Geographical mobility - Moved from abroad (%) - Hispanic or Latino
Geographical mobility - Moved from abroad (%) - American Indian and Alaska Native
Geographical mobility - Moved from abroad (%) - Multirace
Geographical mobility - Moved from abroad (%) - Other Race
Place of birth for the foreign-born population - Ireland (%)
Place of birth for the foreign-born population - Denmark (%)
Place of birth for the foreign-born population - Norway (%)
Place of birth for the foreign-born population - Sweden (%)
Place of birth for the foreign-born population - United Kingdom (%)
Place of birth for the foreign-born population - England (%)
Place of birth for the foreign-born population - Scotland (%)
Place of birth for the foreign-born population - Other Northern Europe (%)
Place of birth for the foreign-born population - Austria (%)
Place of birth for the foreign-born population - Belgium (%)
Place of birth for the foreign-born population - France (%)
Place of birth for the foreign-born population - Germany (%)
Place of birth for the foreign-born population - Netherlands (%)
Place of birth for the foreign-born population - Switzerland (%)
Place of birth for the foreign-born population - Other Western Europe (%)
Place of birth for the foreign-born population - Greece (%)
Place of birth for the foreign-born population - Italy (%)
Place of birth for the foreign-born population - Portugal (%)
Place of birth for the foreign-born population - Spain (%)
Place of birth for the foreign-born population - Other Southern Europe (%)
Place of birth for the foreign-born population - Albania (%)
Place of birth for the foreign-born population - Belarus (%)
Place of birth for the foreign-born population - Bosnia and Herzegovina (%)
Place of birth for the foreign-born population - Bulgaria (%)
Place of birth for the foreign-born population - Croatia (%)
Place of birth for the foreign-born population - Czechoslovakia (%)
Place of birth for the foreign-born population - Hungary (%)
Place of birth for the foreign-born population - Latvia (%)
Place of birth for the foreign-born population - Lithuania (%)
Place of birth for the foreign-born population - North Macedonia (Macedonia) (%)
Place of birth for the foreign-born population - Moldova (%)
Place of birth for the foreign-born population - Poland (%)
Place of birth for the foreign-born population - Romania (%)
Place of birth for the foreign-born population - Russia (%)
Place of birth for the foreign-born population - Serbia (%)
Place of birth for the foreign-born population - Ukraine (%)
Place of birth for the foreign-born population - Other Eastern Europe (%)
Place of birth for the foreign-born population - China (%)
Place of birth for the foreign-born population - Hong Kong (%)
Place of birth for the foreign-born population - Taiwan (%)
Place of birth for the foreign-born population - Japan (%)
Place of birth for the foreign-born population - Korea (%)
Place of birth for the foreign-born population - Other Eastern Asia (%)
Place of birth for the foreign-born population - Afghanistan (%)
Place of birth for the foreign-born population - Bangladesh (%)
Place of birth for the foreign-born population - India (%)
Place of birth for the foreign-born population - Iran (%)
Place of birth for the foreign-born population - Kazakhstan (%)
Place of birth for the foreign-born population - Nepal (%)
Place of birth for the foreign-born population - Pakistan (%)
Place of birth for the foreign-born population - Sri Lanka (%)
Place of birth for the foreign-born population - Uzbekistan (%)
Place of birth for the foreign-born population - Other South Central Asia (%)
Place of birth for the foreign-born population - Burma (%)
Place of birth for the foreign-born population - Cambodia (%)
Place of birth for the foreign-born population - Indonesia (%)
Place of birth for the foreign-born population - Laos (%)
Place of birth for the foreign-born population - Malaysia (%)
Place of birth for the foreign-born population - Philippines (%)
Place of birth for the foreign-born population - Singapore (%)
Place of birth for the foreign-born population - Thailand (%)
Place of birth for the foreign-born population - Vietnam (%)
Place of birth for the foreign-born population - Other South Eastern Asia (%)
Place of birth for the foreign-born population - Armenia (%)
Place of birth for the foreign-born population - Iraq (%)
Place of birth for the foreign-born population - Israel (%)
Place of birth for the foreign-born population - Jordan (%)
Place of birth for the foreign-born population - Kuwait (%)
Place of birth for the foreign-born population - Lebanon (%)
Place of birth for the foreign-born population - Saudi Arabia (%)
Place of birth for the foreign-born population - Syria (%)
Place of birth for the foreign-born population - Turkey (%)
Place of birth for the foreign-born population - Yemen (%)
Place of birth for the foreign-born population - Other Western Asia (%)
Place of birth for the foreign-born population - Eritrea (%)
Place of birth for the foreign-born population - Ethiopia (%)
Place of birth for the foreign-born population - Kenya (%)
Place of birth for the foreign-born population - Somalia (%)
Place of birth for the foreign-born population - Uganda (%)
Place of birth for the foreign-born population - Zimbabwe (%)
Place of birth for the foreign-born population - Other Eastern Africa (%)
Place of birth for the foreign-born population - Cameroon (%)
Place of birth for the foreign-born population - Congo (%)
Place of birth for the foreign-born population - Democratic Republic of Congo (Zaire) (%)
Place of birth for the foreign-born population - Other Middle Africa (%)
Place of birth for the foreign-born population - Egypt (%)
Place of birth for the foreign-born population - Morocco (%)
Place of birth for the foreign-born population - Sudan (%)
Place of birth for the foreign-born population - Other Northern Africa (%)
Place of birth for the foreign-born population - South Africa (%)
Place of birth for the foreign-born population - Other Southern Africa (%)
Place of birth for the foreign-born population - Cabo Verde (%)
Place of birth for the foreign-born population - Ghana (%)
Place of birth for the foreign-born population - Liberia (%)
Place of birth for the foreign-born population - Nigeria (%)
Place of birth for the foreign-born population - Senegal (%)
Place of birth for the foreign-born population - Sierra Leone (%)
Place of birth for the foreign-born population - Other Western Africa (%)
Place of birth for the foreign-born population - Australia (%)
Place of birth for the foreign-born population - New Zealand (%)
Place of birth for the foreign-born population - Fiji (%)
Place of birth for the foreign-born population - Micronesia (%)
Place of birth for the foreign-born population - Bahamas (%)
Place of birth for the foreign-born population - Barbados (%)
Place of birth for the foreign-born population - Cuba (%)
Place of birth for the foreign-born population - Dominica (%)
Place of birth for the foreign-born population - Dominican Republic (%)
Place of birth for the foreign-born population - Grenada (%)
Place of birth for the foreign-born population - Haiti (%)
Place of birth for the foreign-born population - Jamaica (%)
Place of birth for the foreign-born population - St. Vincent and the Grenadines (%)
Place of birth for the foreign-born population - Trinidad and Tobago (%)
Place of birth for the foreign-born population - West Indies (%)
Place of birth for the foreign-born population - Other Caribbean (%)
Place of birth for the foreign-born population - Belize (%)
Place of birth for the foreign-born population - Costa Rica (%)
Place of birth for the foreign-born population - El Salvador (%)
Place of birth for the foreign-born population - Guatemala (%)
Place of birth for the foreign-born population - Honduras (%)
Place of birth for the foreign-born population - Mexico (%)
Place of birth for the foreign-born population - Nicaragua (%)
Place of birth for the foreign-born population - Panama (%)
Place of birth for the foreign-born population - Other Central America (%)
Place of birth for the foreign-born population - Argentina (%)
Place of birth for the foreign-born population - Bolivia (%)
Place of birth for the foreign-born population - Brazil (%)
Place of birth for the foreign-born population - Chile (%)
Place of birth for the foreign-born population - Colombia (%)
Place of birth for the foreign-born population - Ecuador (%)
Place of birth for the foreign-born population - Guyana (%)
Place of birth for the foreign-born population - Peru (%)
Place of birth for the foreign-born population - Uruguay (%)
Place of birth for the foreign-born population - Venezuela (%)
Place of birth for the foreign-born population - Other South America (%)
Place of birth for the foreign-born population - Canada (%)
Place of birth for the foreign-born population - Other Northern America (%)
Place of birth for the foreign-born population - Other (%)
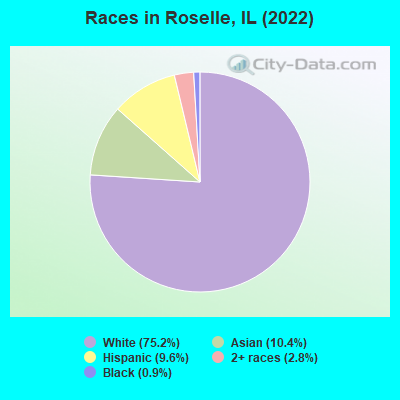
According to 2022 data, the most numerous races in Roselle, IL are White alone (17,008 residents), Hispanic (2,168 residents), and Black alone (202 residents). 66.5% of Roselle residents speak English at home. 23.6% of Roselle, IL residents are foreign-born (11.8% born in Europe, 8.6% born in Asia, 2.5% born in Latin America), which is 40.6% greater than the foreign-born rate of 14.0% across the entire state of Illinois.
Race distribution in Roselle
2000 2022
8,424,140 67.8% White alone 1,856,152 14.9% Black alone 1,530,262 12.3% Hispanic 419,916 3.4% Asian alone 153,996 1.2% Two or more races 13,479 0.1% Other race alone 18,232 0.1% American Indian alone 3,116 0.03% Native Hawaiian and Other
7,356,301 58.5% White alone 2,299,726 18.3% Hispanic 1,660,423 13.2% Black alone 747,296 5.9% Asian alone 458,599 3.6% Two or more races 45,386 0.4% Other race alone 10,405 0.08% American Indian alone 3,896 0.03% Native Hawaiian and Other
Income and house value in Roselle Median household income in 2022 $98,746 White non-Hispanic householders$51,935 Black householders$112,537 Asian householders$61,659 Some other race householders$109,021 Two or more races householders$80,382 Hispanic or Latino race householdersMedian 2022 house value $311,386 White Non-Hispanic householders$273,786 Black or African American householders $309,196 Asian householders$300,435 Some other race householders$304,268 Two or more races householders$284,738 Hispanic or Latino householders
Median age by race in Roselle
43.8 Median age for White residents42.7 45.1 48.0 Median age for Black or African American residents41.9 54.3 25.0 Median age for American Indian / Alaska Native residents17.1 26.2 51.5 Median age for Asian residents52.0 49.2 -593,236,714.4 Median age for Native Hawaiian / Pacific Islander residents-658,536,584.7 -576,015,108.0 56.6 Median age for Other race residents48.4 59.1 29.7 Median age for Two or more races residents44.6 11.1 43.4 Median age for White alone residents42.7 44.7 28.5 Median age for Hispanic or Latino residents36.2 21.0
Owner/renter occupied households by race in Roselle
House owners and renters - White residents 5,570 81.8% Owner occupied1,242 18.2% Renter occupiedHouse owners and renters - Black or African American residents 38 34.3% Owner occupied72 65.7% Renter occupiedHouse owners and renters - American Indian / Alaska Native residents 11 38.8% Owner occupied18 61.2% Renter occupiedHouse owners and renters - Asian residents 843 84.1% Owner occupied159 15.9% Renter occupiedHouse owners and renters - Other race residents 128 72.4% Owner occupied49 27.6% Renter occupiedHouse owners and renters - Two or more races residents 295 64.8% Owner occupied161 35.2% Renter occupiedHouse owners and renters - White alone residents 5,645 82.1% Owner occupied1,231 17.9% Renter occupiedHouse owners and renters - Hispanic or Latino residents 289 58.8% Owner occupied203 41.2% Renter occupied
Language usage in Roselle
English speakers - Total 66.5% of residents of Roselle speak English at home.
4.8% of residents speak Spanish at home 667 64.1% Speak English very well374 35.9% Speak English less than very well28.3% of residents speak other language at home 3,612 58.6% Speak English very well2,553 41.4% Speak English less than very well
English speakers - Born in the United States 96.2% of residents of Roselle speak English at home.
1.9% of residents speak Spanish at home 49 100.0% Speak English very well1.4% of residents speak other language at home 34 100.0% Speak English very well
English speakers - Native, born elsewhere 67.4% of residents of Roselle speak English at home.
9.3% of residents speak Spanish at home 29 100.0% Speak English very well19.8% of residents speak other language at home 54 87.1% Speak English very well8 12.9% Speak English less than very well
English speakers - Foreign-born 4.9% of residents of Roselle speak English at home.
10.6% of residents speak Spanish at home 247 44.0% Speak English very well314 56.0% Speak English less than very well84.0% of residents speak other language at home 1,971 44.2% Speak English very well2,490 55.8% Speak English less than very well
White (Caucasian) - Speak only English Native:
92.2% (12,455)Foreign-born:
3.5% (91)
White (Caucasian) - Speak another language Native:
7.2% (974)Foreign-born:
94.5% (2,492)
Black or African American - Speak only English Native:
100.0% (155)Foreign-born:
48.4% (12)
American Indian / Alaska Native - Speak another language Native:
100.0% (87)Foreign-born:
100.0% (24)
Asian - Speak only English Native:
87.8% (559)Foreign-born:
7.8% (131)
Asian - Speak another language Native:
18.5% (118)Foreign-born:
92.4% (1,542)
Other race - Speak another language Native:
55.9% (109)Foreign-born:
100.0% (197)
Two or more races - Speak only English Native:
46.4% (761)Foreign-born:
5.1% (18)
Two or more races - Speak another language Native:
57.0% (935)Foreign-born:
96.1% (335)
White alone - Speak only English Native:
91.2% (12,255)Foreign-born:
3.3% (101)
White alone - Speak another language Native:
8.5% (1,139)Foreign-born:
96.0% (2,917)
Hispanic or Latino - Speak another language Native:
61.0% (903)Foreign-born:
100.0% (567)
Foreign-born residents in Roselle 5,332 residents are foreign born (11.8% Europe , 8.6% Asia , 2.5% Latin America ).
This city:
23.6%Illinois:
14.1%
Marital status for residents in Roselle Marital status - White (Caucasian) population 15 years and over
Males 33.6% Never married57.7% Now married0.3% Separated2.4% Widowed6.0% DivorcedFemales 26.3% Never married55.9% Now married0.8% Separated6.7% Widowed10.3% DivorcedWomen who gave birth in the past 12 months Now married:
66.7% (25)Unmarried:
33.3% (12)
Women who did not give birth in the past 12 months Now married:
49.3% (1,797)Unmarried:
50.7% (1,846)
Marital status - Black or African American population 15 years and over
Males 38.9% Never married37.9% Now married0.0% Separated0.0% Widowed23.2% DivorcedFemales 32.4% Never married24.3% Now married0.0% Separated0.0% Widowed43.2% DivorcedWomen who did not give birth in the past 12 months Now married:
12.2% (5)Unmarried:
87.8% (37)
Marital status - American Indian / Alaska Native population 15 years and over
Males 37.8% Never married62.2% Now married0.0% Separated0.0% Widowed0.0% DivorcedFemales 30.8% Never married69.2% Now married0.0% Separated0.0% Widowed0.0% DivorcedWomen who did not give birth in the past 12 months Now married:
69.2% (45)Unmarried:
30.8% (20)
Marital status - Asian population 15 years and over
Males 22.8% Never married67.6% Now married0.0% Separated3.7% Widowed5.9% DivorcedFemales 18.7% Never married68.9% Now married0.0% Separated7.1% Widowed5.2% DivorcedWomen who gave birth in the past 12 months Now married:
100.0% (18)Unmarried:
0.0% (0)
Women who did not give birth in the past 12 months Now married:
62.4% (336)Unmarried:
37.6% (202)
Marital status - Other race population 15 years and over
Males 32.2% Never married64.4% Now married0.0% Separated0.0% Widowed3.4% DivorcedFemales 20.5% Never married59.8% Now married0.0% Separated9.0% Widowed10.7% DivorcedWomen who did not give birth in the past 12 months Now married:
24.0% (17)Unmarried:
76.0% (53)
Marital status - Two or more races population 15 years and over
Males 38.4% Never married57.0% Now married0.0% Separated0.0% Widowed4.7% DivorcedFemales 26.8% Never married48.6% Now married0.0% Separated0.5% Widowed24.1% DivorcedWomen who gave birth in the past 12 months Now married:
100.0% (17)Unmarried:
0.0% (0)
Women who did not give birth in the past 12 months Now married:
53.1% (208)Unmarried:
46.9% (184)
Marital status - White alone, not Hispanic / Latino population 15 years and over
Males 32.3% Never married58.7% Now married0.3% Separated2.5% Widowed6.2% DivorcedFemales 25.3% Never married56.9% Now married0.6% Separated6.9% Widowed10.3% DivorcedWomen who gave birth in the past 12 months Now married:
100.0% (26)Unmarried:
0.0% (0)
Women who did not give birth in the past 12 months Now married:
50.5% (1,868)Unmarried:
49.5% (1,833)
Marital status - Hispanic or Latino population 15 years and over
Males 41.7% Never married55.3% Now married0.0% Separated0.0% Widowed3.0% DivorcedFemales 34.1% Never married46.0% Now married3.1% Separated2.1% Widowed14.7% DivorcedWomen who gave birth in the past 12 months Now married:
46.2% (12)Unmarried:
53.8% (15)
Women who did not give birth in the past 12 months Now married:
40.2% (168)Unmarried:
59.8% (250)
Ancestries in Roselle
3,550 32.1% Polish967 8.7% Italian687 6.2% German466 4.2% Irish426 3.8% American291 2.6% Assyrian184 1.7% Bulgarian134 1.2% English129 1.2% Dutch119 1.1% Ukrainian106 1.0% Swedish93 0.8% Canadian86 0.8% Romanian76 0.7% Greek70 0.6% European69 0.6% Hungarian64 0.6% Norwegian51 0.5% Scandinavian47 0.4% Russian44 0.4% French34 0.3% Lebanese33 0.3% Iranian31 0.3% Scottish30 0.3% Albanian29 0.3% Lithuanian27 0.2% Czechoslovakian26 0.2% Belgian26 0.2% Slovak24 0.2% Scotch-Irish22 0.2% Armenian21 0.2% Austrian20 0.2% Portuguese18 0.2% Turkish17 0.2% Nigerian15 0.1% Czech14 0.1% Barbadian13 0.1% Croatian13 0.1% British11 0.10% South African10 0.09% Danish10 0.09% Yugoslavian8 0.07% Finnish8 0.07% French Canadian6 0.05% Slovene
Geographical mobility in Roselle Same house 1 year ago 16,131 95.9% White (Caucasian)194 95.6% Black or African American180 99.7% American Indian / Alaska Native2,194 93.0% Asian310 78.2% Other race1,923 92.1% Two or more races16,364 96.4% White alone, not Hispanic / Latino1,859 86.8% Hispanic or LatinoMoved within same county 263 1.6% White / Caucasian13 6.6% Black or African American34 1.4% Asian63 3.0% Two or more races208 1.2% White alone, not Hispanic / Latino116 5.4% Hispanic or LatinoMoved within same state 393 2.3% White / Caucasian1 0.4% Black or African American108 4.6% Asian61 15.3% Other race80 3.8% Two or more races392 2.3% White alone, not Hispanic / Latino136 6.4% Hispanic or LatinoMoved from different state 34 0.2% White / Caucasian13 3.3% Other race35 0.2% White alone, not Hispanic / LatinoMoved from abroad 18 0.1% White27 1.1% Asian18 0.9% Two or more races19 0.1% White alone, not Hispanic / Latino
Children Nativity (place of birth) in Roselle
Children under 6 years - Living with two parents Both parents native 429 100.0% NativeBoth parents foreign-born 353 100.0% NativeOne native, one foreign-born parent 69 100.0% NativeChildren under 6 years - Living with one parent Native parent 180 100.0% NativeForeign-born parent 16 100.0% NativeChildren 6 to 17 years - Living with two parents Both parents native 1,770 99.9% Native2 0.1% Foreign-bornBoth parents foreign-born 845 93.4% Native60 6.6% Foreign-bornOne native, one foreign-born parent 102 100.0% NativeChildren 6 to 17 years - Living with one parent Native parent 350 100.0% NativeForeign-born parent 97 48.1% Native105 51.9% Foreign-born
Grandparents responsible for own grandchildren in Roselle
Grandparents (30 to 59 years) White / Caucasian 107 92.2% Responsible for grandchildren9 7.8% Not responsible for grandchildrenWhite alone, not Hispanic / Latino 118 92.0% Responsible for grandchildren10 8.0% Not responsible for grandchildrenGrandparents (60 years and over) White / Caucasian 7 8.1% Responsible for grandchildren77 91.9% Not responsible for grandchildrenWhite alone, not Hispanic / Latino 7 8.9% Responsible for grandchildren76 91.1% Not responsible for grandchildren