Races in Rome, Georgia (GA) Detailed Stats
Data:
Races - White alone (%)
Races - White alone (% change since 2000)
Races - Black alone (%)
Races - Black alone (% change since 2000)
Races - American Indian alone (%)
Races - American Indian alone (% change since 2000)
Races - Asian alone (%)
Races - Asian alone (% change since 2000)
Races - Hispanic (%)
Races - Hispanic (% change since 2000)
Races - Native Hawaiian and Other Pacific Islander alone (%)
Races - Native Hawaiian and Other Pacific Islander alone (% change since 2000)
Races - Two or more races(%)
Races - Two or more races(% change since 2000)
Races - Other race alone (%)
Races - Other race alone (% change since 2000)
Racial diversity
Place of birth - Born in state of residence (%)
Place of birth - Born in state of residence (%) - White
Place of birth - Born in state of residence (%) - Black or African American
Place of birth - Born in state of residence (%) - Asian
Place of birth - Born in state of residence (%) - Hispanic or Latino
Place of birth - Born in state of residence (%) - American Indian and Alaska Native
Place of birth - Born in state of residence (%) - Multirace
Place of birth - Born in state of residence (%) - Other Race
Place of birth - Born in other state (%)
Place of birth - Born in other state (%) - White
Place of birth - Born in other state (%) - Black or African American
Place of birth - Born in other state (%) - Asian
Place of birth - Born in other state (%) - Hispanic or Latino
Place of birth - Born in other state (%) - American Indian and Alaska Native
Place of birth - Born in other state (%) - Multirace
Place of birth - Born in other state (%) - Other Race
Place of birth - Native, outside of US (%)
Place of birth - Native, outside of US (%) - White
Place of birth - Native, outside of US (%) - Black or African American
Place of birth - Native, outside of US (%) - Asian
Place of birth - Native, outside of US (%) - Hispanic or Latino
Place of birth - Native, outside of US (%) - American Indian and Alaska Native
Place of birth - Native, outside of US (%) - Multirace
Place of birth - Native, outside of US (%) - Other Race
Place of birth - Foreign born (%)
Place of birth - Foreign born (%) - White
Place of birth - Foreign born (%) - Black or African American
Place of birth - Foreign born (%) - Asian
Place of birth - Foreign born (%) - Hispanic or Latino
Place of birth - Foreign born (%) - American Indian and Alaska Native
Place of birth - Foreign born (%) - Multirace
Place of birth - Foreign born (%) - Other Race
Residents speaking English at home (%)
Residents speaking English at home - Born in the United States (%)
Residents speaking English at home - Native, born elsewhere (%)
Residents speaking English at home - Foreign born (%)
Residents speaking Spanish at home (%)
Residents speaking Spanish at home - Born in the United States (%)
Residents speaking Spanish at home - Native, born elsewhere (%)
Residents speaking Spanish at home - Foreign born (%)
Residents speaking other language at home (%)
Residents speaking other language at home - Born in the United States (%)
Residents speaking other language at home - Native, born elsewhere (%)
Residents speaking other language at home - Foreign born (%)
Marital status - Never married (%)
Marital status - Now married (%)
Marital status - Separated (%)
Marital status - Widowed (%)
Marital status - Divorced (%)
Ancestries Reported - Arab (%)
Ancestries Reported - Czech (%)
Ancestries Reported - Danish (%)
Ancestries Reported - Dutch (%)
Ancestries Reported - English (%)
Ancestries Reported - French (%)
Ancestries Reported - French Canadian (%)
Ancestries Reported - German (%)
Ancestries Reported - Greek (%)
Ancestries Reported - Hungarian (%)
Ancestries Reported - Irish (%)
Ancestries Reported - Italian (%)
Ancestries Reported - Lithuanian (%)
Ancestries Reported - Norwegian (%)
Ancestries Reported - Polish (%)
Ancestries Reported - Portuguese (%)
Ancestries Reported - Russian (%)
Ancestries Reported - Scotch-Irish (%)
Ancestries Reported - Scottish (%)
Ancestries Reported - Slovak (%)
Ancestries Reported - Subsaharan African (%)
Ancestries Reported - Swedish (%)
Ancestries Reported - Swiss (%)
Ancestries Reported - Ukrainian (%)
Ancestries Reported - United States (%)
Ancestries Reported - Welsh (%)
Ancestries Reported - West Indian (%)
Ancestries Reported - Other (%)
Geographical mobility - Same house 1 year ago (%)
Geographical mobility - Same house 1 year ago (%) - White
Geographical mobility - Same house 1 year ago (%) - Black or African American
Geographical mobility - Same house 1 year ago (%) - Asian
Geographical mobility - Same house 1 year ago (%) - Hispanic or Latino
Geographical mobility - Same house 1 year ago (%) - American Indian and Alaska Native
Geographical mobility - Same house 1 year ago (%) - Multirace
Geographical mobility - Same house 1 year ago (%) - Other Race
Geographical mobility - Moved within same county (%)
Geographical mobility - Moved within same county (%) - White
Geographical mobility - Moved within same county (%) - Black or African American
Geographical mobility - Moved within same county (%) - Asian
Geographical mobility - Moved within same county (%) - Hispanic or Latino
Geographical mobility - Moved within same county (%) - American Indian and Alaska Native
Geographical mobility - Moved within same county (%) - Multirace
Geographical mobility - Moved within same county (%) - Other Race
Geographical mobility - Moved from different county within same state (%)
Geographical mobility - Moved from different county within same state (%) - White
Geographical mobility - Moved from different county within same state (%) - Black or African American
Geographical mobility - Moved from different county within same state (%) - Asian
Geographical mobility - Moved from different county within same state (%) - Hispanic or Latino
Geographical mobility - Moved from different county within same state (%) - American Indian and Alaska Native
Geographical mobility - Moved from different county within same state (%) - Multirace
Geographical mobility - Moved from different county within same state (%) - Other Race
Geographical mobility - Moved from different state (%)
Geographical mobility - Moved from different state (%) - White
Geographical mobility - Moved from different state (%) - Black or African American
Geographical mobility - Moved from different state (%) - Asian
Geographical mobility - Moved from different state (%) - Hispanic or Latino
Geographical mobility - Moved from different state (%) - American Indian and Alaska Native
Geographical mobility - Moved from different state (%) - Multirace
Geographical mobility - Moved from different state (%) - Other Race
Geographical mobility - Moved from abroad (%)
Geographical mobility - Moved from abroad (%) - White
Geographical mobility - Moved from abroad (%) - Black or African American
Geographical mobility - Moved from abroad (%) - Asian
Geographical mobility - Moved from abroad (%) - Hispanic or Latino
Geographical mobility - Moved from abroad (%) - American Indian and Alaska Native
Geographical mobility - Moved from abroad (%) - Multirace
Geographical mobility - Moved from abroad (%) - Other Race
Place of birth for the foreign-born population - Ireland (%)
Place of birth for the foreign-born population - Denmark (%)
Place of birth for the foreign-born population - Norway (%)
Place of birth for the foreign-born population - Sweden (%)
Place of birth for the foreign-born population - United Kingdom (%)
Place of birth for the foreign-born population - England (%)
Place of birth for the foreign-born population - Scotland (%)
Place of birth for the foreign-born population - Other Northern Europe (%)
Place of birth for the foreign-born population - Austria (%)
Place of birth for the foreign-born population - Belgium (%)
Place of birth for the foreign-born population - France (%)
Place of birth for the foreign-born population - Germany (%)
Place of birth for the foreign-born population - Netherlands (%)
Place of birth for the foreign-born population - Switzerland (%)
Place of birth for the foreign-born population - Other Western Europe (%)
Place of birth for the foreign-born population - Greece (%)
Place of birth for the foreign-born population - Italy (%)
Place of birth for the foreign-born population - Portugal (%)
Place of birth for the foreign-born population - Spain (%)
Place of birth for the foreign-born population - Other Southern Europe (%)
Place of birth for the foreign-born population - Albania (%)
Place of birth for the foreign-born population - Belarus (%)
Place of birth for the foreign-born population - Bosnia and Herzegovina (%)
Place of birth for the foreign-born population - Bulgaria (%)
Place of birth for the foreign-born population - Croatia (%)
Place of birth for the foreign-born population - Czechoslovakia (%)
Place of birth for the foreign-born population - Hungary (%)
Place of birth for the foreign-born population - Latvia (%)
Place of birth for the foreign-born population - Lithuania (%)
Place of birth for the foreign-born population - North Macedonia (Macedonia) (%)
Place of birth for the foreign-born population - Moldova (%)
Place of birth for the foreign-born population - Poland (%)
Place of birth for the foreign-born population - Romania (%)
Place of birth for the foreign-born population - Russia (%)
Place of birth for the foreign-born population - Serbia (%)
Place of birth for the foreign-born population - Ukraine (%)
Place of birth for the foreign-born population - Other Eastern Europe (%)
Place of birth for the foreign-born population - China (%)
Place of birth for the foreign-born population - Hong Kong (%)
Place of birth for the foreign-born population - Taiwan (%)
Place of birth for the foreign-born population - Japan (%)
Place of birth for the foreign-born population - Korea (%)
Place of birth for the foreign-born population - Other Eastern Asia (%)
Place of birth for the foreign-born population - Afghanistan (%)
Place of birth for the foreign-born population - Bangladesh (%)
Place of birth for the foreign-born population - India (%)
Place of birth for the foreign-born population - Iran (%)
Place of birth for the foreign-born population - Kazakhstan (%)
Place of birth for the foreign-born population - Nepal (%)
Place of birth for the foreign-born population - Pakistan (%)
Place of birth for the foreign-born population - Sri Lanka (%)
Place of birth for the foreign-born population - Uzbekistan (%)
Place of birth for the foreign-born population - Other South Central Asia (%)
Place of birth for the foreign-born population - Burma (%)
Place of birth for the foreign-born population - Cambodia (%)
Place of birth for the foreign-born population - Indonesia (%)
Place of birth for the foreign-born population - Laos (%)
Place of birth for the foreign-born population - Malaysia (%)
Place of birth for the foreign-born population - Philippines (%)
Place of birth for the foreign-born population - Singapore (%)
Place of birth for the foreign-born population - Thailand (%)
Place of birth for the foreign-born population - Vietnam (%)
Place of birth for the foreign-born population - Other South Eastern Asia (%)
Place of birth for the foreign-born population - Armenia (%)
Place of birth for the foreign-born population - Iraq (%)
Place of birth for the foreign-born population - Israel (%)
Place of birth for the foreign-born population - Jordan (%)
Place of birth for the foreign-born population - Kuwait (%)
Place of birth for the foreign-born population - Lebanon (%)
Place of birth for the foreign-born population - Saudi Arabia (%)
Place of birth for the foreign-born population - Syria (%)
Place of birth for the foreign-born population - Turkey (%)
Place of birth for the foreign-born population - Yemen (%)
Place of birth for the foreign-born population - Other Western Asia (%)
Place of birth for the foreign-born population - Eritrea (%)
Place of birth for the foreign-born population - Ethiopia (%)
Place of birth for the foreign-born population - Kenya (%)
Place of birth for the foreign-born population - Somalia (%)
Place of birth for the foreign-born population - Uganda (%)
Place of birth for the foreign-born population - Zimbabwe (%)
Place of birth for the foreign-born population - Other Eastern Africa (%)
Place of birth for the foreign-born population - Cameroon (%)
Place of birth for the foreign-born population - Congo (%)
Place of birth for the foreign-born population - Democratic Republic of Congo (Zaire) (%)
Place of birth for the foreign-born population - Other Middle Africa (%)
Place of birth for the foreign-born population - Egypt (%)
Place of birth for the foreign-born population - Morocco (%)
Place of birth for the foreign-born population - Sudan (%)
Place of birth for the foreign-born population - Other Northern Africa (%)
Place of birth for the foreign-born population - South Africa (%)
Place of birth for the foreign-born population - Other Southern Africa (%)
Place of birth for the foreign-born population - Cabo Verde (%)
Place of birth for the foreign-born population - Ghana (%)
Place of birth for the foreign-born population - Liberia (%)
Place of birth for the foreign-born population - Nigeria (%)
Place of birth for the foreign-born population - Senegal (%)
Place of birth for the foreign-born population - Sierra Leone (%)
Place of birth for the foreign-born population - Other Western Africa (%)
Place of birth for the foreign-born population - Australia (%)
Place of birth for the foreign-born population - New Zealand (%)
Place of birth for the foreign-born population - Fiji (%)
Place of birth for the foreign-born population - Micronesia (%)
Place of birth for the foreign-born population - Bahamas (%)
Place of birth for the foreign-born population - Barbados (%)
Place of birth for the foreign-born population - Cuba (%)
Place of birth for the foreign-born population - Dominica (%)
Place of birth for the foreign-born population - Dominican Republic (%)
Place of birth for the foreign-born population - Grenada (%)
Place of birth for the foreign-born population - Haiti (%)
Place of birth for the foreign-born population - Jamaica (%)
Place of birth for the foreign-born population - St. Vincent and the Grenadines (%)
Place of birth for the foreign-born population - Trinidad and Tobago (%)
Place of birth for the foreign-born population - West Indies (%)
Place of birth for the foreign-born population - Other Caribbean (%)
Place of birth for the foreign-born population - Belize (%)
Place of birth for the foreign-born population - Costa Rica (%)
Place of birth for the foreign-born population - El Salvador (%)
Place of birth for the foreign-born population - Guatemala (%)
Place of birth for the foreign-born population - Honduras (%)
Place of birth for the foreign-born population - Mexico (%)
Place of birth for the foreign-born population - Nicaragua (%)
Place of birth for the foreign-born population - Panama (%)
Place of birth for the foreign-born population - Other Central America (%)
Place of birth for the foreign-born population - Argentina (%)
Place of birth for the foreign-born population - Bolivia (%)
Place of birth for the foreign-born population - Brazil (%)
Place of birth for the foreign-born population - Chile (%)
Place of birth for the foreign-born population - Colombia (%)
Place of birth for the foreign-born population - Ecuador (%)
Place of birth for the foreign-born population - Guyana (%)
Place of birth for the foreign-born population - Peru (%)
Place of birth for the foreign-born population - Uruguay (%)
Place of birth for the foreign-born population - Venezuela (%)
Place of birth for the foreign-born population - Other South America (%)
Place of birth for the foreign-born population - Canada (%)
Place of birth for the foreign-born population - Other Northern America (%)
Place of birth for the foreign-born population - Other (%)
Latest news about races in Rome, GA collected exclusively by city-data.com from local newspapers, TV, and radio stations
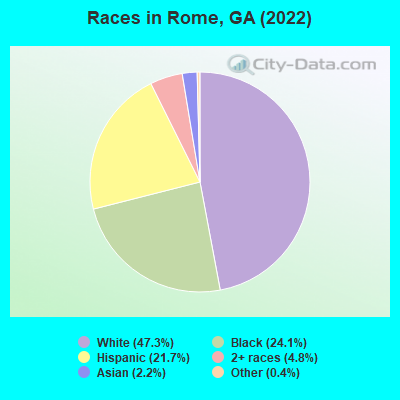
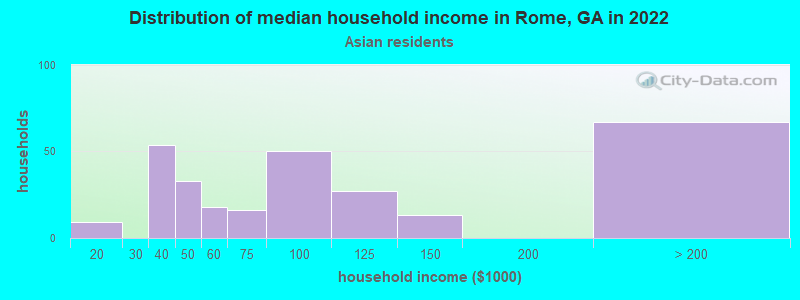
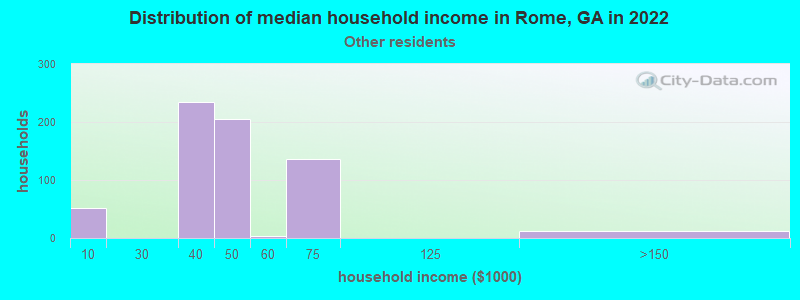
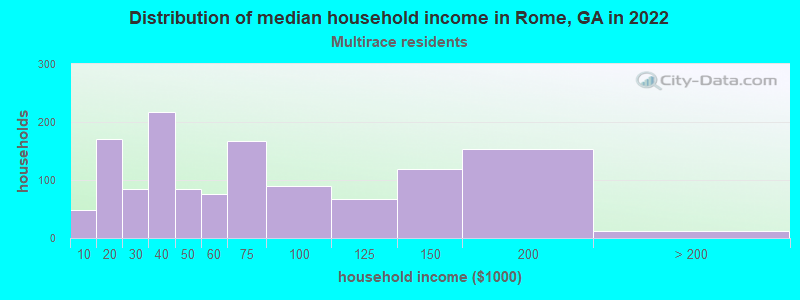
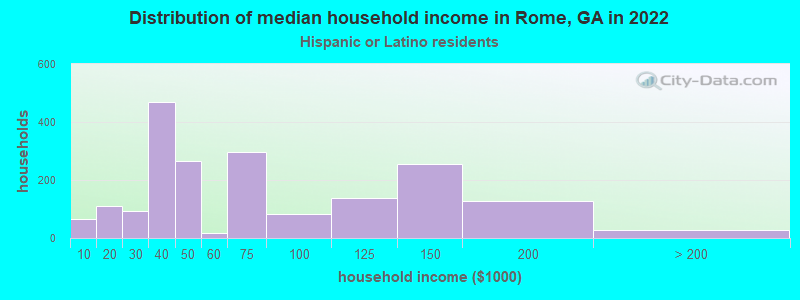
According to 2022 data, the most numerous races in Rome, GA are White alone (18,101 residents), Black alone (9,237 residents), and Hispanic (8,298 residents). 79.5% of Rome residents speak English at home. 12.8% of Rome, GA residents are foreign-born (9.9% born in Latin America, 1.9% born in Asia), which is 21.8% greater than the foreign-born rate of 10.0% across the entire state of Georgia.
Race distribution in Rome
2000 2022
5,128,661 62.6% White alone 2,331,465 28.5% Black alone 435,227 5.3% Hispanic 171,513 2.1% Asian alone 87,364 1.1% Two or more races 17,670 0.2% American Indian alone 11,275 0.1% Other race alone 3,278 0.04% Native Hawaiian and Other
5,415,657 49.6% White alone 3,349,240 30.7% Black alone 1,132,604 10.4% Hispanic 479,156 4.4% Asian alone 462,923 4.2% Two or more races 54,416 0.5% Other race alone 11,923 0.1% American Indian alone 6,957 0.06% Native Hawaiian and Other
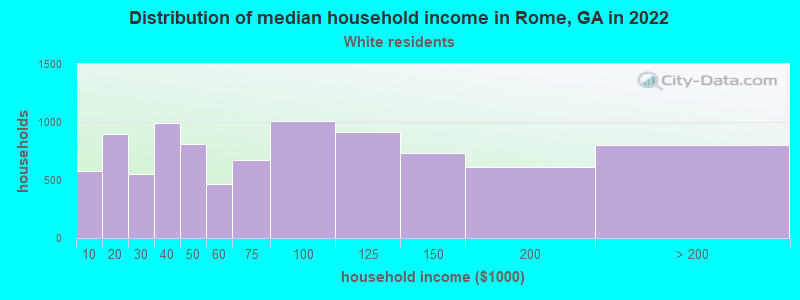
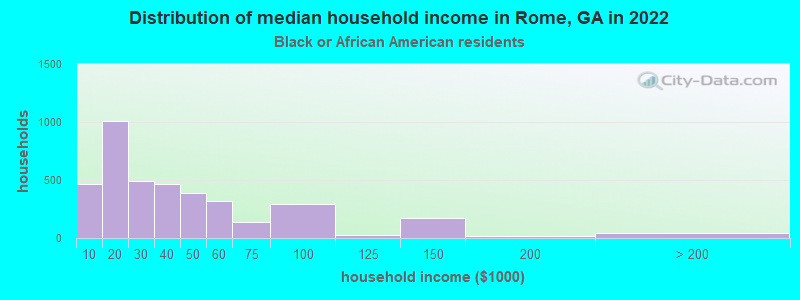
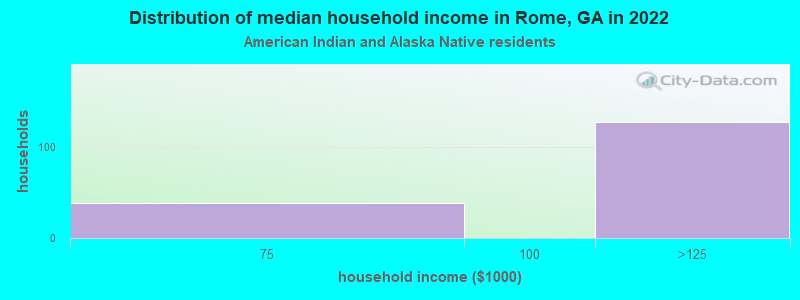
Income and house value in Rome Median household income in 2022 $64,339 White non-Hispanic householders$26,901 Black householders$126,945 American Indian and Alaska Native householders$94,705 Asian householders$46,498 Some other race householders$66,460 Two or more races householders$46,276 Hispanic or Latino race householdersMedian 2022 house value $232,123 White Non-Hispanic householders$127,595 Black or African American householders$191,033 American Indian or Alaska Native householders $380,384 Asian householders$140,090 Some other race householders$150,904 Two or more races householders$153,066 Hispanic or Latino householders
Median age by race in Rome
43.8 Median age for White residents43.7 43.8 36.6 Median age for Black or African American residents35.4 38.2 22.6 Median age for American Indian / Alaska Native residents25.5 19.5 26.5 Median age for Asian residents24.6 24.4 -657,243,815.6 Median age for Native Hawaiian / Pacific Islander residents-666,666,666.0 -666,666,666.0 26.6 Median age for Other race residents26.8 32.3 18.7 Median age for Two or more races residents14.5 32.5 46.8 Median age for White alone residents47.1 45.6 22.4 Median age for Hispanic or Latino residents21.0 24.0
Owner/renter occupied households by race in Rome
House owners and renters - White residents 5,469 59.8% Owner occupied3,681 40.2% Renter occupiedHouse owners and renters - Black or African American residents 1,688 43.4% Owner occupied2,201 56.6% Renter occupiedHouse owners and renters - American Indian / Alaska Native residents 91 67.0% Owner occupied45 33.0% Renter occupiedHouse owners and renters - Asian residents 226 76.3% Owner occupied70 23.7% Renter occupiedHouse owners and renters - Native Hawaiian / Pacific Islander residents 16 100.0% Renter occupiedHouse owners and renters - Other race residents 487 56.4% Owner occupied375 43.6% Renter occupiedHouse owners and renters - Two or more races residents 696 61.8% Owner occupied430 38.2% Renter occupiedHouse owners and renters - White alone residents 5,220 60.2% Owner occupied3,456 39.8% Renter occupiedHouse owners and renters - Hispanic or Latino residents 1,237 58.1% Owner occupied893 41.9% Renter occupied
Language usage in Rome
English speakers - Total 79.5% of residents of Rome speak English at home.
17.0% of residents speak Spanish at home 2,914 48.0% Speak English very well3,153 52.0% Speak English less than very well4.3% of residents speak other language at home 1,088 70.5% Speak English very well455 29.5% Speak English less than very well
English speakers - Born in the United States 93.8% of residents of Rome speak English at home.
2.9% of residents speak Spanish at home 213 96.4% Speak English very well8 3.6% Speak English less than very well2.2% of residents speak other language at home 158 95.2% Speak English very well8 4.8% Speak English less than very well
English speakers - Native, born elsewhere 26.6% of residents of Rome speak English at home.
56.9% of residents speak Spanish at home 173 100.0% Speak English very well20.1% of residents speak other language at home 61 100.0% Speak English very well
English speakers - Foreign-born 5.0% of residents of Rome speak English at home.
81.2% of residents speak Spanish at home 728 18.7% Speak English very well3,158 81.3% Speak English less than very well14.5% of residents speak other language at home 371 53.5% Speak English very well323 46.5% Speak English less than very well
White (Caucasian) - Speak only English Native:
95.5% (17,612)Foreign-born:
10.9% (99)
White (Caucasian) - Speak another language Native:
4.0% (738)Foreign-born:
81.8% (741)
Black or African American - Speak only English Native:
99.5% (8,657)Foreign-born:
71.8% (28)
Black or African American - Speak another language Native:
0.3% (28)Foreign-born:
27.0% (10)
American Indian / Alaska Native - Speak another language Native:
100.0% (245)Foreign-born:
100.0% (572)
Asian - Speak only English Native:
10.7% (16)Foreign-born:
20.3% (131)
Asian - Speak another language Native:
92.2% (138)Foreign-born:
78.7% (508)
Other race - Speak another language Native:
76.2% (1,058)Foreign-born:
99.0% (897)
Two or more races - Speak only English Native:
72.7% (2,184)Foreign-born:
2.2% (42)
Two or more races - Speak another language Native:
27.2% (816)Foreign-born:
97.3% (1,857)
White alone - Speak only English Native:
98.3% (17,174)Foreign-born:
62.0% (79)
White alone - Speak another language Native:
1.7% (301)Foreign-born:
38.2% (48)
Hispanic or Latino - Speak only English Native:
39.9% (1,383)Foreign-born:
1.4% (55)
Hispanic or Latino - Speak another language Native:
59.8% (2,073)Foreign-born:
98.5% (3,934)
Foreign-born residents in Rome 4,856 residents are foreign born (9.9% Latin America , 1.9% Asia ).
This city:
12.8%Georgia:
10.4%
Marital status for residents in Rome Marital status - White (Caucasian) population 15 years and over
Males 33.9% Never married51.4% Now married1.4% Separated2.2% Widowed11.1% DivorcedFemales 27.6% Never married40.6% Now married2.0% Separated12.8% Widowed17.1% DivorcedWomen who gave birth in the past 12 months Now married:
60.7% (168)Unmarried:
39.3% (109)
Women who did not give birth in the past 12 months Now married:
43.1% (1,947)Unmarried:
56.9% (2,571)
Marital status - Black or African American population 15 years and over
Males 56.6% Never married22.0% Now married8.2% Separated5.5% Widowed7.7% DivorcedFemales 59.5% Never married14.6% Now married3.9% Separated6.1% Widowed16.0% DivorcedWomen who gave birth in the past 12 months Now married:
30.8% (30)Unmarried:
69.2% (68)
Women who did not give birth in the past 12 months Now married:
10.5% (249)Unmarried:
89.5% (2,125)
Marital status - American Indian / Alaska Native population 15 years and over
Males 37.1% Never married33.7% Now married0.0% Separated0.5% Widowed28.8% DivorcedFemales 62.7% Never married16.6% Now married20.7% Separated0.0% Widowed0.0% DivorcedWomen who did not give birth in the past 12 months Now married:
25.4% (57)Unmarried:
74.6% (168)
Marital status - Asian population 15 years and over
Males 36.2% Never married63.8% Now married0.0% Separated0.0% Widowed0.0% DivorcedFemales 11.2% Never married71.6% Now married0.0% Separated6.3% Widowed10.9% DivorcedWomen who gave birth in the past 12 months Now married:
100.0% (46)Unmarried:
0.0% (0)
Women who did not give birth in the past 12 months Now married:
67.5% (88)Unmarried:
32.5% (42)
Marital status - Native Hawaiian / Pacific Islander population 15 years and over
Males 0.0% Never married100.0% Now married0.0% Separated0.0% Widowed0.0% DivorcedFemales 100.0% Never married0.0% Now married0.0% Separated0.0% Widowed0.0% DivorcedMarital status - Other race population 15 years and over
Males 50.9% Never married49.1% Now married0.0% Separated0.0% Widowed0.0% DivorcedFemales 56.5% Never married41.8% Now married0.2% Separated0.0% Widowed1.6% DivorcedWomen who gave birth in the past 12 months Now married:
1.9% (1)Unmarried:
98.1% (67)
Women who did not give birth in the past 12 months Now married:
42.3% (297)Unmarried:
57.7% (405)
Marital status - Two or more races population 15 years and over
Males 45.5% Never married49.6% Now married0.0% Separated0.0% Widowed4.8% DivorcedFemales 39.7% Never married47.0% Now married0.9% Separated1.0% Widowed11.4% DivorcedWomen who gave birth in the past 12 months Now married:
56.1% (68)Unmarried:
43.9% (53)
Women who did not give birth in the past 12 months Now married:
42.4% (422)Unmarried:
57.6% (573)
Marital status - White alone, not Hispanic / Latino population 15 years and over
Males 31.1% Never married53.0% Now married1.6% Separated2.5% Widowed11.8% DivorcedFemales 25.0% Never married41.5% Now married1.6% Separated14.5% Widowed17.5% DivorcedWomen who gave birth in the past 12 months Now married:
68.5% (114)Unmarried:
31.5% (52)
Women who did not give birth in the past 12 months Now married:
43.5% (1,734)Unmarried:
56.5% (2,248)
Marital status - Hispanic or Latino population 15 years and over
Males 47.0% Never married47.9% Now married0.0% Separated0.0% Widowed5.1% DivorcedFemales 48.2% Never married40.7% Now married3.5% Separated0.0% Widowed7.5% DivorcedWomen who gave birth in the past 12 months Now married:
51.5% (115)Unmarried:
48.5% (108)
Women who did not give birth in the past 12 months Now married:
41.7% (748)Unmarried:
58.3% (1,047)
Ancestries in Rome
3,448 14.2% American2,880 11.9% English1,348 5.6% Irish482 2.0% German241 1.0% Scotch-Irish222 0.9% European205 0.8% Italian144 0.6% Scottish136 0.6% Israeli93 0.4% Palestinian80 0.3% French69 0.3% British65 0.3% African51 0.2% Northern European40 0.2% Greek32 0.1% Eastern European29 0.1% Polish28 0.1% Welsh26 0.1% Dutch19 0.08% Belgian15 0.06% Scandinavian14 0.06% Hungarian10 0.04% Lebanese10 0.04% Swedish8 0.03% Brazilian8 0.03% Croatian8 0.03% Norwegian7 0.03% Danish6 0.02% Portuguese5 0.02% Australian
Geographical mobility in Rome Same house 1 year ago 16,788 83.2% White (Caucasian)7,133 79.0% Black or African American730 96.8% American Indian / Alaska Native757 90.6% Asian20 100.0% Native Hawaiian / Pacific Islander2,292 93.8% Other race4,953 94.5% Two or more races14,900 81.9% White alone, not Hispanic / Latino7,493 92.5% Hispanic or LatinoMoved within same county 2,049 10.2% White / Caucasian1,132 12.5% Black or African American9 1.2% American Indian / Alaska Native32 3.9% Asian143 5.8% Other race100 1.9% Two or more races1,997 11.0% White alone, not Hispanic / Latino369 4.6% Hispanic or LatinoMoved within same state 1,131 5.6% White / Caucasian613 6.8% Black or African American7 0.9% Asian6 0.2% Other race164 3.1% Two or more races1,179 6.5% White alone, not Hispanic / Latino112 1.4% Hispanic or LatinoMoved from different state 180 0.9% White / Caucasian122 1.4% Black or African American11 1.4% American Indian / Alaska Native38 4.5% Asian12 0.2% Two or more races156 0.9% White alone, not Hispanic / Latino49 0.6% Hispanic or LatinoMoved from abroad 90 0.4% White9 0.1% Black or African American19 0.4% Two or more races71 0.4% White alone, not Hispanic / Latino32 0.4% Hispanic or Latino
Children Nativity (place of birth) in Rome
Children under 6 years - Living with two parents Both parents native 876 100.0% NativeBoth parents foreign-born 269 63.4% Native155 36.6% Foreign-bornOne native, one foreign-born parent 67 100.0% NativeChildren under 6 years - Living with one parent Native parent 878 99.7% Native3 0.3% Foreign-bornForeign-born parent 357 89.3% Native43 10.7% Foreign-bornChildren 6 to 17 years - Living with two parents Both parents native 2,088 100.0% NativeBoth parents foreign-born 695 59.8% Native467 40.2% Foreign-bornOne native, one foreign-born parent 310 100.0% NativeChildren 6 to 17 years - Living with one parent Native parent 2,193 100.0% NativeForeign-born parent 498 50.6% Native486 49.4% Foreign-born
Grandparents responsible for own grandchildren in Rome
Grandparents (30 to 59 years) White / Caucasian 9 7.2% Responsible for grandchildren117 92.8% Not responsible for grandchildrenBlack or African American 31 53.2% Responsible for grandchildren27 46.8% Not responsible for grandchildrenAsian 8 100.0% Not responsible for grandchildrenTwo or more races 1 100.0% Not responsible for grandchildrenWhite alone, not Hispanic / Latino 9 7.0% Responsible for grandchildren125 93.0% Not responsible for grandchildrenGrandparents (60 years and over) White / Caucasian 104 61.8% Responsible for grandchildren64 38.2% Not responsible for grandchildrenBlack or African American 9 10.7% Responsible for grandchildren74 89.3% Not responsible for grandchildrenAsian 22 100.0% Not responsible for grandchildrenTwo or more races 19 82.0% Responsible for grandchildren4 18.0% Not responsible for grandchildrenWhite alone, not Hispanic / Latino 104 61.8% Responsible for grandchildren64 38.2% Not responsible for grandchildren