Races in Rolla, Missouri (MO) Detailed Stats
Data:
Races - White alone (%)
Races - White alone (% change since 2000)
Races - Black alone (%)
Races - Black alone (% change since 2000)
Races - American Indian alone (%)
Races - American Indian alone (% change since 2000)
Races - Asian alone (%)
Races - Asian alone (% change since 2000)
Races - Hispanic (%)
Races - Hispanic (% change since 2000)
Races - Native Hawaiian and Other Pacific Islander alone (%)
Races - Native Hawaiian and Other Pacific Islander alone (% change since 2000)
Races - Two or more races(%)
Races - Two or more races(% change since 2000)
Races - Other race alone (%)
Races - Other race alone (% change since 2000)
Racial diversity
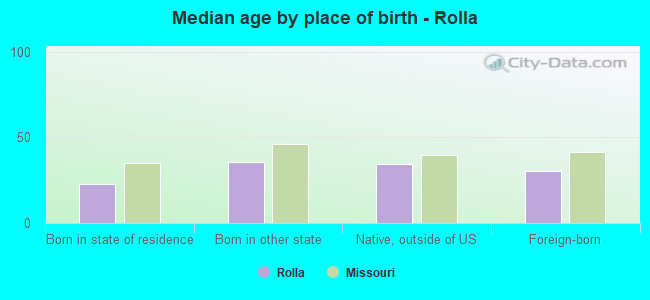
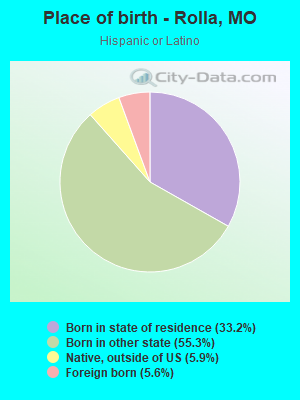
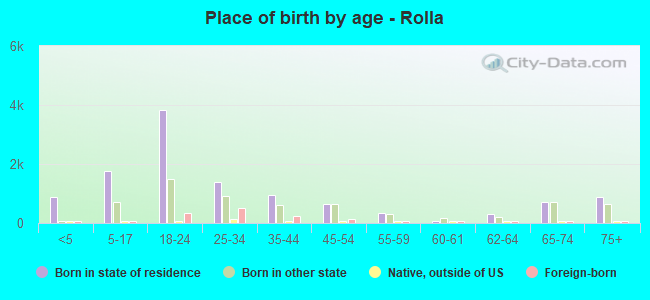
Place of birth - Born in state of residence (%)
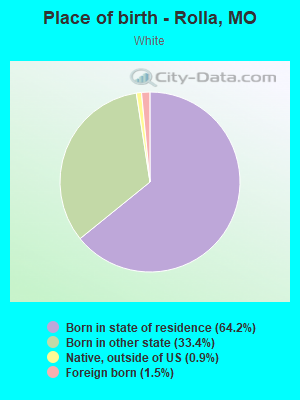
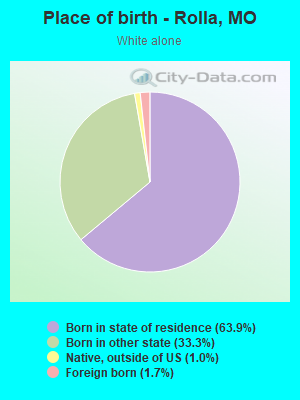
Place of birth - Born in state of residence (%) - White
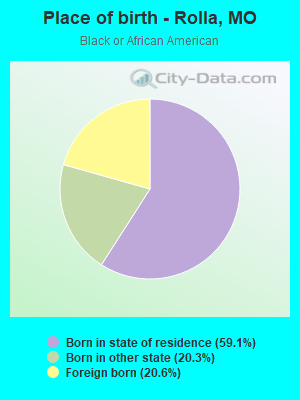
Place of birth - Born in state of residence (%) - Black or African American
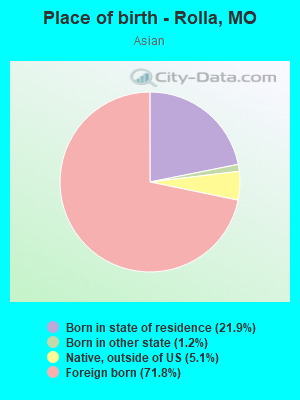
Place of birth - Born in state of residence (%) - Asian
Place of birth - Born in state of residence (%) - Hispanic or Latino
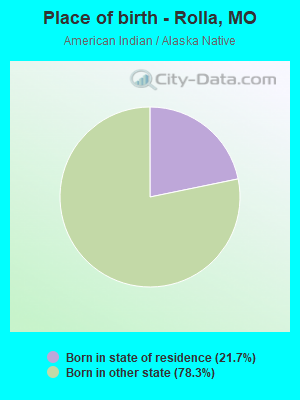
Place of birth - Born in state of residence (%) - American Indian and Alaska Native
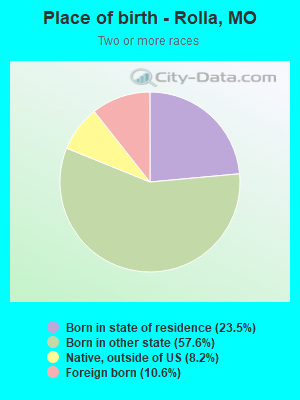
Place of birth - Born in state of residence (%) - Multirace
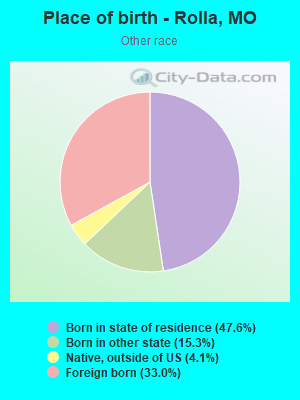
Place of birth - Born in state of residence (%) - Other Race
Place of birth - Born in other state (%)
Place of birth - Born in other state (%) - White
Place of birth - Born in other state (%) - Black or African American
Place of birth - Born in other state (%) - Asian
Place of birth - Born in other state (%) - Hispanic or Latino
Place of birth - Born in other state (%) - American Indian and Alaska Native
Place of birth - Born in other state (%) - Multirace
Place of birth - Born in other state (%) - Other Race
Place of birth - Native, outside of US (%)
Place of birth - Native, outside of US (%) - White
Place of birth - Native, outside of US (%) - Black or African American
Place of birth - Native, outside of US (%) - Asian
Place of birth - Native, outside of US (%) - Hispanic or Latino
Place of birth - Native, outside of US (%) - American Indian and Alaska Native
Place of birth - Native, outside of US (%) - Multirace
Place of birth - Native, outside of US (%) - Other Race
Place of birth - Foreign born (%)
Place of birth - Foreign born (%) - White
Place of birth - Foreign born (%) - Black or African American
Place of birth - Foreign born (%) - Asian
Place of birth - Foreign born (%) - Hispanic or Latino
Place of birth - Foreign born (%) - American Indian and Alaska Native
Place of birth - Foreign born (%) - Multirace
Place of birth - Foreign born (%) - Other Race
Residents speaking English at home (%)
Residents speaking English at home - Born in the United States (%)
Residents speaking English at home - Native, born elsewhere (%)
Residents speaking English at home - Foreign born (%)
Residents speaking Spanish at home (%)
Residents speaking Spanish at home - Born in the United States (%)
Residents speaking Spanish at home - Native, born elsewhere (%)
Residents speaking Spanish at home - Foreign born (%)
Residents speaking other language at home (%)
Residents speaking other language at home - Born in the United States (%)
Residents speaking other language at home - Native, born elsewhere (%)
Residents speaking other language at home - Foreign born (%)
Marital status - Never married (%)
Marital status - Now married (%)
Marital status - Separated (%)
Marital status - Widowed (%)
Marital status - Divorced (%)
Ancestries Reported - Arab (%)
Ancestries Reported - Czech (%)
Ancestries Reported - Danish (%)
Ancestries Reported - Dutch (%)
Ancestries Reported - English (%)
Ancestries Reported - French (%)
Ancestries Reported - French Canadian (%)
Ancestries Reported - German (%)
Ancestries Reported - Greek (%)
Ancestries Reported - Hungarian (%)
Ancestries Reported - Irish (%)
Ancestries Reported - Italian (%)
Ancestries Reported - Lithuanian (%)
Ancestries Reported - Norwegian (%)
Ancestries Reported - Polish (%)
Ancestries Reported - Portuguese (%)
Ancestries Reported - Russian (%)
Ancestries Reported - Scotch-Irish (%)
Ancestries Reported - Scottish (%)
Ancestries Reported - Slovak (%)
Ancestries Reported - Subsaharan African (%)
Ancestries Reported - Swedish (%)
Ancestries Reported - Swiss (%)
Ancestries Reported - Ukrainian (%)
Ancestries Reported - United States (%)
Ancestries Reported - Welsh (%)
Ancestries Reported - West Indian (%)
Ancestries Reported - Other (%)
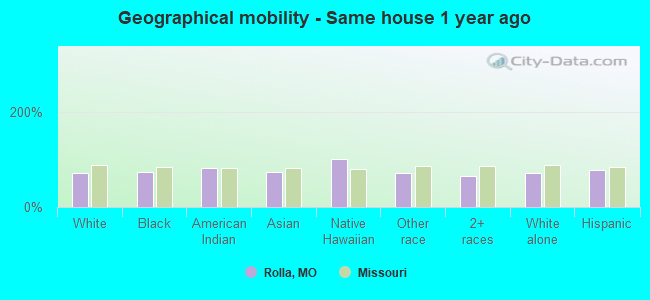
Geographical mobility - Same house 1 year ago (%)
Geographical mobility - Same house 1 year ago (%) - White
Geographical mobility - Same house 1 year ago (%) - Black or African American
Geographical mobility - Same house 1 year ago (%) - Asian
Geographical mobility - Same house 1 year ago (%) - Hispanic or Latino
Geographical mobility - Same house 1 year ago (%) - American Indian and Alaska Native
Geographical mobility - Same house 1 year ago (%) - Multirace
Geographical mobility - Same house 1 year ago (%) - Other Race
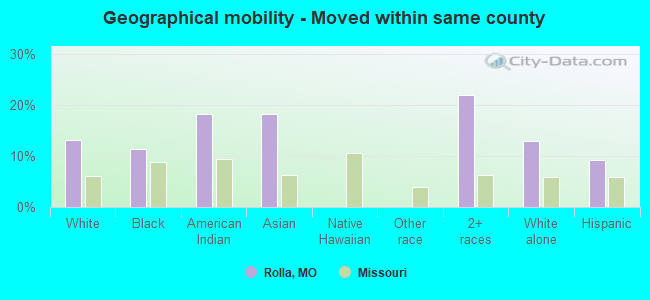
Geographical mobility - Moved within same county (%)
Geographical mobility - Moved within same county (%) - White
Geographical mobility - Moved within same county (%) - Black or African American
Geographical mobility - Moved within same county (%) - Asian
Geographical mobility - Moved within same county (%) - Hispanic or Latino
Geographical mobility - Moved within same county (%) - American Indian and Alaska Native
Geographical mobility - Moved within same county (%) - Multirace
Geographical mobility - Moved within same county (%) - Other Race
Geographical mobility - Moved from different county within same state (%)
Geographical mobility - Moved from different county within same state (%) - White
Geographical mobility - Moved from different county within same state (%) - Black or African American
Geographical mobility - Moved from different county within same state (%) - Asian
Geographical mobility - Moved from different county within same state (%) - Hispanic or Latino
Geographical mobility - Moved from different county within same state (%) - American Indian and Alaska Native
Geographical mobility - Moved from different county within same state (%) - Multirace
Geographical mobility - Moved from different county within same state (%) - Other Race
Geographical mobility - Moved from different state (%)
Geographical mobility - Moved from different state (%) - White
Geographical mobility - Moved from different state (%) - Black or African American
Geographical mobility - Moved from different state (%) - Asian
Geographical mobility - Moved from different state (%) - Hispanic or Latino
Geographical mobility - Moved from different state (%) - American Indian and Alaska Native
Geographical mobility - Moved from different state (%) - Multirace
Geographical mobility - Moved from different state (%) - Other Race
Geographical mobility - Moved from abroad (%)
Geographical mobility - Moved from abroad (%) - White
Geographical mobility - Moved from abroad (%) - Black or African American
Geographical mobility - Moved from abroad (%) - Asian
Geographical mobility - Moved from abroad (%) - Hispanic or Latino
Geographical mobility - Moved from abroad (%) - American Indian and Alaska Native
Geographical mobility - Moved from abroad (%) - Multirace
Geographical mobility - Moved from abroad (%) - Other Race
Place of birth for the foreign-born population - Ireland (%)
Place of birth for the foreign-born population - Denmark (%)
Place of birth for the foreign-born population - Norway (%)
Place of birth for the foreign-born population - Sweden (%)
Place of birth for the foreign-born population - United Kingdom (%)
Place of birth for the foreign-born population - England (%)
Place of birth for the foreign-born population - Scotland (%)
Place of birth for the foreign-born population - Other Northern Europe (%)
Place of birth for the foreign-born population - Austria (%)
Place of birth for the foreign-born population - Belgium (%)
Place of birth for the foreign-born population - France (%)
Place of birth for the foreign-born population - Germany (%)
Place of birth for the foreign-born population - Netherlands (%)
Place of birth for the foreign-born population - Switzerland (%)
Place of birth for the foreign-born population - Other Western Europe (%)
Place of birth for the foreign-born population - Greece (%)
Place of birth for the foreign-born population - Italy (%)
Place of birth for the foreign-born population - Portugal (%)
Place of birth for the foreign-born population - Spain (%)
Place of birth for the foreign-born population - Other Southern Europe (%)
Place of birth for the foreign-born population - Albania (%)
Place of birth for the foreign-born population - Belarus (%)
Place of birth for the foreign-born population - Bosnia and Herzegovina (%)
Place of birth for the foreign-born population - Bulgaria (%)
Place of birth for the foreign-born population - Croatia (%)
Place of birth for the foreign-born population - Czechoslovakia (%)
Place of birth for the foreign-born population - Hungary (%)
Place of birth for the foreign-born population - Latvia (%)
Place of birth for the foreign-born population - Lithuania (%)
Place of birth for the foreign-born population - North Macedonia (Macedonia) (%)
Place of birth for the foreign-born population - Moldova (%)
Place of birth for the foreign-born population - Poland (%)
Place of birth for the foreign-born population - Romania (%)
Place of birth for the foreign-born population - Russia (%)
Place of birth for the foreign-born population - Serbia (%)
Place of birth for the foreign-born population - Ukraine (%)
Place of birth for the foreign-born population - Other Eastern Europe (%)
Place of birth for the foreign-born population - China (%)
Place of birth for the foreign-born population - Hong Kong (%)
Place of birth for the foreign-born population - Taiwan (%)
Place of birth for the foreign-born population - Japan (%)
Place of birth for the foreign-born population - Korea (%)
Place of birth for the foreign-born population - Other Eastern Asia (%)
Place of birth for the foreign-born population - Afghanistan (%)
Place of birth for the foreign-born population - Bangladesh (%)
Place of birth for the foreign-born population - India (%)
Place of birth for the foreign-born population - Iran (%)
Place of birth for the foreign-born population - Kazakhstan (%)
Place of birth for the foreign-born population - Nepal (%)
Place of birth for the foreign-born population - Pakistan (%)
Place of birth for the foreign-born population - Sri Lanka (%)
Place of birth for the foreign-born population - Uzbekistan (%)
Place of birth for the foreign-born population - Other South Central Asia (%)
Place of birth for the foreign-born population - Burma (%)
Place of birth for the foreign-born population - Cambodia (%)
Place of birth for the foreign-born population - Indonesia (%)
Place of birth for the foreign-born population - Laos (%)
Place of birth for the foreign-born population - Malaysia (%)
Place of birth for the foreign-born population - Philippines (%)
Place of birth for the foreign-born population - Singapore (%)
Place of birth for the foreign-born population - Thailand (%)
Place of birth for the foreign-born population - Vietnam (%)
Place of birth for the foreign-born population - Other South Eastern Asia (%)
Place of birth for the foreign-born population - Armenia (%)
Place of birth for the foreign-born population - Iraq (%)
Place of birth for the foreign-born population - Israel (%)
Place of birth for the foreign-born population - Jordan (%)
Place of birth for the foreign-born population - Kuwait (%)
Place of birth for the foreign-born population - Lebanon (%)
Place of birth for the foreign-born population - Saudi Arabia (%)
Place of birth for the foreign-born population - Syria (%)
Place of birth for the foreign-born population - Turkey (%)
Place of birth for the foreign-born population - Yemen (%)
Place of birth for the foreign-born population - Other Western Asia (%)
Place of birth for the foreign-born population - Eritrea (%)
Place of birth for the foreign-born population - Ethiopia (%)
Place of birth for the foreign-born population - Kenya (%)
Place of birth for the foreign-born population - Somalia (%)
Place of birth for the foreign-born population - Uganda (%)
Place of birth for the foreign-born population - Zimbabwe (%)
Place of birth for the foreign-born population - Other Eastern Africa (%)
Place of birth for the foreign-born population - Cameroon (%)
Place of birth for the foreign-born population - Congo (%)
Place of birth for the foreign-born population - Democratic Republic of Congo (Zaire) (%)
Place of birth for the foreign-born population - Other Middle Africa (%)
Place of birth for the foreign-born population - Egypt (%)
Place of birth for the foreign-born population - Morocco (%)
Place of birth for the foreign-born population - Sudan (%)
Place of birth for the foreign-born population - Other Northern Africa (%)
Place of birth for the foreign-born population - South Africa (%)
Place of birth for the foreign-born population - Other Southern Africa (%)
Place of birth for the foreign-born population - Cabo Verde (%)
Place of birth for the foreign-born population - Ghana (%)
Place of birth for the foreign-born population - Liberia (%)
Place of birth for the foreign-born population - Nigeria (%)
Place of birth for the foreign-born population - Senegal (%)
Place of birth for the foreign-born population - Sierra Leone (%)
Place of birth for the foreign-born population - Other Western Africa (%)
Place of birth for the foreign-born population - Australia (%)
Place of birth for the foreign-born population - New Zealand (%)
Place of birth for the foreign-born population - Fiji (%)
Place of birth for the foreign-born population - Micronesia (%)
Place of birth for the foreign-born population - Bahamas (%)
Place of birth for the foreign-born population - Barbados (%)
Place of birth for the foreign-born population - Cuba (%)
Place of birth for the foreign-born population - Dominica (%)
Place of birth for the foreign-born population - Dominican Republic (%)
Place of birth for the foreign-born population - Grenada (%)
Place of birth for the foreign-born population - Haiti (%)
Place of birth for the foreign-born population - Jamaica (%)
Place of birth for the foreign-born population - St. Vincent and the Grenadines (%)
Place of birth for the foreign-born population - Trinidad and Tobago (%)
Place of birth for the foreign-born population - West Indies (%)
Place of birth for the foreign-born population - Other Caribbean (%)
Place of birth for the foreign-born population - Belize (%)
Place of birth for the foreign-born population - Costa Rica (%)
Place of birth for the foreign-born population - El Salvador (%)
Place of birth for the foreign-born population - Guatemala (%)
Place of birth for the foreign-born population - Honduras (%)
Place of birth for the foreign-born population - Mexico (%)
Place of birth for the foreign-born population - Nicaragua (%)
Place of birth for the foreign-born population - Panama (%)
Place of birth for the foreign-born population - Other Central America (%)
Place of birth for the foreign-born population - Argentina (%)
Place of birth for the foreign-born population - Bolivia (%)
Place of birth for the foreign-born population - Brazil (%)
Place of birth for the foreign-born population - Chile (%)
Place of birth for the foreign-born population - Colombia (%)
Place of birth for the foreign-born population - Ecuador (%)
Place of birth for the foreign-born population - Guyana (%)
Place of birth for the foreign-born population - Peru (%)
Place of birth for the foreign-born population - Uruguay (%)
Place of birth for the foreign-born population - Venezuela (%)
Place of birth for the foreign-born population - Other South America (%)
Place of birth for the foreign-born population - Canada (%)
Place of birth for the foreign-born population - Other Northern America (%)
Place of birth for the foreign-born population - Other (%)
Latest news about races in Rolla, MO collected exclusively by city-data.com from local newspapers, TV, and radio stations
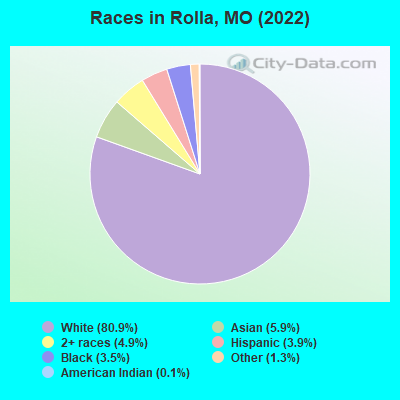
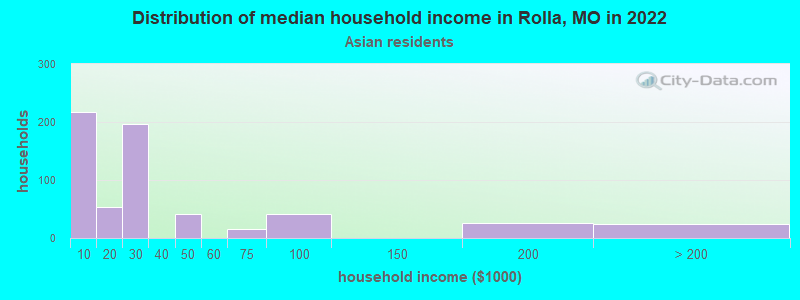
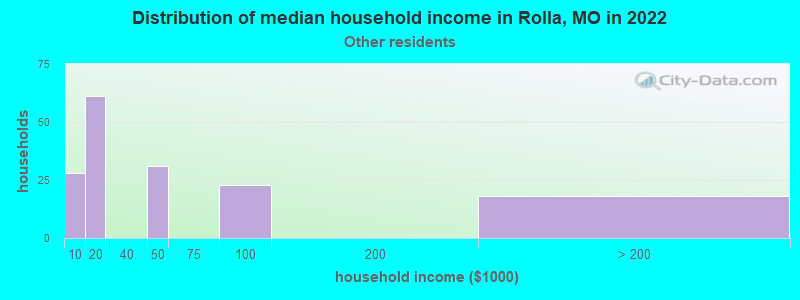
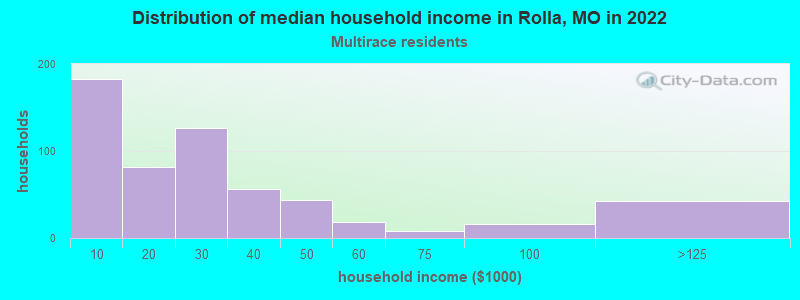
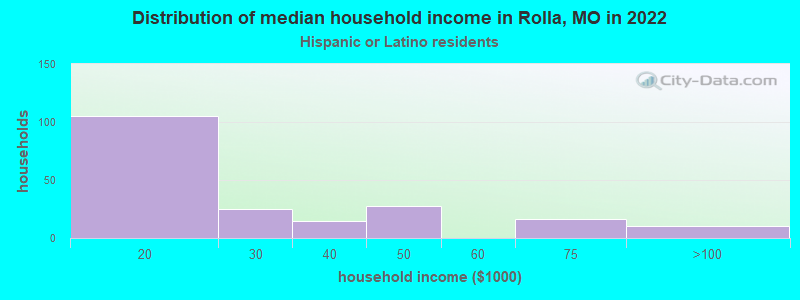
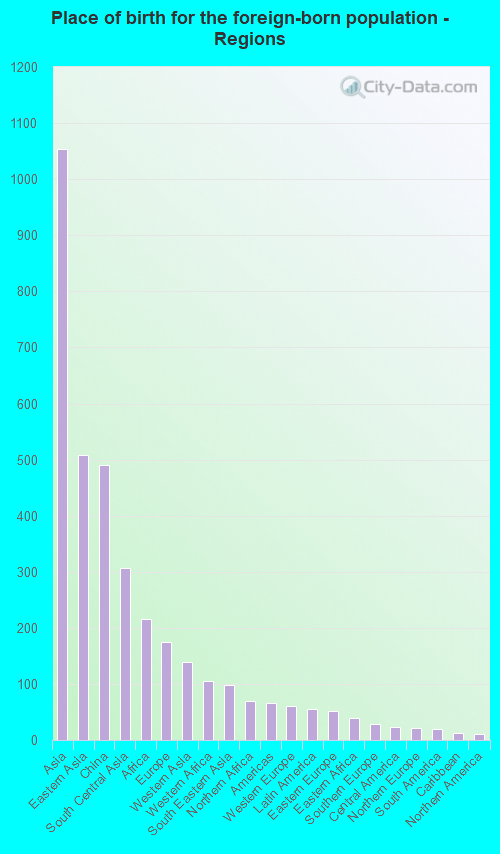
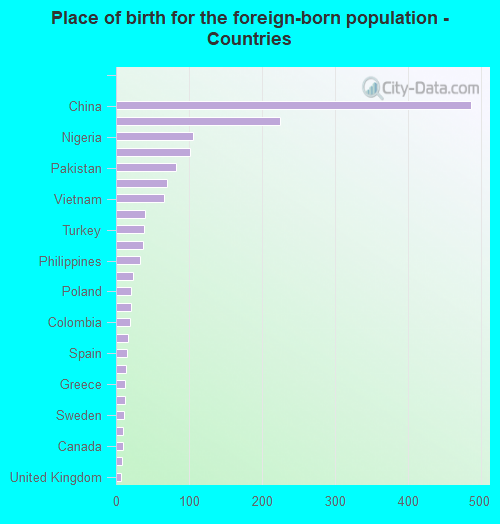
According to 2022 data, the most numerous races in Rolla, MO are White alone (16,265 residents), Black alone (706 residents), and Two or more races (994 residents). 91.9% of Rolla residents speak English at home. 7.5% of Rolla, MO residents are foreign-born (5.4% born in Asia, 1.1% born in Africa, 0.9% born in Europe), which is 46.8% greater than the foreign-born rate of 4.0% across the entire state of Missouri.
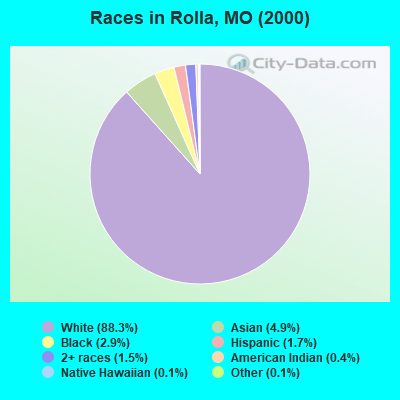
Race distribution in Rolla
2000 2022
4,686,474 83.8% White alone 625,667 11.2% Black alone 118,592 2.1% Hispanic 71,905 1.3% Two or more races 61,041 1.1% Asian alone 23,302 0.4% American Indian alone 5,291 0.09% Other race alone 2,939 0.05% Native Hawaiian and Other
4,733,411 76.6% White alone 656,739 10.6% Black alone 316,300 5.1% Two or more races 291,763 4.7% Hispanic 132,436 2.1% Asian alone 27,467 0.4% Other race alone 12,313 0.2% American Indian alone 7,528 0.1% Native Hawaiian and Other
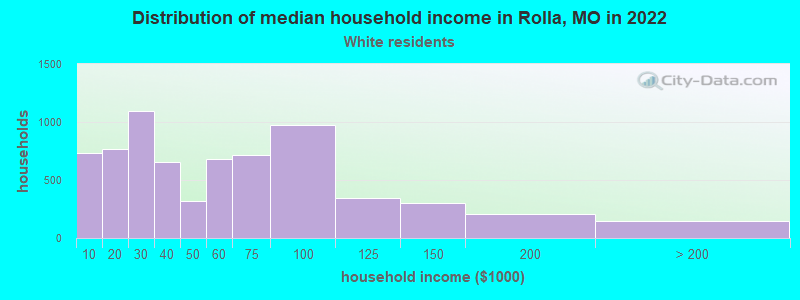
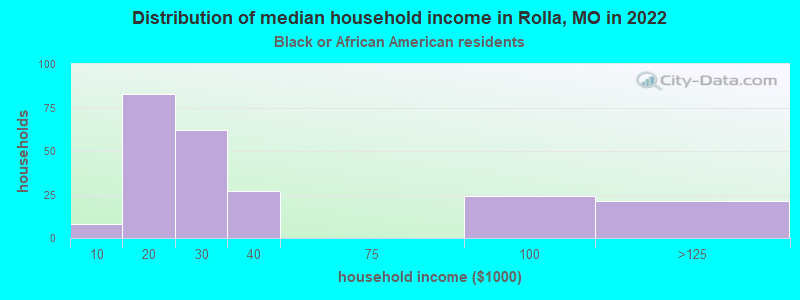
Income and house value in Rolla Median household income in 2022 $47,777 White non-Hispanic householders$21,184 Black householders$22,924 Asian householders$23,271 Two or more races householdersMedian 2022 house value $186,047 White Non-Hispanic householders$175,829 Black or African American householders $248,300 Asian householders$386,113 Some other race householders$106,923 Two or more races householders$363,777 Hispanic or Latino householders
Median age by race in Rolla
28.2 Median age for White residents24.5 33.0 31.7 Median age for Black or African American residents33.9 25.4 49.3 Median age for American Indian / Alaska Native residents-652,291,104.5 47.1 28.6 Median age for Asian residents29.0 26.9 -693,430,656.2 Median age for Native Hawaiian / Pacific Islander residents-683,513,838.1 -752,136,751.4 27.5 Median age for Other race residents27.6 25.7 26.0 Median age for Two or more races residents26.3 28.7 28.4 Median age for White alone residents24.7 34.0 23.3 Median age for Hispanic or Latino residents38.2 21.3
Owner/renter occupied households by race in Rolla
House owners and renters - White residents 3,067 44.6% Owner occupied3,811 55.4% Renter occupiedHouse owners and renters - Black or African American residents 59 25.5% Owner occupied173 74.5% Renter occupiedHouse owners and renters - American Indian / Alaska Native residents 38 100.0% Renter occupiedHouse owners and renters - Asian residents 115 18.6% Owner occupied502 81.4% Renter occupiedHouse owners and renters - Native Hawaiian / Pacific Islander residents 8 100.0% Renter occupiedHouse owners and renters - Other race residents 43 22.3% Owner occupied150 77.7% Renter occupiedHouse owners and renters - Two or more races residents 106 19.0% Owner occupied450 81.0% Renter occupiedHouse owners and renters - White alone residents 3,074 44.8% Owner occupied3,793 55.2% Renter occupiedHouse owners and renters - Hispanic or Latino residents 22 11.2% Owner occupied178 88.8% Renter occupied
Language usage in Rolla
English speakers - Total 91.9% of residents of Rolla speak English at home.
0.9% of residents speak Spanish at home 113 68.1% Speak English very well53 31.9% Speak English less than very well7.2% of residents speak other language at home 809 58.5% Speak English very well574 41.5% Speak English less than very well
English speakers - Born in the United States 96.1% of residents of Rolla speak English at home.
0.5% of residents speak Spanish at home 35 100.0% Speak English very well3.1% of residents speak other language at home 181 92.3% Speak English very well15 7.7% Speak English less than very well
English speakers - Native, born elsewhere 80.4% of residents of Rolla speak English at home.
2.9% of residents speak Spanish at home 10 100.0% Speak English very well18.1% of residents speak other language at home 45 72.6% Speak English very well17 27.4% Speak English less than very well
English speakers - Foreign-born 25.2% of residents of Rolla speak English at home.
3.9% of residents speak Spanish at home 26 44.1% Speak English very well33 55.9% Speak English less than very well70.3% of residents speak other language at home 527 49.6% Speak English very well536 50.4% Speak English less than very well
White (Caucasian) - Speak only English Native:
99.1% (15,263)Foreign-born:
37.6% (93)
White (Caucasian) - Speak another language Native:
1.0% (154)Foreign-born:
62.7% (156)
Black or African American - Speak only English Native:
99.2% (534)Foreign-born:
62.5% (95)
Asian - Speak only English Native:
83.5% (190)Foreign-born:
20.3% (176)
Asian - Speak another language Native:
21.9% (50)Foreign-born:
79.7% (691)
Other race - Speak only English Native:
100.0% (247)Foreign-born:
18.4% (22)
Other race - Speak another language Native:
5.6% (14)Foreign-born:
82.9% (98)
Two or more races - Speak only English Native:
81.7% (1,003)Foreign-born:
6.9% (11)
Two or more races - Speak another language Native:
20.0% (246)Foreign-born:
94.3% (146)
White alone - Speak only English Native:
98.9% (15,085)Foreign-born:
33.2% (95)
White alone - Speak another language Native:
1.1% (163)Foreign-born:
66.3% (189)
Hispanic or Latino - Speak another language Native:
5.3% (37)Foreign-born:
99.4% (44)
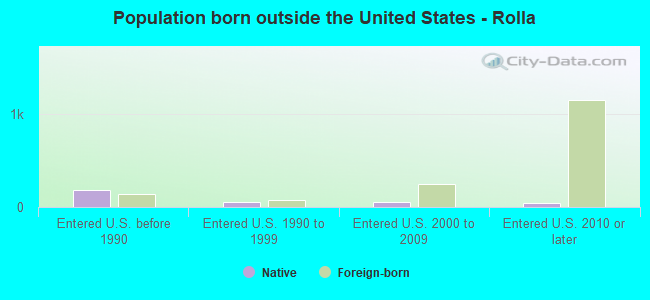
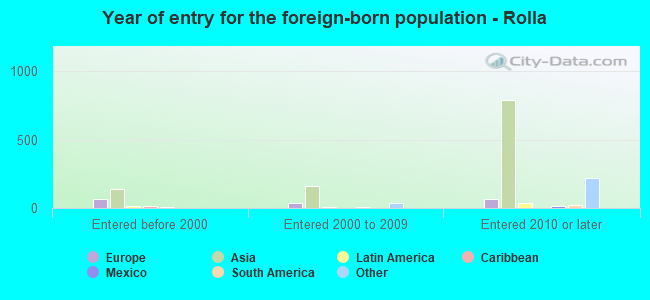
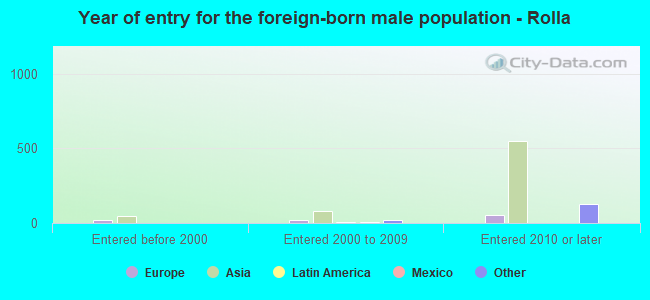
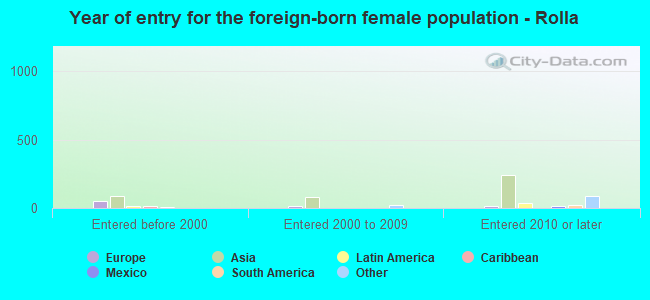
Foreign-born residents in Rolla 1,511 residents are foreign born (5.4% Asia , 1.1% Africa , 0.9% Europe ).
This city:
7.5%Missouri:
4.2%
Marital status for residents in Rolla Marital status - White (Caucasian) population 15 years and over
Males 56.3% Never married32.3% Now married1.1% Separated1.8% Widowed8.4% DivorcedFemales 35.9% Never married34.1% Now married1.5% Separated11.1% Widowed17.4% DivorcedWomen who gave birth in the past 12 months Now married:
73.8% (102)Unmarried:
26.2% (36)
Women who did not give birth in the past 12 months Now married:
30.2% (1,101)Unmarried:
69.8% (2,547)
Marital status - Black or African American population 15 years and over
Males 54.7% Never married29.2% Now married1.2% Separated0.0% Widowed14.9% DivorcedFemales 53.9% Never married23.4% Now married0.0% Separated5.2% Widowed17.5% DivorcedWomen who did not give birth in the past 12 months Now married:
0.0% (0)Unmarried:
100.0% (100)
Marital status - American Indian / Alaska Native population 15 years and over
Males 100.0% Never married0.0% Now married0.0% Separated0.0% Widowed0.0% DivorcedFemales 20.3% Never married6.8% Now married72.9% Separated0.0% Widowed0.0% DivorcedWomen who did not give birth in the past 12 months Now married:
0.0% (0)Unmarried:
100.0% (12)
Marital status - Asian population 15 years and over
Males 73.3% Never married25.4% Now married0.0% Separated0.0% Widowed1.3% DivorcedFemales 32.8% Never married63.8% Now married0.3% Separated3.1% Widowed0.0% DivorcedWomen who gave birth in the past 12 months Now married:
100.0% (5)Unmarried:
0.0% (0)
Women who did not give birth in the past 12 months Now married:
47.5% (136)Unmarried:
52.5% (150)
Marital status - Other race population 15 years and over
Males 78.5% Never married21.5% Now married0.0% Separated0.0% Widowed0.0% DivorcedFemales 57.4% Never married42.6% Now married0.0% Separated0.0% Widowed0.0% DivorcedWomen who did not give birth in the past 12 months Now married:
29.9% (56)Unmarried:
70.1% (131)
Marital status - Two or more races population 15 years and over
Males 79.1% Never married10.3% Now married0.0% Separated1.8% Widowed8.8% DivorcedFemales 47.2% Never married22.4% Now married0.0% Separated4.2% Widowed26.2% DivorcedWomen who gave birth in the past 12 months Now married:
100.0% (7)Unmarried:
0.0% (0)
Women who did not give birth in the past 12 months Now married:
18.4% (37)Unmarried:
81.6% (166)
Marital status - White alone, not Hispanic / Latino population 15 years and over
Males 55.8% Never married32.7% Now married1.1% Separated1.9% Widowed8.5% DivorcedFemales 35.6% Never married34.4% Now married1.3% Separated11.2% Widowed17.4% DivorcedWomen who gave birth in the past 12 months Now married:
71.3% (91)Unmarried:
28.7% (37)
Women who did not give birth in the past 12 months Now married:
30.5% (1,102)Unmarried:
69.5% (2,509)
Marital status - Hispanic or Latino population 15 years and over
Males 80.2% Never married7.2% Now married0.0% Separated0.0% Widowed12.6% DivorcedFemales 55.2% Never married16.8% Now married22.0% Separated0.0% Widowed6.0% DivorcedWomen who gave birth in the past 12 months Now married:
100.0% (19)Unmarried:
0.0% (0)
Women who did not give birth in the past 12 months Now married:
19.5% (41)Unmarried:
80.5% (168)
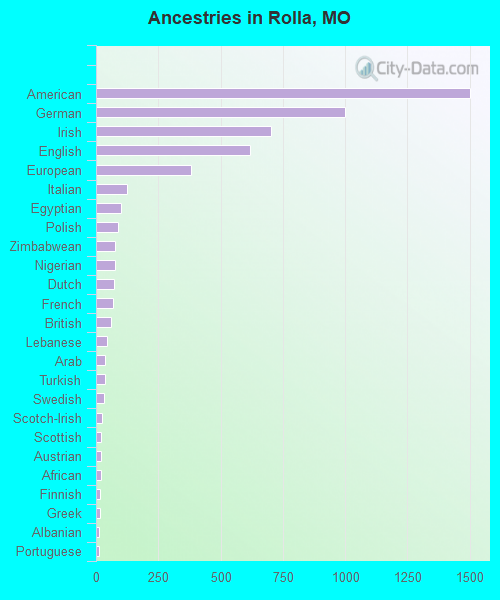
Ancestries in Rolla
1,502 20.5% American1,001 13.7% German703 9.6% Irish620 8.5% English383 5.2% European125 1.7% Italian99 1.4% Egyptian87 1.2% Polish77 1.1% Zimbabwean76 1.0% Nigerian72 1.0% Dutch68 0.9% French59 0.8% British43 0.6% Lebanese37 0.5% Arab36 0.5% Turkish33 0.5% Swedish24 0.3% Scotch-Irish21 0.3% Scottish19 0.3% Austrian19 0.3% African17 0.2% Finnish16 0.2% Greek14 0.2% Albanian14 0.2% Portuguese11 0.2% West Indian10 0.1% Czech9 0.1% Ukrainian9 0.1% Trinidadian and Tobagonian7 0.10% Welsh5 0.07% Norwegian5 0.07% Dutch West Indian4 0.05% Serbian3 0.04% Palestinian
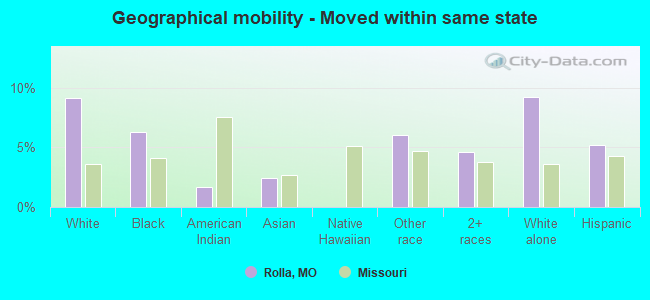
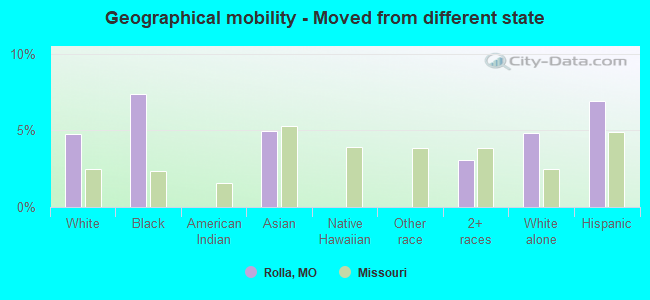
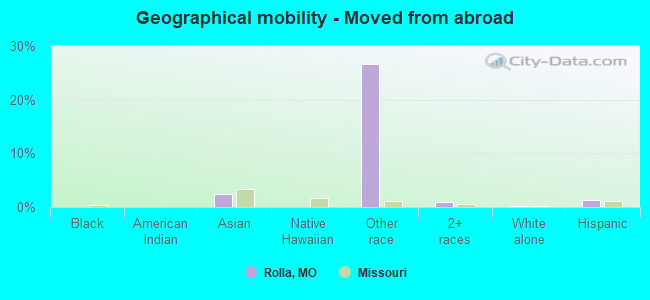
Geographical mobility in Rolla Same house 1 year ago 11,707 72.2% White (Caucasian)501 73.9% Black or African American54 82.1% American Indian / Alaska Native887 72.9% Asian10 100.0% Native Hawaiian / Pacific Islander263 72.4% Other race931 65.2% Two or more races11,631 72.1% White alone, not Hispanic / Latino587 77.4% Hispanic or LatinoMoved within same county 2,125 13.1% White / Caucasian77 11.4% Black or African American12 18.2% American Indian / Alaska Native220 18.1% Asian313 21.9% Two or more races2,093 13.0% White alone, not Hispanic / Latino69 9.1% Hispanic or LatinoMoved within same state 1,489 9.2% White / Caucasian43 6.3% Black or African American1 1.7% American Indian / Alaska Native30 2.5% Asian22 6.0% Other race65 4.6% Two or more races1,481 9.2% White alone, not Hispanic / Latino39 5.2% Hispanic or LatinoMoved from different state 767 4.7% White / Caucasian50 7.4% Black or African American60 4.9% Asian44 3.1% Two or more races776 4.8% White alone, not Hispanic / Latino53 6.9% Hispanic or LatinoMoved from abroad 20 0.1% White29 2.4% Asian96 26.6% Other race14 1.0% Two or more races21 0.1% White alone, not Hispanic / Latino10 1.3% Hispanic or Latino
Children Nativity (place of birth) in Rolla
Children under 6 years - Living with two parents Both parents native 568 100.0% NativeBoth parents foreign-born 94 100.0% NativeOne native, one foreign-born parent 23 100.0% NativeChildren under 6 years - Living with one parent Native parent 481 100.0% NativeChildren 6 to 17 years - Living with two parents Both parents native 984 100.0% NativeBoth parents foreign-born 70 81.6% Native16 18.4% Foreign-bornOne native, one foreign-born parent 17 100.0% NativeChildren 6 to 17 years - Living with one parent Native parent 935 96.8% Native31 3.2% Foreign-bornForeign-born parent 25 100.0% Native
Grandparents responsible for own grandchildren in Rolla
Grandparents (30 to 59 years) White / Caucasian 49 81.6% Responsible for grandchildren11 18.4% Not responsible for grandchildrenAsian 12 100.0% Not responsible for grandchildrenTwo or more races 20 100.0% Responsible for grandchildrenWhite alone, not Hispanic / Latino 50 81.5% Responsible for grandchildren11 18.5% Not responsible for grandchildrenGrandparents (60 years and over) White / Caucasian 43 52.0% Responsible for grandchildren40 48.0% Not responsible for grandchildrenAsian 12 100.0% Not responsible for grandchildrenTwo or more races 9 100.0% Not responsible for grandchildrenWhite alone, not Hispanic / Latino 44 51.6% Responsible for grandchildren41 48.4% Not responsible for grandchildren