Races in Rockville, Maryland (MD) Detailed Stats
Data:
Races - White alone (%)
Races - White alone (% change since 2000)
Races - Black alone (%)
Races - Black alone (% change since 2000)
Races - American Indian alone (%)
Races - American Indian alone (% change since 2000)
Races - Asian alone (%)
Races - Asian alone (% change since 2000)
Races - Hispanic (%)
Races - Hispanic (% change since 2000)
Races - Native Hawaiian and Other Pacific Islander alone (%)
Races - Native Hawaiian and Other Pacific Islander alone (% change since 2000)
Races - Two or more races(%)
Races - Two or more races(% change since 2000)
Races - Other race alone (%)
Races - Other race alone (% change since 2000)
Racial diversity
Place of birth - Born in state of residence (%)
Place of birth - Born in state of residence (%) - White
Place of birth - Born in state of residence (%) - Black or African American
Place of birth - Born in state of residence (%) - Asian
Place of birth - Born in state of residence (%) - Hispanic or Latino
Place of birth - Born in state of residence (%) - American Indian and Alaska Native
Place of birth - Born in state of residence (%) - Multirace
Place of birth - Born in state of residence (%) - Other Race
Place of birth - Born in other state (%)
Place of birth - Born in other state (%) - White
Place of birth - Born in other state (%) - Black or African American
Place of birth - Born in other state (%) - Asian
Place of birth - Born in other state (%) - Hispanic or Latino
Place of birth - Born in other state (%) - American Indian and Alaska Native
Place of birth - Born in other state (%) - Multirace
Place of birth - Born in other state (%) - Other Race
Place of birth - Native, outside of US (%)
Place of birth - Native, outside of US (%) - White
Place of birth - Native, outside of US (%) - Black or African American
Place of birth - Native, outside of US (%) - Asian
Place of birth - Native, outside of US (%) - Hispanic or Latino
Place of birth - Native, outside of US (%) - American Indian and Alaska Native
Place of birth - Native, outside of US (%) - Multirace
Place of birth - Native, outside of US (%) - Other Race
Place of birth - Foreign born (%)
Place of birth - Foreign born (%) - White
Place of birth - Foreign born (%) - Black or African American
Place of birth - Foreign born (%) - Asian
Place of birth - Foreign born (%) - Hispanic or Latino
Place of birth - Foreign born (%) - American Indian and Alaska Native
Place of birth - Foreign born (%) - Multirace
Place of birth - Foreign born (%) - Other Race
Residents speaking English at home (%)
Residents speaking English at home - Born in the United States (%)
Residents speaking English at home - Native, born elsewhere (%)
Residents speaking English at home - Foreign born (%)
Residents speaking Spanish at home (%)
Residents speaking Spanish at home - Born in the United States (%)
Residents speaking Spanish at home - Native, born elsewhere (%)
Residents speaking Spanish at home - Foreign born (%)
Residents speaking other language at home (%)
Residents speaking other language at home - Born in the United States (%)
Residents speaking other language at home - Native, born elsewhere (%)
Residents speaking other language at home - Foreign born (%)
Marital status - Never married (%)
Marital status - Now married (%)
Marital status - Separated (%)
Marital status - Widowed (%)
Marital status - Divorced (%)
Ancestries Reported - Arab (%)
Ancestries Reported - Czech (%)
Ancestries Reported - Danish (%)
Ancestries Reported - Dutch (%)
Ancestries Reported - English (%)
Ancestries Reported - French (%)
Ancestries Reported - French Canadian (%)
Ancestries Reported - German (%)
Ancestries Reported - Greek (%)
Ancestries Reported - Hungarian (%)
Ancestries Reported - Irish (%)
Ancestries Reported - Italian (%)
Ancestries Reported - Lithuanian (%)
Ancestries Reported - Norwegian (%)
Ancestries Reported - Polish (%)
Ancestries Reported - Portuguese (%)
Ancestries Reported - Russian (%)
Ancestries Reported - Scotch-Irish (%)
Ancestries Reported - Scottish (%)
Ancestries Reported - Slovak (%)
Ancestries Reported - Subsaharan African (%)
Ancestries Reported - Swedish (%)
Ancestries Reported - Swiss (%)
Ancestries Reported - Ukrainian (%)
Ancestries Reported - United States (%)
Ancestries Reported - Welsh (%)
Ancestries Reported - West Indian (%)
Ancestries Reported - Other (%)
Geographical mobility - Same house 1 year ago (%)
Geographical mobility - Same house 1 year ago (%) - White
Geographical mobility - Same house 1 year ago (%) - Black or African American
Geographical mobility - Same house 1 year ago (%) - Asian
Geographical mobility - Same house 1 year ago (%) - Hispanic or Latino
Geographical mobility - Same house 1 year ago (%) - American Indian and Alaska Native
Geographical mobility - Same house 1 year ago (%) - Multirace
Geographical mobility - Same house 1 year ago (%) - Other Race
Geographical mobility - Moved within same county (%)
Geographical mobility - Moved within same county (%) - White
Geographical mobility - Moved within same county (%) - Black or African American
Geographical mobility - Moved within same county (%) - Asian
Geographical mobility - Moved within same county (%) - Hispanic or Latino
Geographical mobility - Moved within same county (%) - American Indian and Alaska Native
Geographical mobility - Moved within same county (%) - Multirace
Geographical mobility - Moved within same county (%) - Other Race
Geographical mobility - Moved from different county within same state (%)
Geographical mobility - Moved from different county within same state (%) - White
Geographical mobility - Moved from different county within same state (%) - Black or African American
Geographical mobility - Moved from different county within same state (%) - Asian
Geographical mobility - Moved from different county within same state (%) - Hispanic or Latino
Geographical mobility - Moved from different county within same state (%) - American Indian and Alaska Native
Geographical mobility - Moved from different county within same state (%) - Multirace
Geographical mobility - Moved from different county within same state (%) - Other Race
Geographical mobility - Moved from different state (%)
Geographical mobility - Moved from different state (%) - White
Geographical mobility - Moved from different state (%) - Black or African American
Geographical mobility - Moved from different state (%) - Asian
Geographical mobility - Moved from different state (%) - Hispanic or Latino
Geographical mobility - Moved from different state (%) - American Indian and Alaska Native
Geographical mobility - Moved from different state (%) - Multirace
Geographical mobility - Moved from different state (%) - Other Race
Geographical mobility - Moved from abroad (%)
Geographical mobility - Moved from abroad (%) - White
Geographical mobility - Moved from abroad (%) - Black or African American
Geographical mobility - Moved from abroad (%) - Asian
Geographical mobility - Moved from abroad (%) - Hispanic or Latino
Geographical mobility - Moved from abroad (%) - American Indian and Alaska Native
Geographical mobility - Moved from abroad (%) - Multirace
Geographical mobility - Moved from abroad (%) - Other Race
Place of birth for the foreign-born population - Ireland (%)
Place of birth for the foreign-born population - Denmark (%)
Place of birth for the foreign-born population - Norway (%)
Place of birth for the foreign-born population - Sweden (%)
Place of birth for the foreign-born population - United Kingdom (%)
Place of birth for the foreign-born population - England (%)
Place of birth for the foreign-born population - Scotland (%)
Place of birth for the foreign-born population - Other Northern Europe (%)
Place of birth for the foreign-born population - Austria (%)
Place of birth for the foreign-born population - Belgium (%)
Place of birth for the foreign-born population - France (%)
Place of birth for the foreign-born population - Germany (%)
Place of birth for the foreign-born population - Netherlands (%)
Place of birth for the foreign-born population - Switzerland (%)
Place of birth for the foreign-born population - Other Western Europe (%)
Place of birth for the foreign-born population - Greece (%)
Place of birth for the foreign-born population - Italy (%)
Place of birth for the foreign-born population - Portugal (%)
Place of birth for the foreign-born population - Spain (%)
Place of birth for the foreign-born population - Other Southern Europe (%)
Place of birth for the foreign-born population - Albania (%)
Place of birth for the foreign-born population - Belarus (%)
Place of birth for the foreign-born population - Bosnia and Herzegovina (%)
Place of birth for the foreign-born population - Bulgaria (%)
Place of birth for the foreign-born population - Croatia (%)
Place of birth for the foreign-born population - Czechoslovakia (%)
Place of birth for the foreign-born population - Hungary (%)
Place of birth for the foreign-born population - Latvia (%)
Place of birth for the foreign-born population - Lithuania (%)
Place of birth for the foreign-born population - North Macedonia (Macedonia) (%)
Place of birth for the foreign-born population - Moldova (%)
Place of birth for the foreign-born population - Poland (%)
Place of birth for the foreign-born population - Romania (%)
Place of birth for the foreign-born population - Russia (%)
Place of birth for the foreign-born population - Serbia (%)
Place of birth for the foreign-born population - Ukraine (%)
Place of birth for the foreign-born population - Other Eastern Europe (%)
Place of birth for the foreign-born population - China (%)
Place of birth for the foreign-born population - Hong Kong (%)
Place of birth for the foreign-born population - Taiwan (%)
Place of birth for the foreign-born population - Japan (%)
Place of birth for the foreign-born population - Korea (%)
Place of birth for the foreign-born population - Other Eastern Asia (%)
Place of birth for the foreign-born population - Afghanistan (%)
Place of birth for the foreign-born population - Bangladesh (%)
Place of birth for the foreign-born population - India (%)
Place of birth for the foreign-born population - Iran (%)
Place of birth for the foreign-born population - Kazakhstan (%)
Place of birth for the foreign-born population - Nepal (%)
Place of birth for the foreign-born population - Pakistan (%)
Place of birth for the foreign-born population - Sri Lanka (%)
Place of birth for the foreign-born population - Uzbekistan (%)
Place of birth for the foreign-born population - Other South Central Asia (%)
Place of birth for the foreign-born population - Burma (%)
Place of birth for the foreign-born population - Cambodia (%)
Place of birth for the foreign-born population - Indonesia (%)
Place of birth for the foreign-born population - Laos (%)
Place of birth for the foreign-born population - Malaysia (%)
Place of birth for the foreign-born population - Philippines (%)
Place of birth for the foreign-born population - Singapore (%)
Place of birth for the foreign-born population - Thailand (%)
Place of birth for the foreign-born population - Vietnam (%)
Place of birth for the foreign-born population - Other South Eastern Asia (%)
Place of birth for the foreign-born population - Armenia (%)
Place of birth for the foreign-born population - Iraq (%)
Place of birth for the foreign-born population - Israel (%)
Place of birth for the foreign-born population - Jordan (%)
Place of birth for the foreign-born population - Kuwait (%)
Place of birth for the foreign-born population - Lebanon (%)
Place of birth for the foreign-born population - Saudi Arabia (%)
Place of birth for the foreign-born population - Syria (%)
Place of birth for the foreign-born population - Turkey (%)
Place of birth for the foreign-born population - Yemen (%)
Place of birth for the foreign-born population - Other Western Asia (%)
Place of birth for the foreign-born population - Eritrea (%)
Place of birth for the foreign-born population - Ethiopia (%)
Place of birth for the foreign-born population - Kenya (%)
Place of birth for the foreign-born population - Somalia (%)
Place of birth for the foreign-born population - Uganda (%)
Place of birth for the foreign-born population - Zimbabwe (%)
Place of birth for the foreign-born population - Other Eastern Africa (%)
Place of birth for the foreign-born population - Cameroon (%)
Place of birth for the foreign-born population - Congo (%)
Place of birth for the foreign-born population - Democratic Republic of Congo (Zaire) (%)
Place of birth for the foreign-born population - Other Middle Africa (%)
Place of birth for the foreign-born population - Egypt (%)
Place of birth for the foreign-born population - Morocco (%)
Place of birth for the foreign-born population - Sudan (%)
Place of birth for the foreign-born population - Other Northern Africa (%)
Place of birth for the foreign-born population - South Africa (%)
Place of birth for the foreign-born population - Other Southern Africa (%)
Place of birth for the foreign-born population - Cabo Verde (%)
Place of birth for the foreign-born population - Ghana (%)
Place of birth for the foreign-born population - Liberia (%)
Place of birth for the foreign-born population - Nigeria (%)
Place of birth for the foreign-born population - Senegal (%)
Place of birth for the foreign-born population - Sierra Leone (%)
Place of birth for the foreign-born population - Other Western Africa (%)
Place of birth for the foreign-born population - Australia (%)
Place of birth for the foreign-born population - New Zealand (%)
Place of birth for the foreign-born population - Fiji (%)
Place of birth for the foreign-born population - Micronesia (%)
Place of birth for the foreign-born population - Bahamas (%)
Place of birth for the foreign-born population - Barbados (%)
Place of birth for the foreign-born population - Cuba (%)
Place of birth for the foreign-born population - Dominica (%)
Place of birth for the foreign-born population - Dominican Republic (%)
Place of birth for the foreign-born population - Grenada (%)
Place of birth for the foreign-born population - Haiti (%)
Place of birth for the foreign-born population - Jamaica (%)
Place of birth for the foreign-born population - St. Vincent and the Grenadines (%)
Place of birth for the foreign-born population - Trinidad and Tobago (%)
Place of birth for the foreign-born population - West Indies (%)
Place of birth for the foreign-born population - Other Caribbean (%)
Place of birth for the foreign-born population - Belize (%)
Place of birth for the foreign-born population - Costa Rica (%)
Place of birth for the foreign-born population - El Salvador (%)
Place of birth for the foreign-born population - Guatemala (%)
Place of birth for the foreign-born population - Honduras (%)
Place of birth for the foreign-born population - Mexico (%)
Place of birth for the foreign-born population - Nicaragua (%)
Place of birth for the foreign-born population - Panama (%)
Place of birth for the foreign-born population - Other Central America (%)
Place of birth for the foreign-born population - Argentina (%)
Place of birth for the foreign-born population - Bolivia (%)
Place of birth for the foreign-born population - Brazil (%)
Place of birth for the foreign-born population - Chile (%)
Place of birth for the foreign-born population - Colombia (%)
Place of birth for the foreign-born population - Ecuador (%)
Place of birth for the foreign-born population - Guyana (%)
Place of birth for the foreign-born population - Peru (%)
Place of birth for the foreign-born population - Uruguay (%)
Place of birth for the foreign-born population - Venezuela (%)
Place of birth for the foreign-born population - Other South America (%)
Place of birth for the foreign-born population - Canada (%)
Place of birth for the foreign-born population - Other Northern America (%)
Place of birth for the foreign-born population - Other (%)
Latest news about races in Rockville, MD collected exclusively by city-data.com from local newspapers, TV, and radio stations
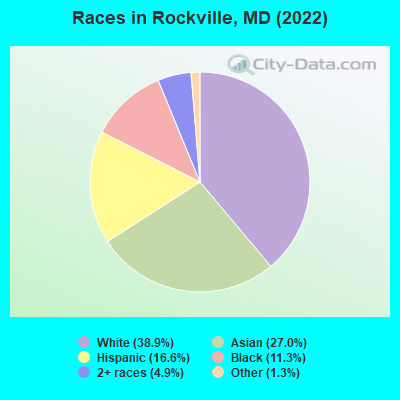
According to 2022 data, the most numerous races in Rockville, MD are White alone (26,021 residents), Black alone (7,548 residents), and Hispanic (11,130 residents). 55.5% of Rockville residents speak English at home. 36.3% of Rockville, MD residents are foreign-born (19.4% born in Asia, 9.2% born in Latin America, 4.1% born in Europe), which is 55.9% greater than the foreign-born rate of 16.0% across the entire state of Maryland.
Race distribution in Rockville
2000 2022
29,342 61.9% White alone 7,002 14.8% Asian alone 5,529 11.7% Hispanic 4,200 8.9% Black alone 1,031 2.2% Two or more races 140 0.3% Other race alone 133 0.3% American Indian alone 11 0.02% Native Hawaiian and Other
26,021 38.9% White alone 18,054 27.0% Asian alone 11,130 16.6% Hispanic 7,548 11.3% Black alone 3,267 4.9% Two or more races 895 1.3% Other race alone
2000 2022
3,286,547 62.1% White alone 1,464,735 27.7% Black alone 227,916 4.3% Hispanic 209,738 4.0% Asian alone 82,946 1.6% Two or more races 13,312 0.3% American Indian alone 9,379 0.2% Other race alone 1,913 0.04% Native Hawaiian and Other
2,906,492 47.1% White alone 1,800,914 29.2% Black alone 705,842 11.4% Hispanic 401,818 6.5% Asian alone 291,317 4.7% Two or more races 46,930 0.8% Other race alone 8,930 0.1% American Indian alone 2,417 0.04% Native Hawaiian and Other
Income and house value in Rockville Median household income in 2022 $121,635 White non-Hispanic householders$43,908 Black householders$107,040 Asian householders$84,047 Some other race householders$129,836 Two or more races householders$84,360 Hispanic or Latino race householdersMedian 2022 house value $721,837 White Non-Hispanic householders$502,640 Black or African American householders$751,727 American Indian or Alaska Native householders $776,464 Asian householders$386,514 Native Hawaiian and other Pacific Islander householders$494,051 Some other race householders$515,352 Two or more races householders$541,120 Hispanic or Latino householders
Median age by race in Rockville
47.5 Median age for White residents47.9 46.5 34.3 Median age for Black or African American residents31.5 39.2 -666,666,666.0 Median age for American Indian / Alaska Native residents-666,666,666.0 -666,666,666.0 34.3 Median age for Asian residents31.5 38.1 -666,666,666.0 Median age for Native Hawaiian / Pacific Islander residents-666,666,666.0 -666,666,666.0 25.9 Median age for Other race residents29.8 23.4 32.0 Median age for Two or more races residents31.6 35.9 48.4 Median age for White alone residents48.3 48.5 30.5 Median age for Hispanic or Latino residents31.8 30.0
Owner/renter occupied households by race in Rockville
House owners and renters - White residents 7,886 61.0% Owner occupied5,050 39.0% Renter occupiedHouse owners and renters - Black or African American residents 734 20.4% Owner occupied2,868 79.6% Renter occupiedHouse owners and renters - American Indian / Alaska Native residents 23 55.4% Owner occupied18 44.6% Renter occupiedHouse owners and renters - Asian residents 3,043 50.9% Owner occupied2,931 49.1% Renter occupiedHouse owners and renters - Other race residents 350 20.5% Owner occupied1,357 79.5% Renter occupiedHouse owners and renters - Two or more races residents 1,610 68.8% Owner occupied730 31.2% Renter occupiedHouse owners and renters - White alone residents 7,684 61.2% Owner occupied4,879 38.8% Renter occupiedHouse owners and renters - Hispanic or Latino residents 1,450 44.7% Owner occupied1,791 55.3% Renter occupied
Language usage in Rockville
English speakers - Total 55.5% of residents of Rockville speak English at home.
14.3% of residents speak Spanish at home 3,942 44.2% Speak English very well4,976 55.8% Speak English less than very well30.2% of residents speak other language at home 12,626 67.3% Speak English very well6,132 32.7% Speak English less than very well
English speakers - Born in the United States 87.1% of residents of Rockville speak English at home.
4.8% of residents speak Spanish at home 1,118 100.0% Speak English very well8.1% of residents speak other language at home 1,760 92.3% Speak English very well146 7.7% Speak English less than very well
English speakers - Native, born elsewhere 48.4% of residents of Rockville speak English at home.
34.2% of residents speak Spanish at home 405 100.0% Speak English very well17.5% of residents speak other language at home 207 100.0% Speak English very well
English speakers - Foreign-born 15.7% of residents of Rockville speak English at home.
23.4% of residents speak Spanish at home 1,412 23.9% Speak English very well4,503 76.1% Speak English less than very well60.9% of residents speak other language at home 9,711 63.1% Speak English very well5,669 36.9% Speak English less than very well
White (Caucasian) - Speak only English Native:
92.0% (19,875)Foreign-born:
13.2% (571)
White (Caucasian) - Speak another language Native:
8.0% (1,722)Foreign-born:
86.8% (3,769)
Black or African American - Speak only English Native:
95.6% (5,691)Foreign-born:
50.7% (708)
Black or African American - Speak another language Native:
4.4% (262)Foreign-born:
49.3% (689)
American Indian / Alaska Native - Speak only English Native:
41.2% (31)Foreign-born:
19.7% (28)
American Indian / Alaska Native - Speak another language Native:
52.5% (40)Foreign-born:
82.6% (117)
Asian - Speak only English Native:
49.2% (2,039)Foreign-born:
16.4% (2,060)
Asian - Speak another language Native:
50.8% (2,108)Foreign-born:
83.6% (10,471)
Other race - Speak only English Native:
32.6% (510)Foreign-born:
7.6% (296)
Other race - Speak another language Native:
67.4% (1,056)Foreign-born:
92.4% (3,615)
Two or more races - Speak only English Native:
67.1% (2,433)Foreign-born:
11.0% (339)
Two or more races - Speak another language Native:
32.9% (1,194)Foreign-born:
89.0% (2,751)
White alone - Speak only English Native:
93.8% (19,423)Foreign-born:
13.4% (571)
White alone - Speak another language Native:
6.2% (1,285)Foreign-born:
86.6% (3,690)
Hispanic or Latino - Speak only English Native:
30.2% (1,140)Foreign-born:
4.8% (295)
Hispanic or Latino - Speak another language Native:
69.8% (2,634)Foreign-born:
95.2% (5,870)
Foreign-born residents in Rockville 24,248 residents are foreign born (19.4% Asia , 9.2% Latin America , 4.1% Europe ).
This city:
36.3%Maryland:
15.7%
Marital status for residents in Rockville Marital status - White (Caucasian) population 15 years and over
Males 20.6% Never married64.3% Now married2.3% Separated5.2% Widowed7.7% DivorcedFemales 29.9% Never married49.0% Now married0.4% Separated8.6% Widowed12.2% DivorcedWomen who gave birth in the past 12 months Now married:
93.5% (315)Unmarried:
6.5% (22)
Women who did not give birth in the past 12 months Now married:
31.3% (1,743)Unmarried:
68.7% (3,818)
Marital status - Black or African American population 15 years and over
Males 52.0% Never married36.1% Now married0.8% Separated0.8% Widowed10.3% DivorcedFemales 60.8% Never married12.2% Now married4.4% Separated9.0% Widowed13.5% DivorcedWomen who gave birth in the past 12 months Now married:
31.6% (55)Unmarried:
68.4% (119)
Women who did not give birth in the past 12 months Now married:
19.6% (409)Unmarried:
80.4% (1,678)
Marital status - American Indian / Alaska Native population 15 years and over
Males 19.1% Never married80.9% Now married0.0% Separated0.0% Widowed0.0% DivorcedFemales 11.6% Never married32.6% Now married0.0% Separated0.0% Widowed55.8% DivorcedWomen who did not give birth in the past 12 months Now married:
42.4% (42)Unmarried:
57.6% (57)
Marital status - Asian population 15 years and over
Males 41.7% Never married54.8% Now married0.0% Separated0.0% Widowed3.5% DivorcedFemales 21.5% Never married66.7% Now married4.2% Separated0.0% Widowed7.5% DivorcedWomen who gave birth in the past 12 months Now married:
100.0% (468)Unmarried:
0.0% (0)
Women who did not give birth in the past 12 months Now married:
66.5% (2,559)Unmarried:
33.5% (1,288)
Marital status - Other race population 15 years and over
Males 50.6% Never married44.8% Now married2.8% Separated1.1% Widowed0.7% DivorcedFemales 47.4% Never married38.7% Now married1.8% Separated1.3% Widowed10.8% DivorcedWomen who gave birth in the past 12 months Now married:
4.5% (4)Unmarried:
95.5% (78)
Women who did not give birth in the past 12 months Now married:
37.9% (770)Unmarried:
62.1% (1,263)
Marital status - Two or more races population 15 years and over
Males 37.1% Never married52.3% Now married0.0% Separated0.0% Widowed10.6% DivorcedFemales 43.6% Never married32.2% Now married5.4% Separated2.9% Widowed15.9% DivorcedWomen who gave birth in the past 12 months Now married:
100.0% (13)Unmarried:
0.0% (0)
Women who did not give birth in the past 12 months Now married:
42.7% (647)Unmarried:
57.3% (868)
Marital status - White alone, not Hispanic / Latino population 15 years and over
Males 18.9% Never married65.3% Now married2.4% Separated5.4% Widowed8.0% DivorcedFemales 29.6% Never married48.9% Now married0.4% Separated8.9% Widowed12.2% DivorcedWomen who gave birth in the past 12 months Now married:
100.0% (315)Unmarried:
0.0% (0)
Women who did not give birth in the past 12 months Now married:
30.7% (1,614)Unmarried:
69.3% (3,650)
Marital status - Hispanic or Latino population 15 years and over
Males 55.6% Never married39.3% Now married0.0% Separated0.0% Widowed5.1% DivorcedFemales 40.0% Never married39.4% Now married4.4% Separated2.4% Widowed13.8% DivorcedWomen who gave birth in the past 12 months Now married:
21.9% (21)Unmarried:
78.1% (75)
Women who did not give birth in the past 12 months Now married:
43.7% (1,301)Unmarried:
56.3% (1,673)
Ancestries in Rockville
1,709 4.1% German1,328 3.2% English1,197 2.8% Iranian1,077 2.6% Russian1,041 2.5% Irish994 2.4% American840 2.0% European787 1.9% Eastern European746 1.8% Polish724 1.7% Ethiopian708 1.7% Italian412 1.0% Turkish350 0.8% Portuguese347 0.8% Brazilian313 0.7% Syrian312 0.7% Ukrainian286 0.7% Slovak267 0.6% Greek242 0.6% Romanian237 0.6% Nigerian203 0.5% Haitian191 0.5% Egyptian166 0.4% Scottish165 0.4% Armenian154 0.4% Israeli145 0.3% Northern European133 0.3% African129 0.3% Trinidadian and Tobagonian126 0.3% British110 0.3% Jamaican93 0.2% Hungarian92 0.2% Lebanese84 0.2% French79 0.2% Slavic78 0.2% Swedish77 0.2% Ghanaian73 0.2% Scotch-Irish63 0.1% Bulgarian60 0.1% Guyanese59 0.1% Lithuanian58 0.1% West Indian48 0.1% Serbian45 0.1% Czech45 0.1% Ugandan42 0.10% French Canadian40 0.10% Iraqi33 0.08% Yugoslavian32 0.08% Arab28 0.07% Scandinavian26 0.06% Liberian25 0.06% British West Indian24 0.06% Dutch24 0.06% Cypriot23 0.05% Welsh21 0.05% Latvian20 0.05% Czechoslovakian20 0.05% Albanian19 0.05% Moroccan18 0.04% Afghan16 0.04% Swiss14 0.03% Norwegian14 0.03% Canadian14 0.03% Assyrian12 0.03% Jordanian11 0.03% Cape Verdean6 0.01% Croatian3 0.01% Barbadian
Geographical mobility in Rockville Same house 1 year ago 23,328 87.5% White (Caucasian)6,895 91.0% Black or African American265 98.9% American Indian / Alaska Native11,015 62.7% Asian6,637 90.1% Other race5,335 78.0% Two or more races22,528 87.7% White alone, not Hispanic / Latino8,780 81.1% Hispanic or LatinoMoved within same county 1,350 5.1% White / Caucasian311 4.1% Black or African American2,520 14.3% Asian473 6.4% Other race420 6.1% Two or more races1,332 5.2% White alone, not Hispanic / Latino749 6.9% Hispanic or LatinoMoved within same state 372 1.4% White / Caucasian239 3.2% Black or African American216 1.2% Asian48 0.7% Other race370 5.4% Two or more races372 1.4% White alone, not Hispanic / Latino162 1.5% Hispanic or LatinoMoved from different state 1,473 5.5% White / Caucasian133 1.8% Black or African American968 5.5% Asian85 1.2% Other race282 4.1% Two or more races1,323 5.1% White alone, not Hispanic / Latino297 2.7% Hispanic or LatinoMoved from abroad 144 0.5% White2,855 16.2% Asian119 1.6% Other race105 1.5% Two or more races144 0.6% White alone, not Hispanic / Latino839 7.7% Hispanic or Latino
Children Nativity (place of birth) in Rockville
Children under 6 years - Living with two parents Both parents native 1,427 100.0% NativeBoth parents foreign-born 997 68.3% Native463 31.7% Foreign-bornOne native, one foreign-born parent 739 100.0% NativeChildren under 6 years - Living with one parent Native parent 280 100.0% NativeForeign-born parent 1,187 85.3% Native204 14.7% Foreign-bornChildren 6 to 17 years - Living with two parents Both parents native 3,090 100.0% NativeBoth parents foreign-born 1,551 74.0% Native546 26.0% Foreign-bornOne native, one foreign-born parent 857 100.0% NativeChildren 6 to 17 years - Living with one parent Native parent 1,519 100.0% NativeForeign-born parent 886 50.0% Native886 50.0% Foreign-born
Place of birth for residents in Rockville 13,516 Asia6,595 Americas6,450 Latin America5,893 Eastern Asia4,389 China4,172 South Central Asia2,841 Central America2,827 Europe2,808 South America2,212 South Eastern Asia1,690 Eastern Europe1,255 Africa1,230 Western Asia799 Caribbean487 Western Europe430 Western Africa420 Southern Europe327 Eastern Africa265 Northern Africa228 Northern Europe145 Northern America114 Southern Africa81 Middle Africa52 Oceania3,424 China2,326 India1,878 El Salvador1,306 Korea1,067 Iran741 Taiwan705 Philippines703 Russia696 Peru659 Brazil524 Vietnam523 Indonesia448 Israel438 Honduras413 Dominican Republic307 Pakistan303 Ukraine284 Colombia275 Azerbaijan252 Bolivia235 Venezuela223 Hong Kong218 France217 Ethiopia216 Germany215 Argentina211 Mexico205 Egypt197 Japan197 Chile194 Greece162 Syria151 Turkey149 Nepal148 Trinidad and Tobago148 United Kingdom145 Thailand139 Canada137 Guatemala124 Ghana123 Guyana115 Jamaica113 Afghanistan111 Burma (Myanmar)109 Bangladesh103 South Africa95 Serbia93 Singapore84 Italy82 Lebanon78 Malaysia76 Togo75 Spain71 Cuba69 Romania69 Uzbekistan67 Nicaragua67 Czechoslovakia66 Cameroon66 Portugal63 Uganda59 Bosnia and Herzegovina58 Belarus56 Panama56 Poland56 England52 Ivory Coast51 Costa Rica49 Morocco47 Bulgaria43 Nigeria41 Georgia38 Saudi Arabia36 Liberia33 Eritrea33 Hungary32 Haiti31 Lithuania30 Latvia29 Sri Lanka25 Netherlands25 Ecuador18 Switzerland17 Cambodia14 St. Lucia14 Moldova12 Ireland12 Sierra Leone12 Laos11 Sweden10 Iraq8 Belgium8 Sudan7 Croatia2 Algeria
Grandparents responsible for own grandchildren in Rockville
Grandparents (30 to 59 years) White / Caucasian 50 100.0% Not responsible for grandchildrenBlack or African American 21 100.0% Not responsible for grandchildrenAsian 52 100.0% Not responsible for grandchildrenOther race 49 100.0% Not responsible for grandchildrenTwo or more races 11 100.0% Not responsible for grandchildrenWhite alone, not Hispanic / Latino 15 100.0% Not responsible for grandchildrenHispanic or Latino 85 100.0% Not responsible for grandchildrenGrandparents (60 years and over) White / Caucasian 175 100.0% Not responsible for grandchildrenBlack or African American 66 100.0% Not responsible for grandchildrenAsian 21 8.1% Responsible for grandchildren238 91.9% Not responsible for grandchildrenOther race 47 100.0% Not responsible for grandchildrenTwo or more races 59 23.6% Responsible for grandchildren193 76.4% Not responsible for grandchildrenWhite alone, not Hispanic / Latino 178 100.0% Not responsible for grandchildrenHispanic or Latino 139 100.0% Not responsible for grandchildren