Races in Rockford, Illinois (IL) Detailed Stats
Data:
Races - White alone (%)
Races - White alone (% change since 2000)
Races - Black alone (%)
Races - Black alone (% change since 2000)
Races - American Indian alone (%)
Races - American Indian alone (% change since 2000)
Races - Asian alone (%)
Races - Asian alone (% change since 2000)
Races - Hispanic (%)
Races - Hispanic (% change since 2000)
Races - Native Hawaiian and Other Pacific Islander alone (%)
Races - Native Hawaiian and Other Pacific Islander alone (% change since 2000)
Races - Two or more races(%)
Races - Two or more races(% change since 2000)
Races - Other race alone (%)
Races - Other race alone (% change since 2000)
Racial diversity
Place of birth - Born in state of residence (%)
Place of birth - Born in state of residence (%) - White
Place of birth - Born in state of residence (%) - Black or African American
Place of birth - Born in state of residence (%) - Asian
Place of birth - Born in state of residence (%) - Hispanic or Latino
Place of birth - Born in state of residence (%) - American Indian and Alaska Native
Place of birth - Born in state of residence (%) - Multirace
Place of birth - Born in state of residence (%) - Other Race
Place of birth - Born in other state (%)
Place of birth - Born in other state (%) - White
Place of birth - Born in other state (%) - Black or African American
Place of birth - Born in other state (%) - Asian
Place of birth - Born in other state (%) - Hispanic or Latino
Place of birth - Born in other state (%) - American Indian and Alaska Native
Place of birth - Born in other state (%) - Multirace
Place of birth - Born in other state (%) - Other Race
Place of birth - Native, outside of US (%)
Place of birth - Native, outside of US (%) - White
Place of birth - Native, outside of US (%) - Black or African American
Place of birth - Native, outside of US (%) - Asian
Place of birth - Native, outside of US (%) - Hispanic or Latino
Place of birth - Native, outside of US (%) - American Indian and Alaska Native
Place of birth - Native, outside of US (%) - Multirace
Place of birth - Native, outside of US (%) - Other Race
Place of birth - Foreign born (%)
Place of birth - Foreign born (%) - White
Place of birth - Foreign born (%) - Black or African American
Place of birth - Foreign born (%) - Asian
Place of birth - Foreign born (%) - Hispanic or Latino
Place of birth - Foreign born (%) - American Indian and Alaska Native
Place of birth - Foreign born (%) - Multirace
Place of birth - Foreign born (%) - Other Race
Residents speaking English at home (%)
Residents speaking English at home - Born in the United States (%)
Residents speaking English at home - Native, born elsewhere (%)
Residents speaking English at home - Foreign born (%)
Residents speaking Spanish at home (%)
Residents speaking Spanish at home - Born in the United States (%)
Residents speaking Spanish at home - Native, born elsewhere (%)
Residents speaking Spanish at home - Foreign born (%)
Residents speaking other language at home (%)
Residents speaking other language at home - Born in the United States (%)
Residents speaking other language at home - Native, born elsewhere (%)
Residents speaking other language at home - Foreign born (%)
Marital status - Never married (%)
Marital status - Now married (%)
Marital status - Separated (%)
Marital status - Widowed (%)
Marital status - Divorced (%)
Ancestries Reported - Arab (%)
Ancestries Reported - Czech (%)
Ancestries Reported - Danish (%)
Ancestries Reported - Dutch (%)
Ancestries Reported - English (%)
Ancestries Reported - French (%)
Ancestries Reported - French Canadian (%)
Ancestries Reported - German (%)
Ancestries Reported - Greek (%)
Ancestries Reported - Hungarian (%)
Ancestries Reported - Irish (%)
Ancestries Reported - Italian (%)
Ancestries Reported - Lithuanian (%)
Ancestries Reported - Norwegian (%)
Ancestries Reported - Polish (%)
Ancestries Reported - Portuguese (%)
Ancestries Reported - Russian (%)
Ancestries Reported - Scotch-Irish (%)
Ancestries Reported - Scottish (%)
Ancestries Reported - Slovak (%)
Ancestries Reported - Subsaharan African (%)
Ancestries Reported - Swedish (%)
Ancestries Reported - Swiss (%)
Ancestries Reported - Ukrainian (%)
Ancestries Reported - United States (%)
Ancestries Reported - Welsh (%)
Ancestries Reported - West Indian (%)
Ancestries Reported - Other (%)
Geographical mobility - Same house 1 year ago (%)
Geographical mobility - Same house 1 year ago (%) - White
Geographical mobility - Same house 1 year ago (%) - Black or African American
Geographical mobility - Same house 1 year ago (%) - Asian
Geographical mobility - Same house 1 year ago (%) - Hispanic or Latino
Geographical mobility - Same house 1 year ago (%) - American Indian and Alaska Native
Geographical mobility - Same house 1 year ago (%) - Multirace
Geographical mobility - Same house 1 year ago (%) - Other Race
Geographical mobility - Moved within same county (%)
Geographical mobility - Moved within same county (%) - White
Geographical mobility - Moved within same county (%) - Black or African American
Geographical mobility - Moved within same county (%) - Asian
Geographical mobility - Moved within same county (%) - Hispanic or Latino
Geographical mobility - Moved within same county (%) - American Indian and Alaska Native
Geographical mobility - Moved within same county (%) - Multirace
Geographical mobility - Moved within same county (%) - Other Race
Geographical mobility - Moved from different county within same state (%)
Geographical mobility - Moved from different county within same state (%) - White
Geographical mobility - Moved from different county within same state (%) - Black or African American
Geographical mobility - Moved from different county within same state (%) - Asian
Geographical mobility - Moved from different county within same state (%) - Hispanic or Latino
Geographical mobility - Moved from different county within same state (%) - American Indian and Alaska Native
Geographical mobility - Moved from different county within same state (%) - Multirace
Geographical mobility - Moved from different county within same state (%) - Other Race
Geographical mobility - Moved from different state (%)
Geographical mobility - Moved from different state (%) - White
Geographical mobility - Moved from different state (%) - Black or African American
Geographical mobility - Moved from different state (%) - Asian
Geographical mobility - Moved from different state (%) - Hispanic or Latino
Geographical mobility - Moved from different state (%) - American Indian and Alaska Native
Geographical mobility - Moved from different state (%) - Multirace
Geographical mobility - Moved from different state (%) - Other Race
Geographical mobility - Moved from abroad (%)
Geographical mobility - Moved from abroad (%) - White
Geographical mobility - Moved from abroad (%) - Black or African American
Geographical mobility - Moved from abroad (%) - Asian
Geographical mobility - Moved from abroad (%) - Hispanic or Latino
Geographical mobility - Moved from abroad (%) - American Indian and Alaska Native
Geographical mobility - Moved from abroad (%) - Multirace
Geographical mobility - Moved from abroad (%) - Other Race
Place of birth for the foreign-born population - Ireland (%)
Place of birth for the foreign-born population - Denmark (%)
Place of birth for the foreign-born population - Norway (%)
Place of birth for the foreign-born population - Sweden (%)
Place of birth for the foreign-born population - United Kingdom (%)
Place of birth for the foreign-born population - England (%)
Place of birth for the foreign-born population - Scotland (%)
Place of birth for the foreign-born population - Other Northern Europe (%)
Place of birth for the foreign-born population - Austria (%)
Place of birth for the foreign-born population - Belgium (%)
Place of birth for the foreign-born population - France (%)
Place of birth for the foreign-born population - Germany (%)
Place of birth for the foreign-born population - Netherlands (%)
Place of birth for the foreign-born population - Switzerland (%)
Place of birth for the foreign-born population - Other Western Europe (%)
Place of birth for the foreign-born population - Greece (%)
Place of birth for the foreign-born population - Italy (%)
Place of birth for the foreign-born population - Portugal (%)
Place of birth for the foreign-born population - Spain (%)
Place of birth for the foreign-born population - Other Southern Europe (%)
Place of birth for the foreign-born population - Albania (%)
Place of birth for the foreign-born population - Belarus (%)
Place of birth for the foreign-born population - Bosnia and Herzegovina (%)
Place of birth for the foreign-born population - Bulgaria (%)
Place of birth for the foreign-born population - Croatia (%)
Place of birth for the foreign-born population - Czechoslovakia (%)
Place of birth for the foreign-born population - Hungary (%)
Place of birth for the foreign-born population - Latvia (%)
Place of birth for the foreign-born population - Lithuania (%)
Place of birth for the foreign-born population - North Macedonia (Macedonia) (%)
Place of birth for the foreign-born population - Moldova (%)
Place of birth for the foreign-born population - Poland (%)
Place of birth for the foreign-born population - Romania (%)
Place of birth for the foreign-born population - Russia (%)
Place of birth for the foreign-born population - Serbia (%)
Place of birth for the foreign-born population - Ukraine (%)
Place of birth for the foreign-born population - Other Eastern Europe (%)
Place of birth for the foreign-born population - China (%)
Place of birth for the foreign-born population - Hong Kong (%)
Place of birth for the foreign-born population - Taiwan (%)
Place of birth for the foreign-born population - Japan (%)
Place of birth for the foreign-born population - Korea (%)
Place of birth for the foreign-born population - Other Eastern Asia (%)
Place of birth for the foreign-born population - Afghanistan (%)
Place of birth for the foreign-born population - Bangladesh (%)
Place of birth for the foreign-born population - India (%)
Place of birth for the foreign-born population - Iran (%)
Place of birth for the foreign-born population - Kazakhstan (%)
Place of birth for the foreign-born population - Nepal (%)
Place of birth for the foreign-born population - Pakistan (%)
Place of birth for the foreign-born population - Sri Lanka (%)
Place of birth for the foreign-born population - Uzbekistan (%)
Place of birth for the foreign-born population - Other South Central Asia (%)
Place of birth for the foreign-born population - Burma (%)
Place of birth for the foreign-born population - Cambodia (%)
Place of birth for the foreign-born population - Indonesia (%)
Place of birth for the foreign-born population - Laos (%)
Place of birth for the foreign-born population - Malaysia (%)
Place of birth for the foreign-born population - Philippines (%)
Place of birth for the foreign-born population - Singapore (%)
Place of birth for the foreign-born population - Thailand (%)
Place of birth for the foreign-born population - Vietnam (%)
Place of birth for the foreign-born population - Other South Eastern Asia (%)
Place of birth for the foreign-born population - Armenia (%)
Place of birth for the foreign-born population - Iraq (%)
Place of birth for the foreign-born population - Israel (%)
Place of birth for the foreign-born population - Jordan (%)
Place of birth for the foreign-born population - Kuwait (%)
Place of birth for the foreign-born population - Lebanon (%)
Place of birth for the foreign-born population - Saudi Arabia (%)
Place of birth for the foreign-born population - Syria (%)
Place of birth for the foreign-born population - Turkey (%)
Place of birth for the foreign-born population - Yemen (%)
Place of birth for the foreign-born population - Other Western Asia (%)
Place of birth for the foreign-born population - Eritrea (%)
Place of birth for the foreign-born population - Ethiopia (%)
Place of birth for the foreign-born population - Kenya (%)
Place of birth for the foreign-born population - Somalia (%)
Place of birth for the foreign-born population - Uganda (%)
Place of birth for the foreign-born population - Zimbabwe (%)
Place of birth for the foreign-born population - Other Eastern Africa (%)
Place of birth for the foreign-born population - Cameroon (%)
Place of birth for the foreign-born population - Congo (%)
Place of birth for the foreign-born population - Democratic Republic of Congo (Zaire) (%)
Place of birth for the foreign-born population - Other Middle Africa (%)
Place of birth for the foreign-born population - Egypt (%)
Place of birth for the foreign-born population - Morocco (%)
Place of birth for the foreign-born population - Sudan (%)
Place of birth for the foreign-born population - Other Northern Africa (%)
Place of birth for the foreign-born population - South Africa (%)
Place of birth for the foreign-born population - Other Southern Africa (%)
Place of birth for the foreign-born population - Cabo Verde (%)
Place of birth for the foreign-born population - Ghana (%)
Place of birth for the foreign-born population - Liberia (%)
Place of birth for the foreign-born population - Nigeria (%)
Place of birth for the foreign-born population - Senegal (%)
Place of birth for the foreign-born population - Sierra Leone (%)
Place of birth for the foreign-born population - Other Western Africa (%)
Place of birth for the foreign-born population - Australia (%)
Place of birth for the foreign-born population - New Zealand (%)
Place of birth for the foreign-born population - Fiji (%)
Place of birth for the foreign-born population - Micronesia (%)
Place of birth for the foreign-born population - Bahamas (%)
Place of birth for the foreign-born population - Barbados (%)
Place of birth for the foreign-born population - Cuba (%)
Place of birth for the foreign-born population - Dominica (%)
Place of birth for the foreign-born population - Dominican Republic (%)
Place of birth for the foreign-born population - Grenada (%)
Place of birth for the foreign-born population - Haiti (%)
Place of birth for the foreign-born population - Jamaica (%)
Place of birth for the foreign-born population - St. Vincent and the Grenadines (%)
Place of birth for the foreign-born population - Trinidad and Tobago (%)
Place of birth for the foreign-born population - West Indies (%)
Place of birth for the foreign-born population - Other Caribbean (%)
Place of birth for the foreign-born population - Belize (%)
Place of birth for the foreign-born population - Costa Rica (%)
Place of birth for the foreign-born population - El Salvador (%)
Place of birth for the foreign-born population - Guatemala (%)
Place of birth for the foreign-born population - Honduras (%)
Place of birth for the foreign-born population - Mexico (%)
Place of birth for the foreign-born population - Nicaragua (%)
Place of birth for the foreign-born population - Panama (%)
Place of birth for the foreign-born population - Other Central America (%)
Place of birth for the foreign-born population - Argentina (%)
Place of birth for the foreign-born population - Bolivia (%)
Place of birth for the foreign-born population - Brazil (%)
Place of birth for the foreign-born population - Chile (%)
Place of birth for the foreign-born population - Colombia (%)
Place of birth for the foreign-born population - Ecuador (%)
Place of birth for the foreign-born population - Guyana (%)
Place of birth for the foreign-born population - Peru (%)
Place of birth for the foreign-born population - Uruguay (%)
Place of birth for the foreign-born population - Venezuela (%)
Place of birth for the foreign-born population - Other South America (%)
Place of birth for the foreign-born population - Canada (%)
Place of birth for the foreign-born population - Other Northern America (%)
Place of birth for the foreign-born population - Other (%)
Latest news about races in Rockford, IL collected exclusively by city-data.com from local newspapers, TV, and radio stations
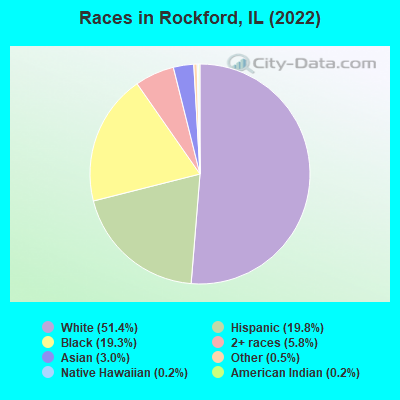
According to 2022 data, the most numerous races in Rockford, IL are White alone (74,916 residents), Hispanic (28,847 residents), and Black alone (28,085 residents). 80.4% of Rockford residents speak English at home. 12.1% of Rockford, IL residents are foreign-born (6.2% born in Latin America, 3.2% born in Asia, 1.2% born in Africa), which is 15.9% less than the foreign-born rate of 14.0% across the entire state of Illinois.
Race distribution in Rockford
2000 2022
102,678 68.4% White alone 25,822 17.2% Black alone 15,278 10.2% Hispanic 3,256 2.2% Asian alone 2,550 1.7% Two or more races 315 0.2% American Indian alone 171 0.1% Other race alone 45 0.03% Native Hawaiian and Other
74,916 51.4% White alone 28,847 19.8% Hispanic 28,085 19.3% Black alone 8,398 5.8% Two or more races 4,317 3.0% Asian alone 762 0.5% Other race alone 242 0.2% American Indian alone 268 0.2% Native Hawaiian and Other
2000 2022
8,424,140 67.8% White alone 1,856,152 14.9% Black alone 1,530,262 12.3% Hispanic 419,916 3.4% Asian alone 153,996 1.2% Two or more races 13,479 0.1% Other race alone 18,232 0.1% American Indian alone 3,116 0.03% Native Hawaiian and Other
7,356,301 58.5% White alone 2,299,726 18.3% Hispanic 1,660,423 13.2% Black alone 747,296 5.9% Asian alone 458,599 3.6% Two or more races 45,386 0.4% Other race alone 10,405 0.08% American Indian alone 3,896 0.03% Native Hawaiian and Other
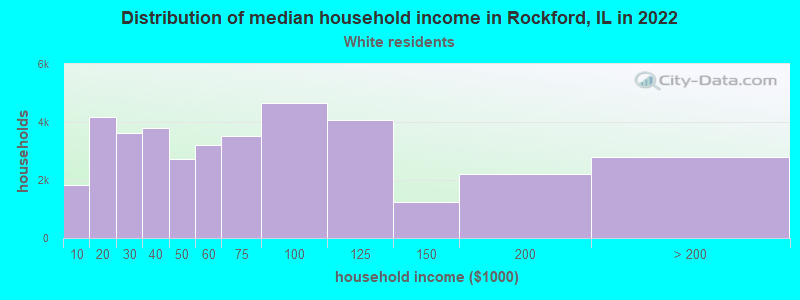
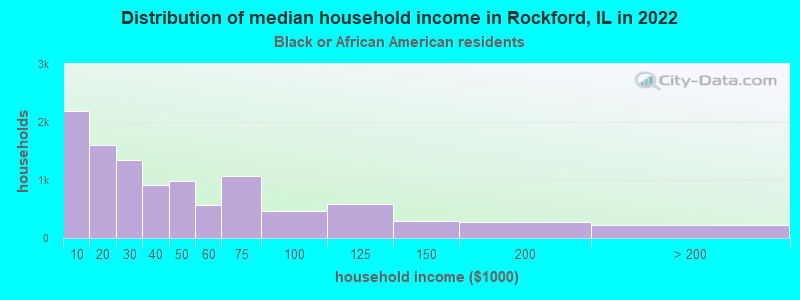
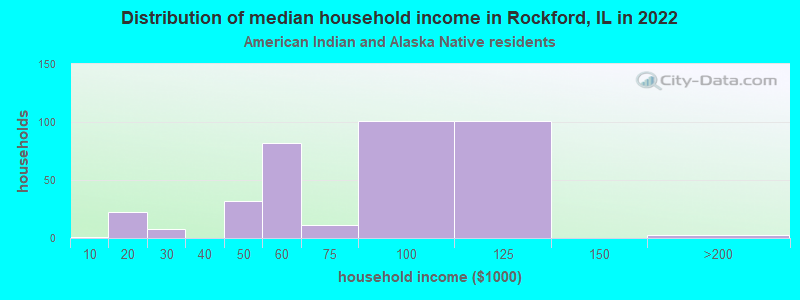
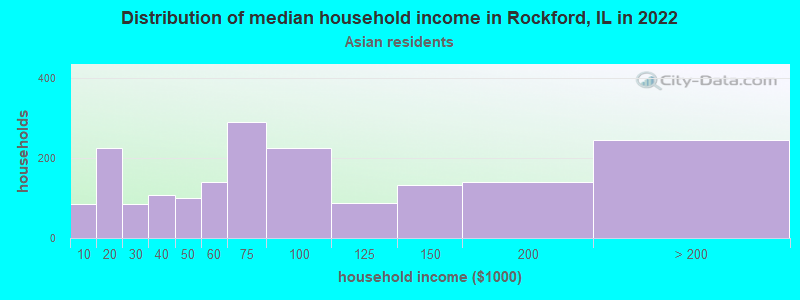
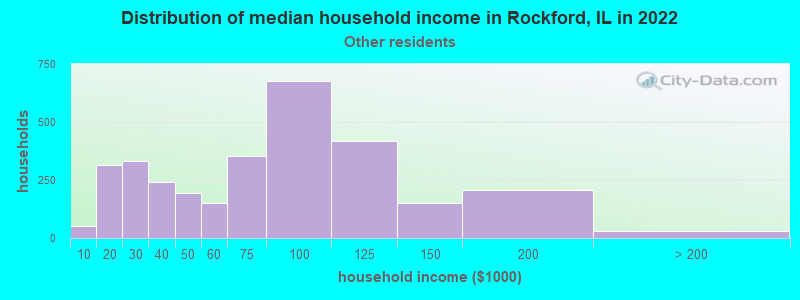
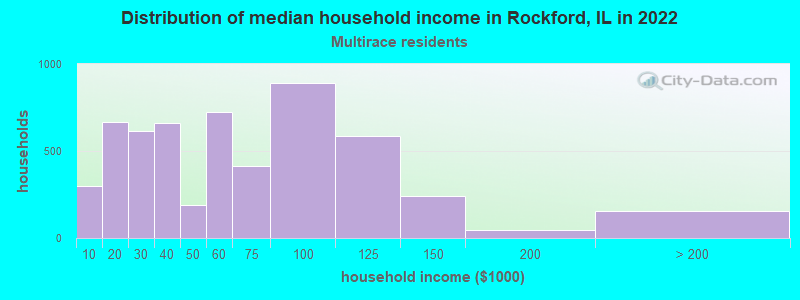
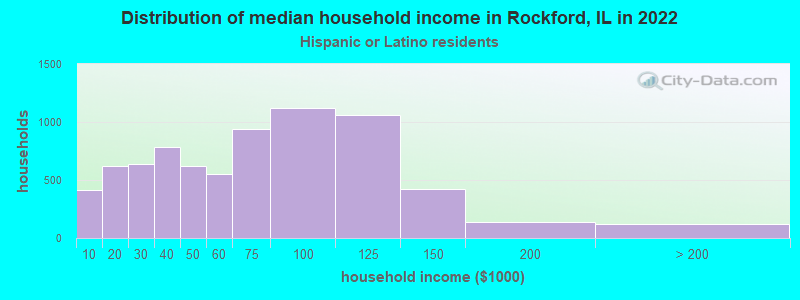
Income and house value in Rockford Median household income in 2022 $58,211 White non-Hispanic householders$31,744 Black householders$71,282 American Indian and Alaska Native householders$81,602 Asian householders$74,575 Some other race householders$53,440 Two or more races householders$65,596 Hispanic or Latino race householdersMedian 2022 house value $138,360 White Non-Hispanic householders$94,306 Black or African American householders$119,767 American Indian or Alaska Native householders $175,546 Asian householders$57,454 Native Hawaiian and other Pacific Islander householders$102,681 Some other race householders$123,452 Two or more races householders$106,869 Hispanic or Latino householders
Median age by race in Rockford
49.9 Median age for White residents45.7 51.5 30.5 Median age for Black or African American residents26.4 32.7 42.1 Median age for American Indian / Alaska Native residents39.5 42.7 39.4 Median age for Asian residents39.4 39.4 22.0 Median age for Native Hawaiian / Pacific Islander residents-666,666,666.0 -666,666,666.0 25.7 Median age for Other race residents31.1 22.8 23.8 Median age for Two or more races residents22.2 28.0 50.4 Median age for White alone residents47.0 53.1 25.3 Median age for Hispanic or Latino residents25.9 25.0
Owner/renter occupied households by race in Rockford
House owners and renters - White residents 24,740 65.4% Owner occupied13,062 34.6% Renter occupiedHouse owners and renters - Black or African American residents 3,195 30.3% Owner occupied7,351 69.7% Renter occupiedHouse owners and renters - American Indian / Alaska Native residents 332 94.8% Owner occupied18 5.2% Renter occupiedHouse owners and renters - Asian residents 526 32.4% Owner occupied1,097 67.6% Renter occupiedHouse owners and renters - Native Hawaiian / Pacific Islander residents 11 38.9% Owner occupied17 61.1% Renter occupiedHouse owners and renters - Other race residents 2,790 81.4% Owner occupied637 18.6% Renter occupiedHouse owners and renters - Two or more races residents 2,923 53.2% Owner occupied2,571 46.8% Renter occupiedHouse owners and renters - White alone residents 24,236 65.7% Owner occupied12,660 34.3% Renter occupiedHouse owners and renters - Hispanic or Latino residents 4,527 60.8% Owner occupied2,920 39.2% Renter occupied
Language usage in Rockford
English speakers - Total 80.4% of residents of Rockford speak English at home.
14.6% of residents speak Spanish at home 13,226 66.5% Speak English very well6,658 33.5% Speak English less than very well5.0% of residents speak other language at home 4,734 69.5% Speak English very well2,081 30.5% Speak English less than very well
English speakers - Born in the United States 94.8% of residents of Rockford speak English at home.
5.1% of residents speak Spanish at home 761 61.3% Speak English very well481 38.7% Speak English less than very well0.1% of residents speak other language at home 29 100.0% Speak English very well
English speakers - Native, born elsewhere 20.6% of residents of Rockford speak English at home.
76.6% of residents speak Spanish at home 2,105 86.3% Speak English very well334 13.7% Speak English less than very well2.8% of residents speak other language at home 89 100.0% Speak English very well
English speakers - Foreign-born 11.4% of residents of Rockford speak English at home.
49.9% of residents speak Spanish at home 3,704 49.4% Speak English very well3,792 50.6% Speak English less than very well38.8% of residents speak other language at home 3,960 67.9% Speak English very well1,868 32.1% Speak English less than very well
White (Caucasian) - Speak only English Native:
96.9% (70,320)Foreign-born:
22.8% (332)
White (Caucasian) - Speak another language Native:
3.1% (2,243)Foreign-born:
77.2% (1,122)
Black or African American - Speak only English Native:
99.7% (23,126)Foreign-born:
7.7% (194)
Black or African American - Speak another language Native:
0.3% (74)Foreign-born:
92.3% (2,340)
American Indian / Alaska Native - Speak only English Native:
17.6% (53)Foreign-born:
3.5% (29)
American Indian / Alaska Native - Speak another language Native:
88.1% (266)Foreign-born:
97.3% (800)
Asian - Speak only English Native:
71.0% (836)Foreign-born:
13.9% (419)
Asian - Speak another language Native:
29.0% (341)Foreign-born:
86.1% (2,602)
Native Hawaiian / Pacific Islander - Speak only English Native:
92.1% (68)Foreign-born:
45.5% (16)
Native Hawaiian / Pacific Islander - Speak another language Native:
14.4% (11)Foreign-born:
48.0% (17)
Other race - Speak only English Native:
36.7% (3,228)Foreign-born:
8.5% (381)
Other race - Speak another language Native:
63.3% (5,561)Foreign-born:
91.5% (4,124)
Two or more races - Speak only English Native:
65.9% (9,658)Foreign-born:
7.9% (245)
Two or more races - Speak another language Native:
34.1% (5,006)Foreign-born:
92.1% (2,866)
White alone - Speak only English Native:
98.6% (69,193)Foreign-born:
28.8% (318)
White alone - Speak another language Native:
1.4% (958)Foreign-born:
71.2% (788)
Hispanic or Latino - Speak only English Native:
34.6% (6,304)Foreign-born:
7.4% (597)
Hispanic or Latino - Speak another language Native:
65.4% (11,917)Foreign-born:
92.6% (7,496)
Foreign-born residents in Rockford 17,754 residents are foreign born (6.2% Latin America , 3.2% Asia , 1.2% Africa ).
This city:
12.1%Illinois:
14.1%
Marital status for residents in Rockford Marital status - White (Caucasian) population 15 years and over
Males 34.3% Never married46.3% Now married1.1% Separated4.7% Widowed13.7% DivorcedFemales 27.4% Never married41.6% Now married1.3% Separated14.6% Widowed15.2% DivorcedWomen who gave birth in the past 12 months Now married:
37.9% (316)Unmarried:
62.1% (517)
Women who did not give birth in the past 12 months Now married:
35.2% (5,111)Unmarried:
64.8% (9,424)
Marital status - Black or African American population 15 years and over
Males 56.9% Never married27.8% Now married0.0% Separated0.5% Widowed14.8% DivorcedFemales 60.0% Never married18.3% Now married2.5% Separated9.4% Widowed9.8% DivorcedWomen who gave birth in the past 12 months Now married:
28.0% (125)Unmarried:
72.0% (322)
Women who did not give birth in the past 12 months Now married:
21.3% (1,379)Unmarried:
78.7% (5,089)
Marital status - American Indian / Alaska Native population 15 years and over
Males 41.5% Never married24.6% Now married4.2% Separated0.0% Widowed29.6% DivorcedFemales 36.5% Never married45.7% Now married0.0% Separated10.5% Widowed7.2% DivorcedWomen who did not give birth in the past 12 months Now married:
33.0% (102)Unmarried:
67.0% (206)
Marital status - Asian population 15 years and over
Males 28.7% Never married66.7% Now married0.5% Separated2.0% Widowed2.1% DivorcedFemales 21.8% Never married68.4% Now married0.5% Separated7.9% Widowed1.5% DivorcedWomen who gave birth in the past 12 months Now married:
100.0% (40)Unmarried:
0.0% (0)
Women who did not give birth in the past 12 months Now married:
64.0% (701)Unmarried:
36.0% (395)
Marital status - Native Hawaiian / Pacific Islander population 15 years and over
Males 25.5% Never married25.5% Now married21.3% Separated0.0% Widowed27.7% DivorcedFemales 0.0% Never married52.9% Now married0.0% Separated0.0% Widowed47.1% DivorcedMarital status - Other race population 15 years and over
Males 46.1% Never married39.5% Now married0.0% Separated9.2% Widowed5.2% DivorcedFemales 60.0% Never married27.6% Now married1.5% Separated5.3% Widowed5.6% DivorcedWomen who gave birth in the past 12 months Now married:
52.3% (185)Unmarried:
47.7% (169)
Women who did not give birth in the past 12 months Now married:
37.8% (1,431)Unmarried:
62.2% (2,357)
Marital status - Two or more races population 15 years and over
Males 54.9% Never married31.7% Now married1.0% Separated3.5% Widowed8.9% DivorcedFemales 47.2% Never married42.9% Now married0.0% Separated2.6% Widowed7.3% DivorcedWomen who gave birth in the past 12 months Now married:
6.5% (19)Unmarried:
93.5% (268)
Women who did not give birth in the past 12 months Now married:
28.5% (1,370)Unmarried:
71.5% (3,437)
Marital status - White alone, not Hispanic / Latino population 15 years and over
Males 33.1% Never married46.7% Now married1.1% Separated4.9% Widowed14.2% DivorcedFemales 26.3% Never married41.8% Now married1.3% Separated14.9% Widowed15.7% DivorcedWomen who gave birth in the past 12 months Now married:
43.3% (316)Unmarried:
56.7% (414)
Women who did not give birth in the past 12 months Now married:
35.4% (4,926)Unmarried:
64.6% (8,978)
Marital status - Hispanic or Latino population 15 years and over
Males 52.5% Never married35.0% Now married0.0% Separated5.6% Widowed7.0% DivorcedFemales 55.7% Never married32.6% Now married0.9% Separated5.3% Widowed5.5% DivorcedWomen who gave birth in the past 12 months Now married:
41.0% (302)Unmarried:
59.0% (435)
Women who did not give birth in the past 12 months Now married:
37.4% (2,743)Unmarried:
62.6% (4,601)
Ancestries in Rockford
5,761 7.5% German3,379 4.4% Irish3,260 4.2% English3,227 4.2% Italian2,791 3.6% American2,766 3.6% Swedish1,431 1.9% Polish1,002 1.3% Norwegian808 1.0% European657 0.9% Iraqi608 0.8% Scottish593 0.8% African267 0.3% Nigerian252 0.3% Egyptian248 0.3% Scandinavian230 0.3% Danish223 0.3% Russian203 0.3% Dutch196 0.3% Greek187 0.2% Kenyan148 0.2% Scotch-Irish146 0.2% Jordanian141 0.2% Ukrainian140 0.2% British138 0.2% Eastern European129 0.2% French120 0.2% Czech95 0.1% Croatian92 0.1% Ethiopian86 0.1% Yugoslavian83 0.1% Welsh72 0.09% Haitian71 0.09% Lithuanian71 0.09% Arab63 0.08% Palestinian55 0.07% Serbian52 0.07% French Canadian42 0.05% Cypriot41 0.05% Northern European36 0.05% South African36 0.05% Jamaican33 0.04% Maltese33 0.04% Swiss32 0.04% Barbadian31 0.04% Moroccan30 0.04% Hungarian30 0.04% Pennsylvania German29 0.04% Albanian29 0.04% Portuguese29 0.04% Ghanaian24 0.03% Syrian24 0.03% Czechoslovakian21 0.03% Australian19 0.02% Brazilian18 0.02% Slovak17 0.02% Lebanese15 0.02% Iranian14 0.02% Finnish13 0.02% Slavic10 0.01% Belgian10 0.01% Slovene9 0.01% Austrian7 0.01% Bulgarian6 0.01% Armenian6 0.01% Alsatian5 0.01% Turkish5 0.01% Canadian5 0.01% British West Indian
Geographical mobility in Rockford Same house 1 year ago 67,245 86.7% White (Caucasian)23,312 84.2% Black or African American1,055 96.6% American Indian / Alaska Native4,653 86.9% Asian90 100.0% Native Hawaiian / Pacific Islander8,742 85.4% Other race19,654 88.5% Two or more races64,642 86.7% White alone, not Hispanic / Latino23,729 83.8% Hispanic or LatinoMoved within same county 4,510 5.8% White / Caucasian3,740 13.5% Black or African American14 1.3% American Indian / Alaska Native420 7.9% Asian943 9.2% Other race1,948 8.8% Two or more races4,307 5.8% White alone, not Hispanic / Latino3,128 11.1% Hispanic or LatinoMoved within same state 4,242 5.5% White / Caucasian487 1.8% Black or African American22 2.0% American Indian / Alaska Native74 1.4% Asian174 1.7% Other race247 1.1% Two or more races4,173 5.6% White alone, not Hispanic / Latino394 1.4% Hispanic or LatinoMoved from different state 1,327 1.7% White / Caucasian71 0.3% Black or African American140 2.6% Asian26 0.3% Other race263 1.2% Two or more races1,327 1.8% White alone, not Hispanic / Latino141 0.5% Hispanic or LatinoMoved from abroad 233 0.3% White79 0.3% Black or African American47 0.9% Asian326 3.2% Other race88 0.4% Two or more races109 0.1% White alone, not Hispanic / Latino912 3.2% Hispanic or Latino
Children Nativity (place of birth) in Rockford
Children under 6 years - Living with two parents Both parents native 3,981 100.0% NativeBoth parents foreign-born 388 87.6% Native55 12.4% Foreign-bornOne native, one foreign-born parent 489 100.0% NativeChildren under 6 years - Living with one parent Native parent 5,423 100.0% NativeForeign-born parent 1,468 97.3% Native41 2.7% Foreign-bornChildren 6 to 17 years - Living with two parents Both parents native 5,860 100.0% NativeBoth parents foreign-born 2,008 78.5% Native549 21.5% Foreign-bornOne native, one foreign-born parent 1,908 100.0% NativeChildren 6 to 17 years - Living with one parent Native parent 8,836 96.7% Native297 3.3% Foreign-bornForeign-born parent 1,483 71.4% Native593 28.6% Foreign-born
Grandparents responsible for own grandchildren in Rockford
Grandparents (30 to 59 years) White / Caucasian 168 32.6% Responsible for grandchildren347 67.4% Not responsible for grandchildrenBlack or African American 198 67.5% Responsible for grandchildren95 32.5% Not responsible for grandchildrenAsian 27 100.0% Not responsible for grandchildrenOther race 131 84.4% Responsible for grandchildren24 15.6% Not responsible for grandchildrenTwo or more races 111 74.6% Responsible for grandchildren38 25.4% Not responsible for grandchildrenWhite alone, not Hispanic / Latino 153 32.0% Responsible for grandchildren325 68.0% Not responsible for grandchildrenHispanic or Latino 143 53.8% Responsible for grandchildren123 46.2% Not responsible for grandchildrenGrandparents (60 years and over) White / Caucasian 466 64.4% Responsible for grandchildren258 35.6% Not responsible for grandchildrenBlack or African American 108 61.4% Responsible for grandchildren68 38.6% Not responsible for grandchildrenAsian 131 100.0% Not responsible for grandchildrenOther race 64 36.3% Responsible for grandchildren113 63.7% Not responsible for grandchildrenTwo or more races 54 73.8% Responsible for grandchildren19 26.2% Not responsible for grandchildrenWhite alone, not Hispanic / Latino 479 67.6% Responsible for grandchildren230 32.4% Not responsible for grandchildrenHispanic or Latino 72 24.9% Responsible for grandchildren218 75.1% Not responsible for grandchildren