Races in Rock Springs, Wyoming (WY) Detailed Stats
Data:
Races - White alone (%)
Races - White alone (% change since 2000)
Races - Black alone (%)
Races - Black alone (% change since 2000)
Races - American Indian alone (%)
Races - American Indian alone (% change since 2000)
Races - Asian alone (%)
Races - Asian alone (% change since 2000)
Races - Hispanic (%)
Races - Hispanic (% change since 2000)
Races - Native Hawaiian and Other Pacific Islander alone (%)
Races - Native Hawaiian and Other Pacific Islander alone (% change since 2000)
Races - Two or more races(%)
Races - Two or more races(% change since 2000)
Races - Other race alone (%)
Races - Other race alone (% change since 2000)
Racial diversity
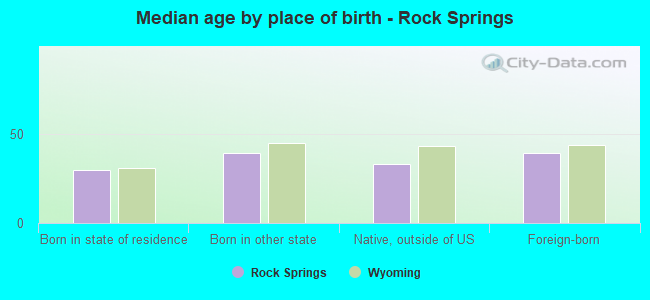
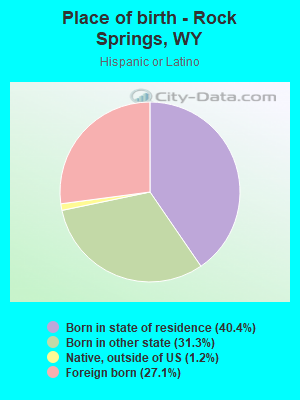
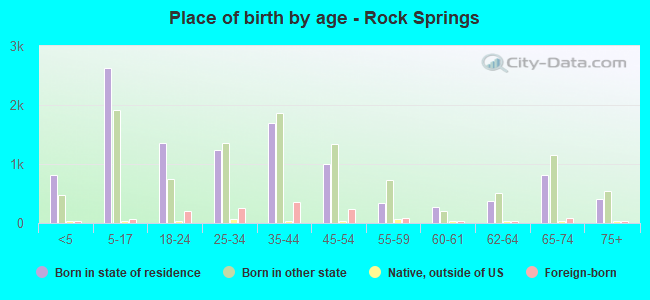
Place of birth - Born in state of residence (%)
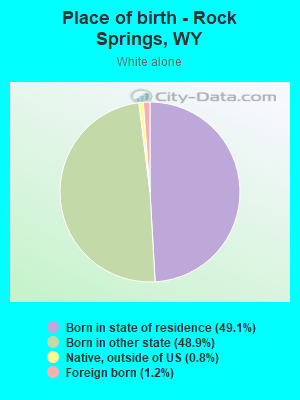
Place of birth - Born in state of residence (%) - White
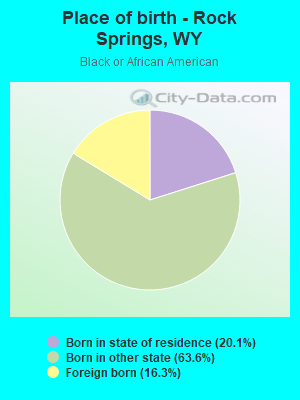
Place of birth - Born in state of residence (%) - Black or African American
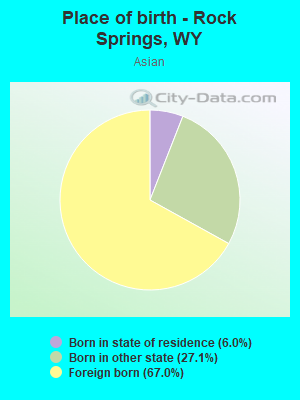
Place of birth - Born in state of residence (%) - Asian
Place of birth - Born in state of residence (%) - Hispanic or Latino
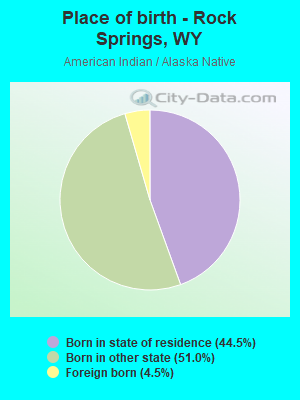
Place of birth - Born in state of residence (%) - American Indian and Alaska Native
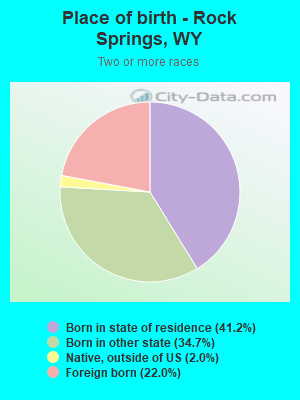
Place of birth - Born in state of residence (%) - Multirace
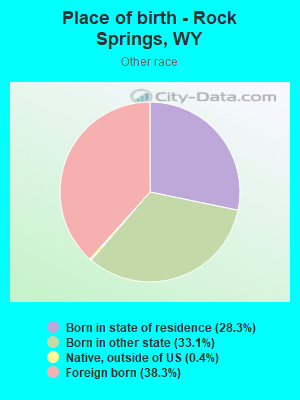
Place of birth - Born in state of residence (%) - Other Race
Place of birth - Born in other state (%)
Place of birth - Born in other state (%) - White
Place of birth - Born in other state (%) - Black or African American
Place of birth - Born in other state (%) - Asian
Place of birth - Born in other state (%) - Hispanic or Latino
Place of birth - Born in other state (%) - American Indian and Alaska Native
Place of birth - Born in other state (%) - Multirace
Place of birth - Born in other state (%) - Other Race
Place of birth - Native, outside of US (%)
Place of birth - Native, outside of US (%) - White
Place of birth - Native, outside of US (%) - Black or African American
Place of birth - Native, outside of US (%) - Asian
Place of birth - Native, outside of US (%) - Hispanic or Latino
Place of birth - Native, outside of US (%) - American Indian and Alaska Native
Place of birth - Native, outside of US (%) - Multirace
Place of birth - Native, outside of US (%) - Other Race
Place of birth - Foreign born (%)
Place of birth - Foreign born (%) - White
Place of birth - Foreign born (%) - Black or African American
Place of birth - Foreign born (%) - Asian
Place of birth - Foreign born (%) - Hispanic or Latino
Place of birth - Foreign born (%) - American Indian and Alaska Native
Place of birth - Foreign born (%) - Multirace
Place of birth - Foreign born (%) - Other Race
Residents speaking English at home (%)
Residents speaking English at home - Born in the United States (%)
Residents speaking English at home - Native, born elsewhere (%)
Residents speaking English at home - Foreign born (%)
Residents speaking Spanish at home (%)
Residents speaking Spanish at home - Born in the United States (%)
Residents speaking Spanish at home - Native, born elsewhere (%)
Residents speaking Spanish at home - Foreign born (%)
Residents speaking other language at home (%)
Residents speaking other language at home - Born in the United States (%)
Residents speaking other language at home - Native, born elsewhere (%)
Residents speaking other language at home - Foreign born (%)
Marital status - Never married (%)
Marital status - Now married (%)
Marital status - Separated (%)
Marital status - Widowed (%)
Marital status - Divorced (%)
Ancestries Reported - Arab (%)
Ancestries Reported - Czech (%)
Ancestries Reported - Danish (%)
Ancestries Reported - Dutch (%)
Ancestries Reported - English (%)
Ancestries Reported - French (%)
Ancestries Reported - French Canadian (%)
Ancestries Reported - German (%)
Ancestries Reported - Greek (%)
Ancestries Reported - Hungarian (%)
Ancestries Reported - Irish (%)
Ancestries Reported - Italian (%)
Ancestries Reported - Lithuanian (%)
Ancestries Reported - Norwegian (%)
Ancestries Reported - Polish (%)
Ancestries Reported - Portuguese (%)
Ancestries Reported - Russian (%)
Ancestries Reported - Scotch-Irish (%)
Ancestries Reported - Scottish (%)
Ancestries Reported - Slovak (%)
Ancestries Reported - Subsaharan African (%)
Ancestries Reported - Swedish (%)
Ancestries Reported - Swiss (%)
Ancestries Reported - Ukrainian (%)
Ancestries Reported - United States (%)
Ancestries Reported - Welsh (%)
Ancestries Reported - West Indian (%)
Ancestries Reported - Other (%)
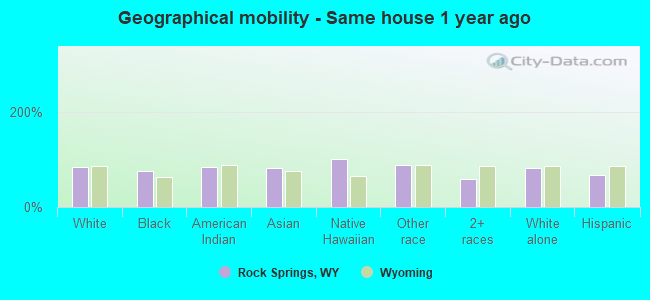
Geographical mobility - Same house 1 year ago (%)
Geographical mobility - Same house 1 year ago (%) - White
Geographical mobility - Same house 1 year ago (%) - Black or African American
Geographical mobility - Same house 1 year ago (%) - Asian
Geographical mobility - Same house 1 year ago (%) - Hispanic or Latino
Geographical mobility - Same house 1 year ago (%) - American Indian and Alaska Native
Geographical mobility - Same house 1 year ago (%) - Multirace
Geographical mobility - Same house 1 year ago (%) - Other Race
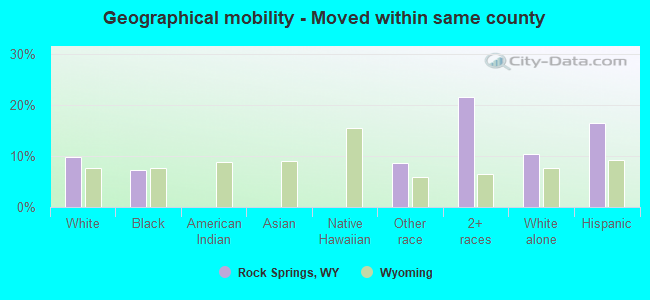
Geographical mobility - Moved within same county (%)
Geographical mobility - Moved within same county (%) - White
Geographical mobility - Moved within same county (%) - Black or African American
Geographical mobility - Moved within same county (%) - Asian
Geographical mobility - Moved within same county (%) - Hispanic or Latino
Geographical mobility - Moved within same county (%) - American Indian and Alaska Native
Geographical mobility - Moved within same county (%) - Multirace
Geographical mobility - Moved within same county (%) - Other Race
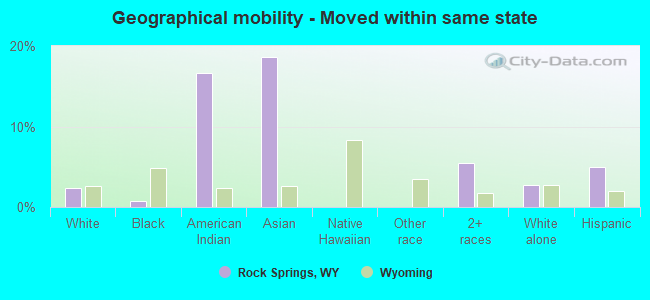
Geographical mobility - Moved from different county within same state (%)
Geographical mobility - Moved from different county within same state (%) - White
Geographical mobility - Moved from different county within same state (%) - Black or African American
Geographical mobility - Moved from different county within same state (%) - Asian
Geographical mobility - Moved from different county within same state (%) - Hispanic or Latino
Geographical mobility - Moved from different county within same state (%) - American Indian and Alaska Native
Geographical mobility - Moved from different county within same state (%) - Multirace
Geographical mobility - Moved from different county within same state (%) - Other Race
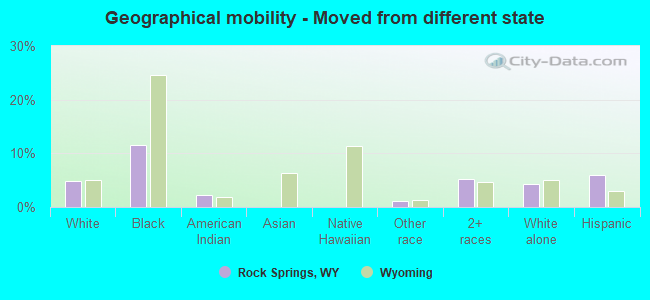
Geographical mobility - Moved from different state (%)
Geographical mobility - Moved from different state (%) - White
Geographical mobility - Moved from different state (%) - Black or African American
Geographical mobility - Moved from different state (%) - Asian
Geographical mobility - Moved from different state (%) - Hispanic or Latino
Geographical mobility - Moved from different state (%) - American Indian and Alaska Native
Geographical mobility - Moved from different state (%) - Multirace
Geographical mobility - Moved from different state (%) - Other Race
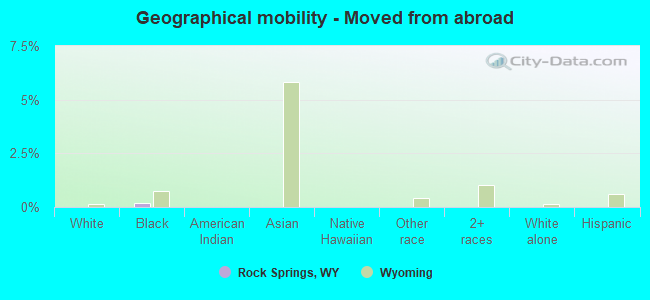
Geographical mobility - Moved from abroad (%)
Geographical mobility - Moved from abroad (%) - White
Geographical mobility - Moved from abroad (%) - Black or African American
Geographical mobility - Moved from abroad (%) - Asian
Geographical mobility - Moved from abroad (%) - Hispanic or Latino
Geographical mobility - Moved from abroad (%) - American Indian and Alaska Native
Geographical mobility - Moved from abroad (%) - Multirace
Geographical mobility - Moved from abroad (%) - Other Race
Place of birth for the foreign-born population - Ireland (%)
Place of birth for the foreign-born population - Denmark (%)
Place of birth for the foreign-born population - Norway (%)
Place of birth for the foreign-born population - Sweden (%)
Place of birth for the foreign-born population - United Kingdom (%)
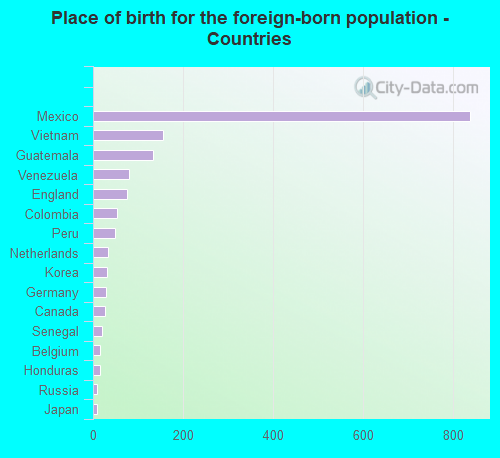
Place of birth for the foreign-born population - England (%)
Place of birth for the foreign-born population - Scotland (%)
Place of birth for the foreign-born population - Other Northern Europe (%)
Place of birth for the foreign-born population - Austria (%)
Place of birth for the foreign-born population - Belgium (%)
Place of birth for the foreign-born population - France (%)
Place of birth for the foreign-born population - Germany (%)
Place of birth for the foreign-born population - Netherlands (%)
Place of birth for the foreign-born population - Switzerland (%)
Place of birth for the foreign-born population - Other Western Europe (%)
Place of birth for the foreign-born population - Greece (%)
Place of birth for the foreign-born population - Italy (%)
Place of birth for the foreign-born population - Portugal (%)
Place of birth for the foreign-born population - Spain (%)
Place of birth for the foreign-born population - Other Southern Europe (%)
Place of birth for the foreign-born population - Albania (%)
Place of birth for the foreign-born population - Belarus (%)
Place of birth for the foreign-born population - Bosnia and Herzegovina (%)
Place of birth for the foreign-born population - Bulgaria (%)
Place of birth for the foreign-born population - Croatia (%)
Place of birth for the foreign-born population - Czechoslovakia (%)
Place of birth for the foreign-born population - Hungary (%)
Place of birth for the foreign-born population - Latvia (%)
Place of birth for the foreign-born population - Lithuania (%)
Place of birth for the foreign-born population - North Macedonia (Macedonia) (%)
Place of birth for the foreign-born population - Moldova (%)
Place of birth for the foreign-born population - Poland (%)
Place of birth for the foreign-born population - Romania (%)
Place of birth for the foreign-born population - Russia (%)
Place of birth for the foreign-born population - Serbia (%)
Place of birth for the foreign-born population - Ukraine (%)
Place of birth for the foreign-born population - Other Eastern Europe (%)
Place of birth for the foreign-born population - China (%)
Place of birth for the foreign-born population - Hong Kong (%)
Place of birth for the foreign-born population - Taiwan (%)
Place of birth for the foreign-born population - Japan (%)
Place of birth for the foreign-born population - Korea (%)
Place of birth for the foreign-born population - Other Eastern Asia (%)
Place of birth for the foreign-born population - Afghanistan (%)
Place of birth for the foreign-born population - Bangladesh (%)
Place of birth for the foreign-born population - India (%)
Place of birth for the foreign-born population - Iran (%)
Place of birth for the foreign-born population - Kazakhstan (%)
Place of birth for the foreign-born population - Nepal (%)
Place of birth for the foreign-born population - Pakistan (%)
Place of birth for the foreign-born population - Sri Lanka (%)
Place of birth for the foreign-born population - Uzbekistan (%)
Place of birth for the foreign-born population - Other South Central Asia (%)
Place of birth for the foreign-born population - Burma (%)
Place of birth for the foreign-born population - Cambodia (%)
Place of birth for the foreign-born population - Indonesia (%)
Place of birth for the foreign-born population - Laos (%)
Place of birth for the foreign-born population - Malaysia (%)
Place of birth for the foreign-born population - Philippines (%)
Place of birth for the foreign-born population - Singapore (%)
Place of birth for the foreign-born population - Thailand (%)
Place of birth for the foreign-born population - Vietnam (%)
Place of birth for the foreign-born population - Other South Eastern Asia (%)
Place of birth for the foreign-born population - Armenia (%)
Place of birth for the foreign-born population - Iraq (%)
Place of birth for the foreign-born population - Israel (%)
Place of birth for the foreign-born population - Jordan (%)
Place of birth for the foreign-born population - Kuwait (%)
Place of birth for the foreign-born population - Lebanon (%)
Place of birth for the foreign-born population - Saudi Arabia (%)
Place of birth for the foreign-born population - Syria (%)
Place of birth for the foreign-born population - Turkey (%)
Place of birth for the foreign-born population - Yemen (%)
Place of birth for the foreign-born population - Other Western Asia (%)
Place of birth for the foreign-born population - Eritrea (%)
Place of birth for the foreign-born population - Ethiopia (%)
Place of birth for the foreign-born population - Kenya (%)
Place of birth for the foreign-born population - Somalia (%)
Place of birth for the foreign-born population - Uganda (%)
Place of birth for the foreign-born population - Zimbabwe (%)
Place of birth for the foreign-born population - Other Eastern Africa (%)
Place of birth for the foreign-born population - Cameroon (%)
Place of birth for the foreign-born population - Congo (%)
Place of birth for the foreign-born population - Democratic Republic of Congo (Zaire) (%)
Place of birth for the foreign-born population - Other Middle Africa (%)
Place of birth for the foreign-born population - Egypt (%)
Place of birth for the foreign-born population - Morocco (%)
Place of birth for the foreign-born population - Sudan (%)
Place of birth for the foreign-born population - Other Northern Africa (%)
Place of birth for the foreign-born population - South Africa (%)
Place of birth for the foreign-born population - Other Southern Africa (%)
Place of birth for the foreign-born population - Cabo Verde (%)
Place of birth for the foreign-born population - Ghana (%)
Place of birth for the foreign-born population - Liberia (%)
Place of birth for the foreign-born population - Nigeria (%)
Place of birth for the foreign-born population - Senegal (%)
Place of birth for the foreign-born population - Sierra Leone (%)
Place of birth for the foreign-born population - Other Western Africa (%)
Place of birth for the foreign-born population - Australia (%)
Place of birth for the foreign-born population - New Zealand (%)
Place of birth for the foreign-born population - Fiji (%)
Place of birth for the foreign-born population - Micronesia (%)
Place of birth for the foreign-born population - Bahamas (%)
Place of birth for the foreign-born population - Barbados (%)
Place of birth for the foreign-born population - Cuba (%)
Place of birth for the foreign-born population - Dominica (%)
Place of birth for the foreign-born population - Dominican Republic (%)
Place of birth for the foreign-born population - Grenada (%)
Place of birth for the foreign-born population - Haiti (%)
Place of birth for the foreign-born population - Jamaica (%)
Place of birth for the foreign-born population - St. Vincent and the Grenadines (%)
Place of birth for the foreign-born population - Trinidad and Tobago (%)
Place of birth for the foreign-born population - West Indies (%)
Place of birth for the foreign-born population - Other Caribbean (%)
Place of birth for the foreign-born population - Belize (%)
Place of birth for the foreign-born population - Costa Rica (%)
Place of birth for the foreign-born population - El Salvador (%)
Place of birth for the foreign-born population - Guatemala (%)
Place of birth for the foreign-born population - Honduras (%)
Place of birth for the foreign-born population - Mexico (%)
Place of birth for the foreign-born population - Nicaragua (%)
Place of birth for the foreign-born population - Panama (%)
Place of birth for the foreign-born population - Other Central America (%)
Place of birth for the foreign-born population - Argentina (%)
Place of birth for the foreign-born population - Bolivia (%)
Place of birth for the foreign-born population - Brazil (%)
Place of birth for the foreign-born population - Chile (%)
Place of birth for the foreign-born population - Colombia (%)
Place of birth for the foreign-born population - Ecuador (%)
Place of birth for the foreign-born population - Guyana (%)
Place of birth for the foreign-born population - Peru (%)
Place of birth for the foreign-born population - Uruguay (%)
Place of birth for the foreign-born population - Venezuela (%)
Place of birth for the foreign-born population - Other South America (%)
Place of birth for the foreign-born population - Canada (%)
Place of birth for the foreign-born population - Other Northern America (%)
Place of birth for the foreign-born population - Other (%)
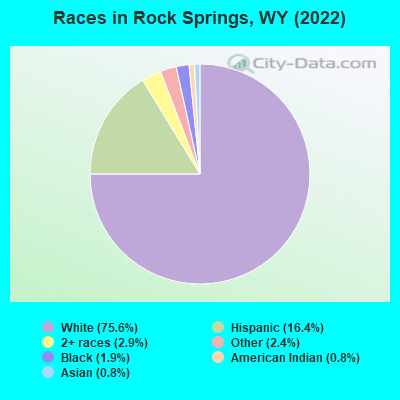
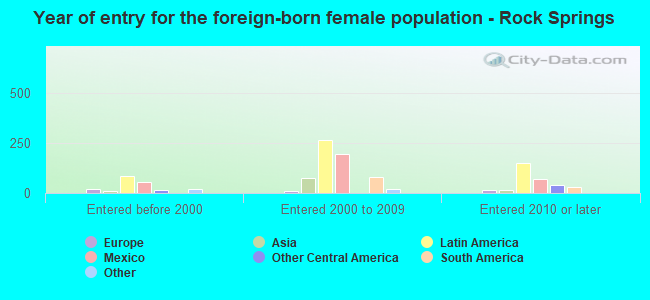
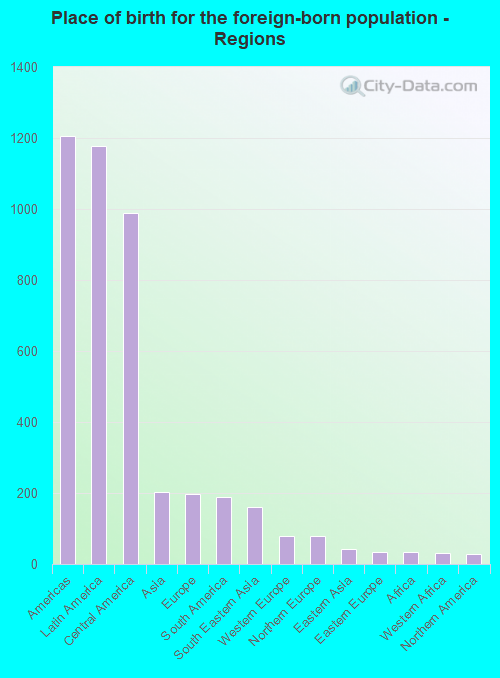
According to 2022 data, the most numerous races in Rock Springs, WY are White alone (17,764 residents), Hispanic (3,852 residents), and Two or more races (674 residents). 90.0% of Rock Springs residents speak English at home. 7.0% of Rock Springs, WY residents are foreign-born (4.9% born in Latin America, 0.9% born in Asia, 0.8% born in Europe), which is 57.0% greater than the foreign-born rate of 3.0% across the entire state of Wyoming.
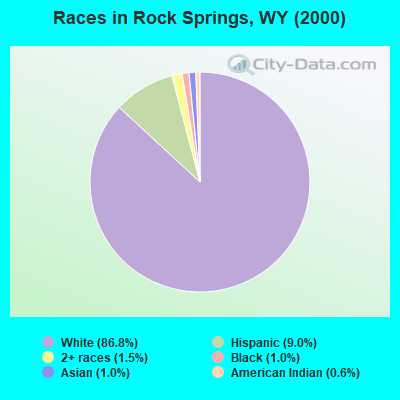
Race distribution in Rock Springs
2000 2022
438,799 88.9% White alone 31,669 6.4% Hispanic 10,238 2.1% American Indian alone 6,164 1.2% Two or more races 3,504 0.7% Black alone 2,670 0.5% Asian alone 474 0.10% Other race alone 264 0.05% Native Hawaiian and Other
473,220 81.4% White alone 62,803 10.8% Hispanic 22,911 3.9% Two or more races 9,589 1.6% American Indian alone 4,997 0.9% Other race alone 3,990 0.7% Black alone 3,577 0.6% Asian alone 294 0.05% Native Hawaiian and Other
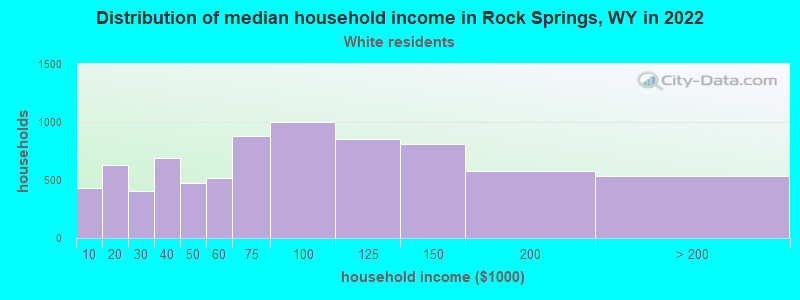
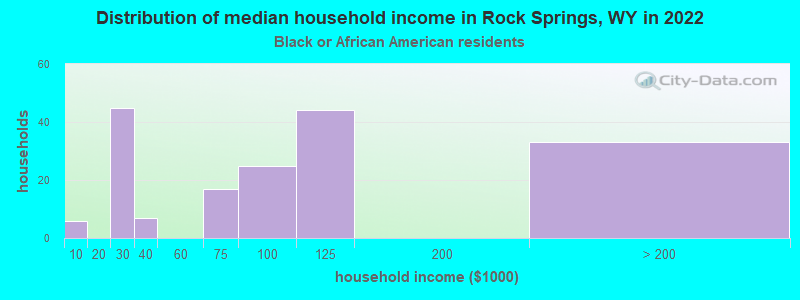
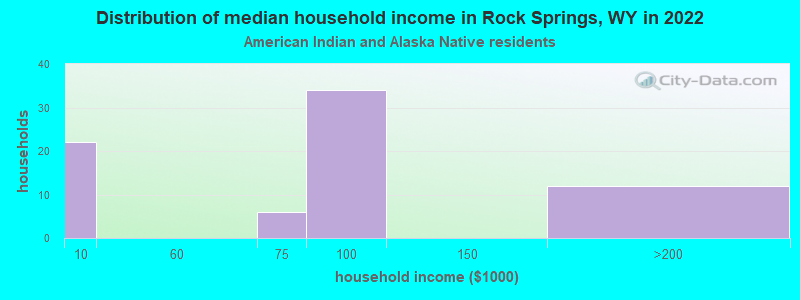
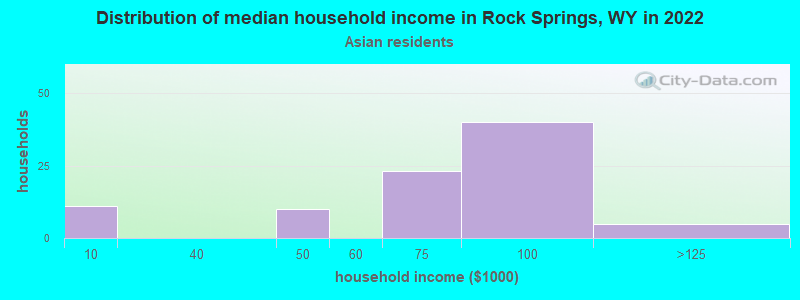
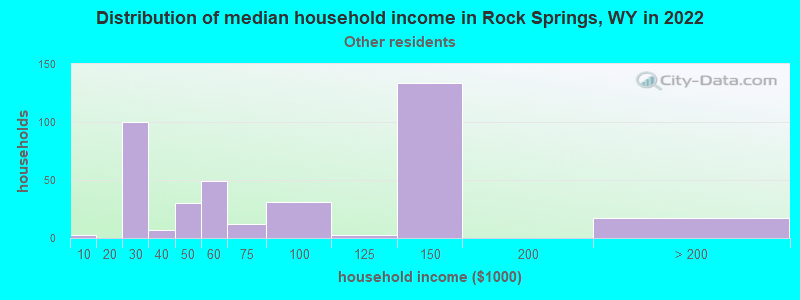
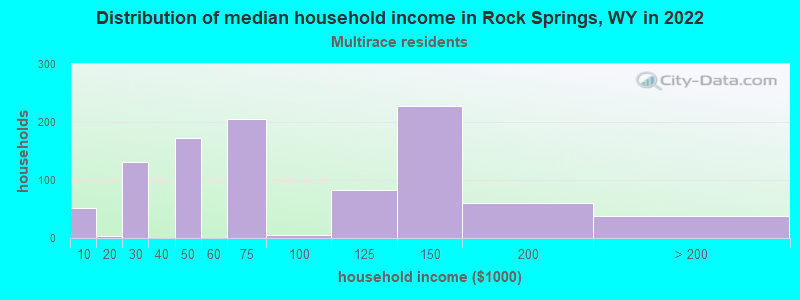
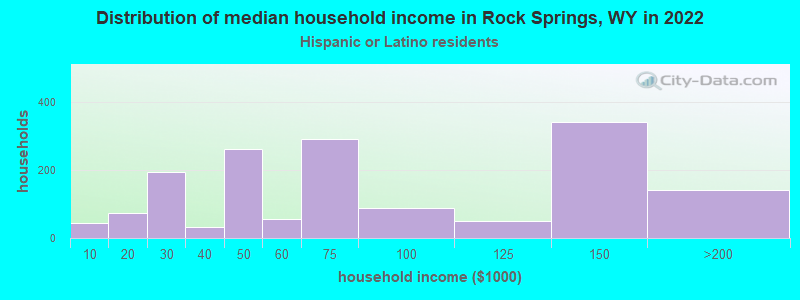
Income and house value in Rock Springs Median household income in 2022 $75,723 White non-Hispanic householders$86,750 Black householders$59,146 American Indian and Alaska Native householders$108,750 Asian householders$52,131 Some other race householders$74,672 Two or more races householders$75,925 Hispanic or Latino race householdersMedian 2022 house value $292,901 White Non-Hispanic householders$217,719 Black or African American householders $270,262 Asian householders$266,909 Some other race householders$300,726 Two or more races householders$268,027 Hispanic or Latino householders
Median age by race in Rock Springs
37.3 Median age for White residents37.4 37.0 36.0 Median age for Black or African American residents16.3 56.6 32.0 Median age for American Indian / Alaska Native residents54.8 23.1 33.5 Median age for Asian residents28.1 68.9 -594,708,994.1 Median age for Native Hawaiian / Pacific Islander residents-652,729,383.8 -865,828,091.4 23.3 Median age for Other race residents24.2 32.0 27.4 Median age for Two or more races residents28.1 25.8 37.5 Median age for White alone residents37.3 37.8 26.0 Median age for Hispanic or Latino residents26.0 29.6
Owner/renter occupied households by race in Rock Springs
House owners and renters - White residents 5,782 74.4% Owner occupied1,992 25.6% Renter occupiedHouse owners and renters - Black or African American residents 119 67.4% Owner occupied58 32.6% Renter occupiedHouse owners and renters - American Indian / Alaska Native residents 62 65.1% Owner occupied33 34.9% Renter occupiedHouse owners and renters - Asian residents 17 18.8% Owner occupied73 81.2% Renter occupiedHouse owners and renters - Other race residents 312 81.2% Owner occupied72 18.8% Renter occupiedHouse owners and renters - Two or more races residents 528 51.9% Owner occupied489 48.1% Renter occupiedHouse owners and renters - White alone residents 5,498 74.7% Owner occupied1,865 25.3% Renter occupiedHouse owners and renters - Hispanic or Latino residents 802 55.7% Owner occupied639 44.3% Renter occupied
Language usage in Rock Springs
English speakers - Total 90.0% of residents of Rock Springs speak English at home.
8.0% of residents speak Spanish at home 1,131 64.0% Speak English very well637 36.0% Speak English less than very well2.0% of residents speak other language at home 242 55.9% Speak English very well191 44.1% Speak English less than very well
English speakers - Born in the United States 96.2% of residents of Rock Springs speak English at home.
3.0% of residents speak Spanish at home 277 90.2% Speak English very well30 9.8% Speak English less than very well0.7% of residents speak other language at home 44 62.9% Speak English very well26 37.1% Speak English less than very well
English speakers - Native, born elsewhere 94.2% of residents of Rock Springs speak English at home.
6.7% of residents speak Spanish at home 14 100.0% Speak English very well1.0% of residents speak other language at home 2 100.0% Speak English very well
English speakers - Foreign-born 11.4% of residents of Rock Springs speak English at home.
71.2% of residents speak Spanish at home 484 47.3% Speak English very well539 52.7% Speak English less than very well19.7% of residents speak other language at home 114 40.3% Speak English very well169 59.7% Speak English less than very well
White (Caucasian) - Speak only English Native:
98.3% (17,213)Foreign-born:
24.6% (64)
White (Caucasian) - Speak another language Native:
1.6% (288)Foreign-born:
69.5% (180)
Black or African American - Speak only English Native:
98.9% (432)Foreign-born:
31.5% (21)
Black or African American - Speak another language Native:
1.1% (5)Foreign-born:
68.9% (45)
Asian - Speak only English Native:
48.4% (10)Foreign-born:
16.1% (30)
Asian - Speak another language Native:
100.0% (21)Foreign-born:
74.4% (138)
Other race - Speak only English Native:
81.1% (598)Foreign-born:
8.0% (42)
Other race - Speak another language Native:
22.1% (163)Foreign-born:
91.8% (477)
Two or more races - Speak only English Native:
78.7% (1,555)Foreign-born:
1.2% (7)
Two or more races - Speak another language Native:
22.2% (439)Foreign-born:
100.0% (617)
White alone - Speak only English Native:
98.7% (16,453)Foreign-born:
26.4% (55)
White alone - Speak another language Native:
1.3% (214)Foreign-born:
75.1% (157)
Hispanic or Latino - Speak only English Native:
73.6% (1,748)Foreign-born:
8.8% (90)
Hispanic or Latino - Speak another language Native:
26.4% (627)Foreign-born:
98.8% (1,003)
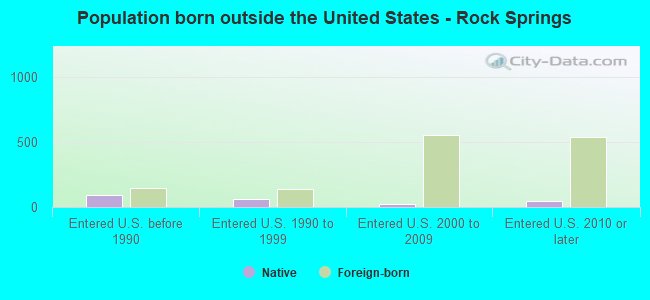
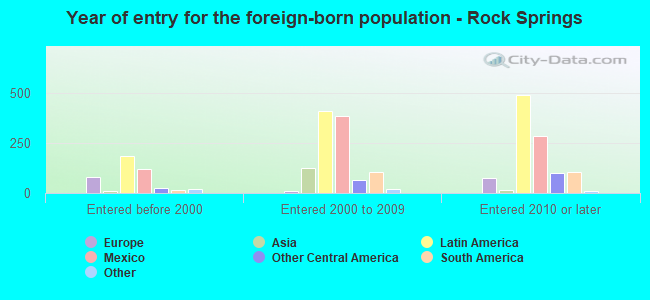
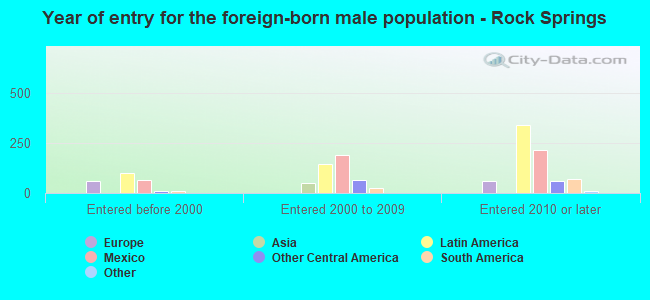
Foreign-born residents in Rock Springs 1,638 residents are foreign born (4.9% Latin America , 0.9% Asia , 0.8% Europe ).
This city:
7.0%Wyoming:
3.4%
Marital status for residents in Rock Springs Marital status - White (Caucasian) population 15 years and over
Males 34.8% Never married48.8% Now married2.2% Separated2.7% Widowed11.5% DivorcedFemales 21.5% Never married48.6% Now married2.6% Separated9.3% Widowed18.0% DivorcedWomen who gave birth in the past 12 months Now married:
79.5% (179)Unmarried:
20.5% (46)
Women who did not give birth in the past 12 months Now married:
47.3% (1,925)Unmarried:
52.7% (2,146)
Marital status - Black or African American population 15 years and over
Males 21.2% Never married18.6% Now married3.2% Separated3.2% Widowed53.8% DivorcedFemales 31.1% Never married15.0% Now married0.0% Separated43.7% Widowed10.2% DivorcedWomen who gave birth in the past 12 months Now married:
0.0% (0)Unmarried:
100.0% (7)
Women who did not give birth in the past 12 months Now married:
33.0% (30)Unmarried:
67.0% (61)
Marital status - American Indian / Alaska Native population 15 years and over
Males 33.7% Never married66.3% Now married0.0% Separated0.0% Widowed0.0% DivorcedFemales 1.3% Never married71.8% Now married0.0% Separated26.9% Widowed0.0% DivorcedWomen who did not give birth in the past 12 months Now married:
98.2% (51)Unmarried:
1.8% (1)
Marital status - Asian population 15 years and over
Males 100.0% Never married0.0% Now married0.0% Separated0.0% Widowed0.0% DivorcedFemales 18.1% Never married61.2% Now married0.0% Separated4.3% Widowed16.4% DivorcedWomen who did not give birth in the past 12 months Now married:
75.9% (67)Unmarried:
24.1% (21)
Marital status - Other race population 15 years and over
Males 36.5% Never married55.6% Now married0.0% Separated6.1% Widowed1.9% DivorcedFemales 39.3% Never married58.9% Now married0.3% Separated0.0% Widowed1.5% DivorcedWomen who gave birth in the past 12 months Now married:
100.0% (15)Unmarried:
0.0% (0)
Women who did not give birth in the past 12 months Now married:
55.1% (187)Unmarried:
44.9% (153)
Marital status - Two or more races population 15 years and over
Males 48.3% Never married37.8% Now married3.6% Separated0.0% Widowed10.4% DivorcedFemales 32.1% Never married55.5% Now married0.0% Separated1.4% Widowed10.9% DivorcedWomen who gave birth in the past 12 months Now married:
100.0% (24)Unmarried:
0.0% (0)
Women who did not give birth in the past 12 months Now married:
41.0% (269)Unmarried:
59.0% (388)
Marital status - White alone, not Hispanic / Latino population 15 years and over
Males 35.4% Never married48.4% Now married1.3% Separated2.8% Widowed12.1% DivorcedFemales 21.0% Never married47.8% Now married2.8% Separated10.0% Widowed18.4% DivorcedWomen who gave birth in the past 12 months Now married:
79.5% (183)Unmarried:
20.5% (47)
Women who did not give birth in the past 12 months Now married:
46.1% (1,714)Unmarried:
53.9% (2,004)
Marital status - Hispanic or Latino population 15 years and over
Males 34.4% Never married48.4% Now married8.0% Separated2.4% Widowed6.8% DivorcedFemales 33.3% Never married54.8% Now married0.1% Separated2.8% Widowed9.1% DivorcedWomen who gave birth in the past 12 months Now married:
100.0% (29)Unmarried:
0.0% (0)
Women who did not give birth in the past 12 months Now married:
50.6% (511)Unmarried:
49.4% (498)
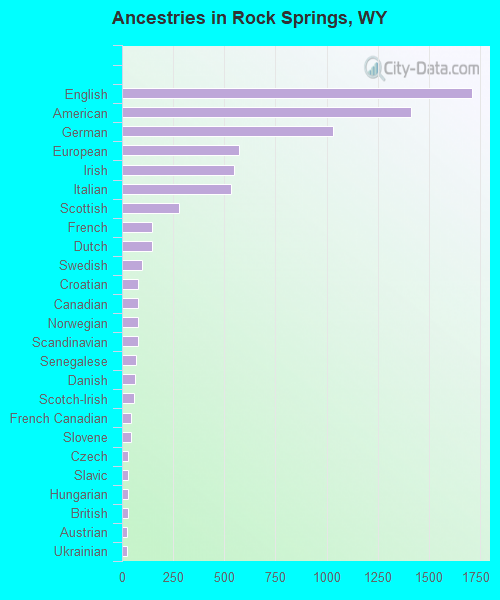
Ancestries in Rock Springs
1,709 15.4% English1,415 12.7% American1,030 9.3% German571 5.1% European547 4.9% Irish535 4.8% Italian277 2.5% Scottish148 1.3% French145 1.3% Dutch99 0.9% Swedish80 0.7% Croatian78 0.7% Canadian78 0.7% Norwegian78 0.7% Scandinavian67 0.6% Senegalese63 0.6% Danish57 0.5% Scotch-Irish45 0.4% French Canadian42 0.4% Slovene30 0.3% Czech30 0.3% Slavic28 0.3% Hungarian27 0.2% British26 0.2% Austrian26 0.2% Ukrainian21 0.2% Basque21 0.2% Romanian20 0.2% Polish15 0.1% Eastern European12 0.1% Swiss12 0.1% Yugoslavian11 0.10% Greek10 0.09% Russian9 0.08% Welsh5 0.04% Ghanaian5 0.04% Finnish4 0.04% African3 0.03% Nigerian1 0.01% Ethiopian1 0.01% Northern European
Geographical mobility in Rock Springs Same house 1 year ago 15,329 82.6% White (Caucasian)334 75.3% Black or African American178 83.2% American Indian / Alaska Native243 82.4% Asian2 100.0% Native Hawaiian / Pacific Islander1,177 87.9% Other race1,632 57.9% Two or more races14,452 82.3% White alone, not Hispanic / Latino2,556 67.0% Hispanic or LatinoMoved within same county 1,828 9.9% White / Caucasian32 7.3% Black or African American116 8.7% Other race605 21.5% Two or more races1,832 10.4% White alone, not Hispanic / Latino630 16.5% Hispanic or LatinoMoved within same state 443 2.4% White / Caucasian3 0.8% Black or African American36 16.7% American Indian / Alaska Native55 18.6% Asian156 5.5% Two or more races470 2.7% White alone, not Hispanic / Latino189 5.0% Hispanic or LatinoMoved from different state 908 4.9% White / Caucasian51 11.5% Black or African American5 2.3% American Indian / Alaska Native16 1.2% Other race147 5.2% Two or more races751 4.3% White alone, not Hispanic / Latino225 5.9% Hispanic or LatinoMoved from abroad 4 0.0% White1 0.2% Black or African American4 0.0% White alone, not Hispanic / Latino
Children Nativity (place of birth) in Rock Springs
Children under 6 years - Living with two parents Both parents native 1,065 100.0% NativeBoth parents foreign-born 17 100.0% NativeOne native, one foreign-born parent 49 100.0% NativeChildren under 6 years - Living with one parent Native parent 464 100.0% NativeForeign-born parent 45 79.1% Native12 20.9% Foreign-bornChildren 6 to 17 years - Living with two parents Both parents native 2,497 99.4% Native16 0.6% Foreign-bornBoth parents foreign-born 201 82.1% Native44 17.9% Foreign-bornOne native, one foreign-born parent 222 100.0% NativeChildren 6 to 17 years - Living with one parent Native parent 1,035 100.0% NativeForeign-born parent 111 48.8% Native117 51.2% Foreign-born
Grandparents responsible for own grandchildren in Rock Springs
Grandparents (30 to 59 years) White / Caucasian 36 15.5% Responsible for grandchildren194 84.5% Not responsible for grandchildrenTwo or more races 30 30.9% Responsible for grandchildren68 69.1% Not responsible for grandchildrenWhite alone, not Hispanic / Latino 47 19.0% Responsible for grandchildren200 81.0% Not responsible for grandchildrenHispanic or Latino 44 100.0% Not responsible for grandchildrenGrandparents (60 years and over) White / Caucasian 12 8.2% Responsible for grandchildren137 91.8% Not responsible for grandchildrenTwo or more races 7 25.1% Responsible for grandchildren20 74.9% Not responsible for grandchildrenWhite alone, not Hispanic / Latino 13 8.7% Responsible for grandchildren136 91.3% Not responsible for grandchildrenHispanic or Latino 4 100.0% Responsible for grandchildren