Races in Rock Falls, Illinois (IL) Detailed Stats
Data:
Races - White alone (%)
Races - White alone (% change since 2000)
Races - Black alone (%)
Races - Black alone (% change since 2000)
Races - American Indian alone (%)
Races - American Indian alone (% change since 2000)
Races - Asian alone (%)
Races - Asian alone (% change since 2000)
Races - Hispanic (%)
Races - Hispanic (% change since 2000)
Races - Native Hawaiian and Other Pacific Islander alone (%)
Races - Native Hawaiian and Other Pacific Islander alone (% change since 2000)
Races - Two or more races(%)
Races - Two or more races(% change since 2000)
Races - Other race alone (%)
Races - Other race alone (% change since 2000)
Racial diversity
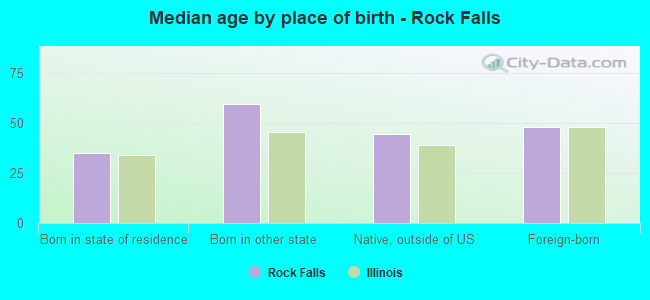
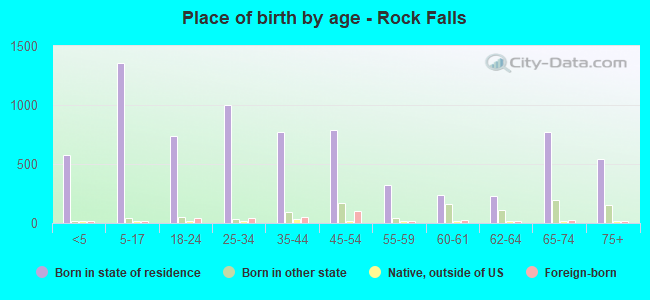
Place of birth - Born in state of residence (%)
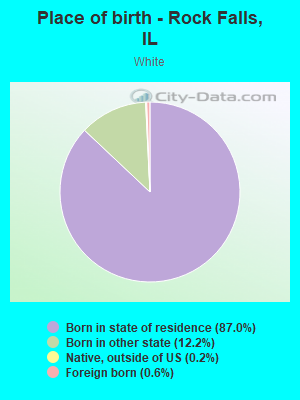
Place of birth - Born in state of residence (%) - White
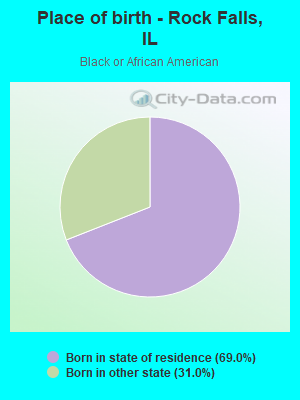
Place of birth - Born in state of residence (%) - Black or African American
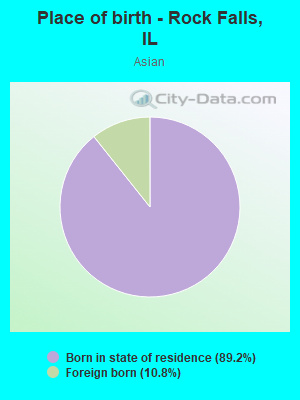
Place of birth - Born in state of residence (%) - Asian
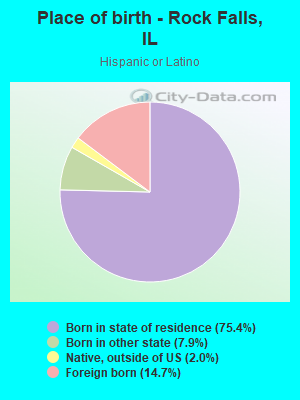
Place of birth - Born in state of residence (%) - Hispanic or Latino
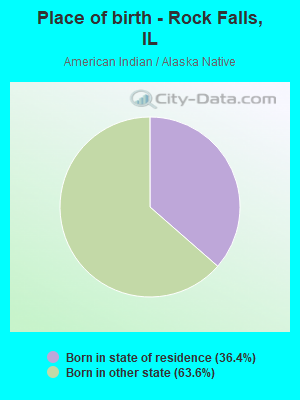
Place of birth - Born in state of residence (%) - American Indian and Alaska Native
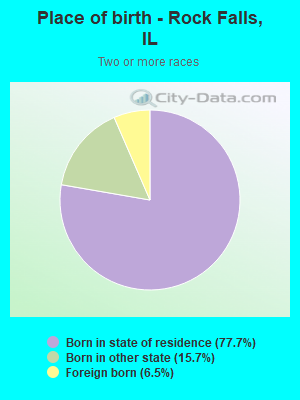
Place of birth - Born in state of residence (%) - Multirace
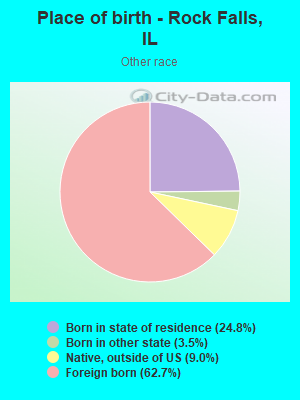
Place of birth - Born in state of residence (%) - Other Race
Place of birth - Born in other state (%)
Place of birth - Born in other state (%) - White
Place of birth - Born in other state (%) - Black or African American
Place of birth - Born in other state (%) - Asian
Place of birth - Born in other state (%) - Hispanic or Latino
Place of birth - Born in other state (%) - American Indian and Alaska Native
Place of birth - Born in other state (%) - Multirace
Place of birth - Born in other state (%) - Other Race
Place of birth - Native, outside of US (%)
Place of birth - Native, outside of US (%) - White
Place of birth - Native, outside of US (%) - Black or African American
Place of birth - Native, outside of US (%) - Asian
Place of birth - Native, outside of US (%) - Hispanic or Latino
Place of birth - Native, outside of US (%) - American Indian and Alaska Native
Place of birth - Native, outside of US (%) - Multirace
Place of birth - Native, outside of US (%) - Other Race
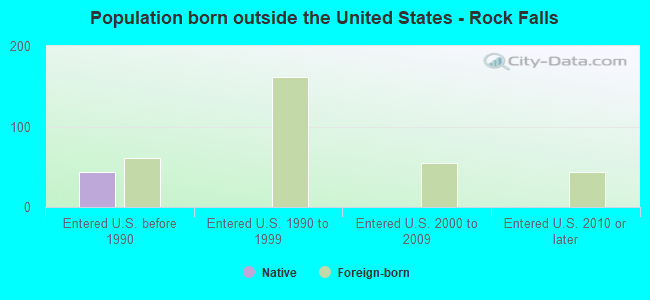
Place of birth - Foreign born (%)
Place of birth - Foreign born (%) - White
Place of birth - Foreign born (%) - Black or African American
Place of birth - Foreign born (%) - Asian
Place of birth - Foreign born (%) - Hispanic or Latino
Place of birth - Foreign born (%) - American Indian and Alaska Native
Place of birth - Foreign born (%) - Multirace
Place of birth - Foreign born (%) - Other Race
Residents speaking English at home (%)
Residents speaking English at home - Born in the United States (%)
Residents speaking English at home - Native, born elsewhere (%)
Residents speaking English at home - Foreign born (%)
Residents speaking Spanish at home (%)
Residents speaking Spanish at home - Born in the United States (%)
Residents speaking Spanish at home - Native, born elsewhere (%)
Residents speaking Spanish at home - Foreign born (%)
Residents speaking other language at home (%)
Residents speaking other language at home - Born in the United States (%)
Residents speaking other language at home - Native, born elsewhere (%)
Residents speaking other language at home - Foreign born (%)
Marital status - Never married (%)
Marital status - Now married (%)
Marital status - Separated (%)
Marital status - Widowed (%)
Marital status - Divorced (%)
Ancestries Reported - Arab (%)
Ancestries Reported - Czech (%)
Ancestries Reported - Danish (%)
Ancestries Reported - Dutch (%)
Ancestries Reported - English (%)
Ancestries Reported - French (%)
Ancestries Reported - French Canadian (%)
Ancestries Reported - German (%)
Ancestries Reported - Greek (%)
Ancestries Reported - Hungarian (%)
Ancestries Reported - Irish (%)
Ancestries Reported - Italian (%)
Ancestries Reported - Lithuanian (%)
Ancestries Reported - Norwegian (%)
Ancestries Reported - Polish (%)
Ancestries Reported - Portuguese (%)
Ancestries Reported - Russian (%)
Ancestries Reported - Scotch-Irish (%)
Ancestries Reported - Scottish (%)
Ancestries Reported - Slovak (%)
Ancestries Reported - Subsaharan African (%)
Ancestries Reported - Swedish (%)
Ancestries Reported - Swiss (%)
Ancestries Reported - Ukrainian (%)
Ancestries Reported - United States (%)
Ancestries Reported - Welsh (%)
Ancestries Reported - West Indian (%)
Ancestries Reported - Other (%)
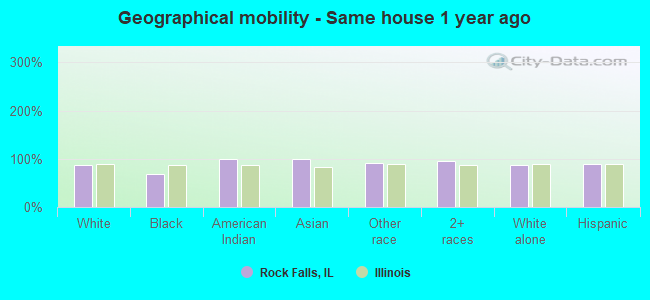
Geographical mobility - Same house 1 year ago (%)
Geographical mobility - Same house 1 year ago (%) - White
Geographical mobility - Same house 1 year ago (%) - Black or African American
Geographical mobility - Same house 1 year ago (%) - Asian
Geographical mobility - Same house 1 year ago (%) - Hispanic or Latino
Geographical mobility - Same house 1 year ago (%) - American Indian and Alaska Native
Geographical mobility - Same house 1 year ago (%) - Multirace
Geographical mobility - Same house 1 year ago (%) - Other Race
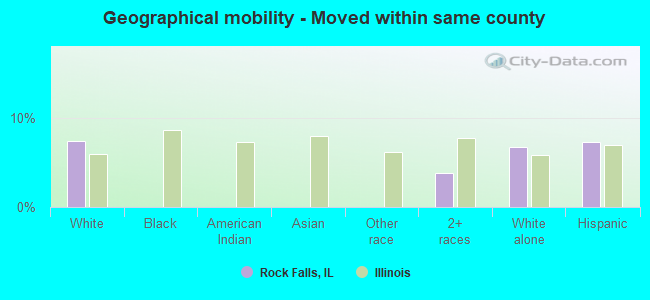
Geographical mobility - Moved within same county (%)
Geographical mobility - Moved within same county (%) - White
Geographical mobility - Moved within same county (%) - Black or African American
Geographical mobility - Moved within same county (%) - Asian
Geographical mobility - Moved within same county (%) - Hispanic or Latino
Geographical mobility - Moved within same county (%) - American Indian and Alaska Native
Geographical mobility - Moved within same county (%) - Multirace
Geographical mobility - Moved within same county (%) - Other Race
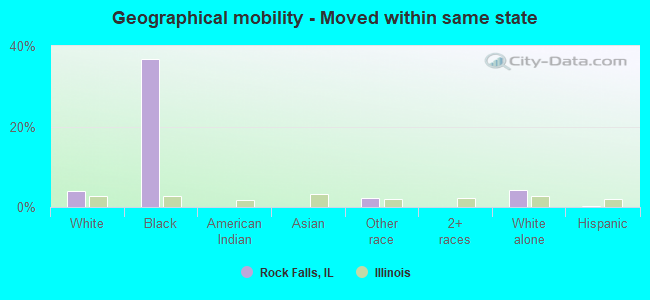
Geographical mobility - Moved from different county within same state (%)
Geographical mobility - Moved from different county within same state (%) - White
Geographical mobility - Moved from different county within same state (%) - Black or African American
Geographical mobility - Moved from different county within same state (%) - Asian
Geographical mobility - Moved from different county within same state (%) - Hispanic or Latino
Geographical mobility - Moved from different county within same state (%) - American Indian and Alaska Native
Geographical mobility - Moved from different county within same state (%) - Multirace
Geographical mobility - Moved from different county within same state (%) - Other Race
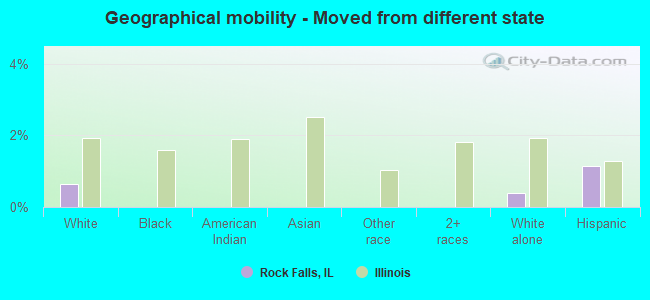
Geographical mobility - Moved from different state (%)
Geographical mobility - Moved from different state (%) - White
Geographical mobility - Moved from different state (%) - Black or African American
Geographical mobility - Moved from different state (%) - Asian
Geographical mobility - Moved from different state (%) - Hispanic or Latino
Geographical mobility - Moved from different state (%) - American Indian and Alaska Native
Geographical mobility - Moved from different state (%) - Multirace
Geographical mobility - Moved from different state (%) - Other Race
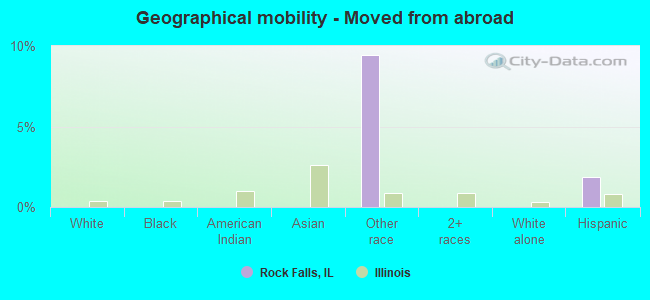
Geographical mobility - Moved from abroad (%)
Geographical mobility - Moved from abroad (%) - White
Geographical mobility - Moved from abroad (%) - Black or African American
Geographical mobility - Moved from abroad (%) - Asian
Geographical mobility - Moved from abroad (%) - Hispanic or Latino
Geographical mobility - Moved from abroad (%) - American Indian and Alaska Native
Geographical mobility - Moved from abroad (%) - Multirace
Geographical mobility - Moved from abroad (%) - Other Race
Place of birth for the foreign-born population - Ireland (%)
Place of birth for the foreign-born population - Denmark (%)
Place of birth for the foreign-born population - Norway (%)
Place of birth for the foreign-born population - Sweden (%)
Place of birth for the foreign-born population - United Kingdom (%)
Place of birth for the foreign-born population - England (%)
Place of birth for the foreign-born population - Scotland (%)
Place of birth for the foreign-born population - Other Northern Europe (%)
Place of birth for the foreign-born population - Austria (%)
Place of birth for the foreign-born population - Belgium (%)
Place of birth for the foreign-born population - France (%)
Place of birth for the foreign-born population - Germany (%)
Place of birth for the foreign-born population - Netherlands (%)
Place of birth for the foreign-born population - Switzerland (%)
Place of birth for the foreign-born population - Other Western Europe (%)
Place of birth for the foreign-born population - Greece (%)
Place of birth for the foreign-born population - Italy (%)
Place of birth for the foreign-born population - Portugal (%)
Place of birth for the foreign-born population - Spain (%)
Place of birth for the foreign-born population - Other Southern Europe (%)
Place of birth for the foreign-born population - Albania (%)
Place of birth for the foreign-born population - Belarus (%)
Place of birth for the foreign-born population - Bosnia and Herzegovina (%)
Place of birth for the foreign-born population - Bulgaria (%)
Place of birth for the foreign-born population - Croatia (%)
Place of birth for the foreign-born population - Czechoslovakia (%)
Place of birth for the foreign-born population - Hungary (%)
Place of birth for the foreign-born population - Latvia (%)
Place of birth for the foreign-born population - Lithuania (%)
Place of birth for the foreign-born population - North Macedonia (Macedonia) (%)
Place of birth for the foreign-born population - Moldova (%)
Place of birth for the foreign-born population - Poland (%)
Place of birth for the foreign-born population - Romania (%)
Place of birth for the foreign-born population - Russia (%)
Place of birth for the foreign-born population - Serbia (%)
Place of birth for the foreign-born population - Ukraine (%)
Place of birth for the foreign-born population - Other Eastern Europe (%)
Place of birth for the foreign-born population - China (%)
Place of birth for the foreign-born population - Hong Kong (%)
Place of birth for the foreign-born population - Taiwan (%)
Place of birth for the foreign-born population - Japan (%)
Place of birth for the foreign-born population - Korea (%)
Place of birth for the foreign-born population - Other Eastern Asia (%)
Place of birth for the foreign-born population - Afghanistan (%)
Place of birth for the foreign-born population - Bangladesh (%)
Place of birth for the foreign-born population - India (%)
Place of birth for the foreign-born population - Iran (%)
Place of birth for the foreign-born population - Kazakhstan (%)
Place of birth for the foreign-born population - Nepal (%)
Place of birth for the foreign-born population - Pakistan (%)
Place of birth for the foreign-born population - Sri Lanka (%)
Place of birth for the foreign-born population - Uzbekistan (%)
Place of birth for the foreign-born population - Other South Central Asia (%)
Place of birth for the foreign-born population - Burma (%)
Place of birth for the foreign-born population - Cambodia (%)
Place of birth for the foreign-born population - Indonesia (%)
Place of birth for the foreign-born population - Laos (%)
Place of birth for the foreign-born population - Malaysia (%)
Place of birth for the foreign-born population - Philippines (%)
Place of birth for the foreign-born population - Singapore (%)
Place of birth for the foreign-born population - Thailand (%)
Place of birth for the foreign-born population - Vietnam (%)
Place of birth for the foreign-born population - Other South Eastern Asia (%)
Place of birth for the foreign-born population - Armenia (%)
Place of birth for the foreign-born population - Iraq (%)
Place of birth for the foreign-born population - Israel (%)
Place of birth for the foreign-born population - Jordan (%)
Place of birth for the foreign-born population - Kuwait (%)
Place of birth for the foreign-born population - Lebanon (%)
Place of birth for the foreign-born population - Saudi Arabia (%)
Place of birth for the foreign-born population - Syria (%)
Place of birth for the foreign-born population - Turkey (%)
Place of birth for the foreign-born population - Yemen (%)
Place of birth for the foreign-born population - Other Western Asia (%)
Place of birth for the foreign-born population - Eritrea (%)
Place of birth for the foreign-born population - Ethiopia (%)
Place of birth for the foreign-born population - Kenya (%)
Place of birth for the foreign-born population - Somalia (%)
Place of birth for the foreign-born population - Uganda (%)
Place of birth for the foreign-born population - Zimbabwe (%)
Place of birth for the foreign-born population - Other Eastern Africa (%)
Place of birth for the foreign-born population - Cameroon (%)
Place of birth for the foreign-born population - Congo (%)
Place of birth for the foreign-born population - Democratic Republic of Congo (Zaire) (%)
Place of birth for the foreign-born population - Other Middle Africa (%)
Place of birth for the foreign-born population - Egypt (%)
Place of birth for the foreign-born population - Morocco (%)
Place of birth for the foreign-born population - Sudan (%)
Place of birth for the foreign-born population - Other Northern Africa (%)
Place of birth for the foreign-born population - South Africa (%)
Place of birth for the foreign-born population - Other Southern Africa (%)
Place of birth for the foreign-born population - Cabo Verde (%)
Place of birth for the foreign-born population - Ghana (%)
Place of birth for the foreign-born population - Liberia (%)
Place of birth for the foreign-born population - Nigeria (%)
Place of birth for the foreign-born population - Senegal (%)
Place of birth for the foreign-born population - Sierra Leone (%)
Place of birth for the foreign-born population - Other Western Africa (%)
Place of birth for the foreign-born population - Australia (%)
Place of birth for the foreign-born population - New Zealand (%)
Place of birth for the foreign-born population - Fiji (%)
Place of birth for the foreign-born population - Micronesia (%)
Place of birth for the foreign-born population - Bahamas (%)
Place of birth for the foreign-born population - Barbados (%)
Place of birth for the foreign-born population - Cuba (%)
Place of birth for the foreign-born population - Dominica (%)
Place of birth for the foreign-born population - Dominican Republic (%)
Place of birth for the foreign-born population - Grenada (%)
Place of birth for the foreign-born population - Haiti (%)
Place of birth for the foreign-born population - Jamaica (%)
Place of birth for the foreign-born population - St. Vincent and the Grenadines (%)
Place of birth for the foreign-born population - Trinidad and Tobago (%)
Place of birth for the foreign-born population - West Indies (%)
Place of birth for the foreign-born population - Other Caribbean (%)
Place of birth for the foreign-born population - Belize (%)
Place of birth for the foreign-born population - Costa Rica (%)
Place of birth for the foreign-born population - El Salvador (%)
Place of birth for the foreign-born population - Guatemala (%)
Place of birth for the foreign-born population - Honduras (%)
Place of birth for the foreign-born population - Mexico (%)
Place of birth for the foreign-born population - Nicaragua (%)
Place of birth for the foreign-born population - Panama (%)
Place of birth for the foreign-born population - Other Central America (%)
Place of birth for the foreign-born population - Argentina (%)
Place of birth for the foreign-born population - Bolivia (%)
Place of birth for the foreign-born population - Brazil (%)
Place of birth for the foreign-born population - Chile (%)
Place of birth for the foreign-born population - Colombia (%)
Place of birth for the foreign-born population - Ecuador (%)
Place of birth for the foreign-born population - Guyana (%)
Place of birth for the foreign-born population - Peru (%)
Place of birth for the foreign-born population - Uruguay (%)
Place of birth for the foreign-born population - Venezuela (%)
Place of birth for the foreign-born population - Other South America (%)
Place of birth for the foreign-born population - Canada (%)
Place of birth for the foreign-born population - Other Northern America (%)
Place of birth for the foreign-born population - Other (%)
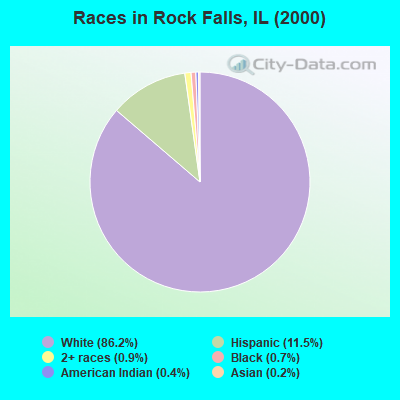
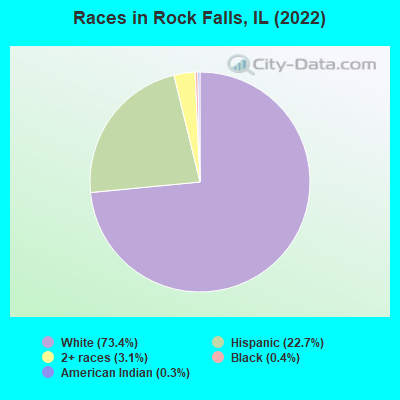
According to 2022 data, the most numerous races in Rock Falls, IL are White alone (6,446 residents), Hispanic (1,991 residents), and Black alone (32 residents). 87.9% of Rock Falls residents speak English at home. 3.7% of Rock Falls, IL residents are foreign-born (3.2% born in Latin America), which is 275.9% less than the foreign-born rate of 14.0% across the entire state of Illinois.
Race distribution in Rock Falls
2000 2022
8,424,140 67.8% White alone 1,856,152 14.9% Black alone 1,530,262 12.3% Hispanic 419,916 3.4% Asian alone 153,996 1.2% Two or more races 13,479 0.1% Other race alone 18,232 0.1% American Indian alone 3,116 0.03% Native Hawaiian and Other
7,356,301 58.5% White alone 2,299,726 18.3% Hispanic 1,660,423 13.2% Black alone 747,296 5.9% Asian alone 458,599 3.6% Two or more races 45,386 0.4% Other race alone 10,405 0.08% American Indian alone 3,896 0.03% Native Hawaiian and Other
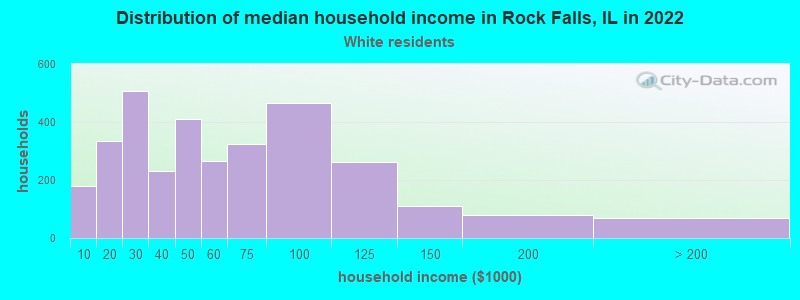
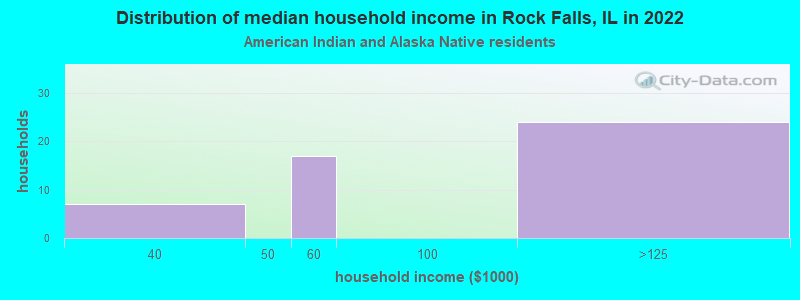
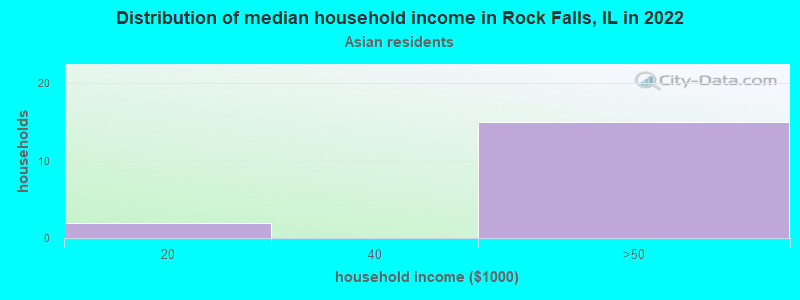
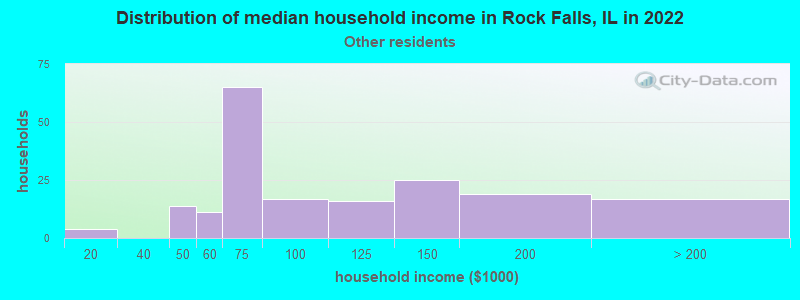
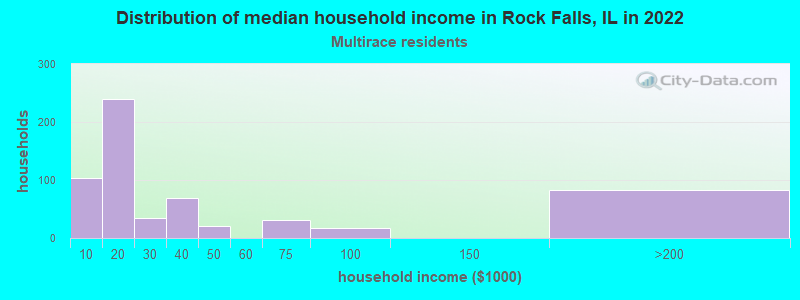
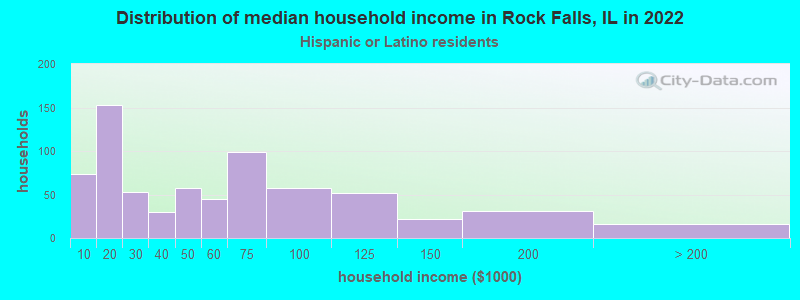
Income and house value in Rock Falls Median household income in 2022 $46,467 White non-Hispanic householders$18,934 Two or more races householders$50,179 Hispanic or Latino race householdersMedian 2022 house value $87,376 White Non-Hispanic householders$90,437 American Indian or Alaska Native householders$93,915 Some other race householders$86,959 Two or more races householders$87,376 Hispanic or Latino householders
Median age by race in Rock Falls
41.8 Median age for White residents38.4 45.6 37.5 Median age for Black or African American residents25.2 38.2 67.2 Median age for American Indian / Alaska Native residents-720,238,094.5 -688,956,432.9 -684,491,977.9 Median age for Asian residents-684,981,684.3 -682,291,666.0 -593,236,714.4 Median age for Native Hawaiian / Pacific Islander residents-658,536,584.7 -576,015,108.0 42.5 Median age for Other race residents40.3 60.9 30.2 Median age for Two or more races residents27.5 32.7 46.2 Median age for White alone residents41.1 47.9 26.1 Median age for Hispanic or Latino residents26.2 25.9
Owner/renter occupied households by race in Rock Falls
House owners and renters - White residents 2,224 68.5% Owner occupied1,022 31.5% Renter occupiedHouse owners and renters - Black or African American residents 10 100.0% Renter occupiedHouse owners and renters - American Indian / Alaska Native residents 32 61.6% Owner occupied20 38.4% Renter occupiedHouse owners and renters - Asian residents 18 90.5% Owner occupied2 9.5% Renter occupiedHouse owners and renters - Other race residents 134 71.0% Owner occupied55 29.0% Renter occupiedHouse owners and renters - Two or more races residents 230 40.6% Owner occupied336 59.4% Renter occupiedHouse owners and renters - White alone residents 2,208 68.9% Owner occupied995 31.1% Renter occupiedHouse owners and renters - Hispanic or Latino residents 309 46.2% Owner occupied361 53.8% Renter occupied
Language usage in Rock Falls
English speakers - Total 87.9% of residents of Rock Falls speak English at home.
11.2% of residents speak Spanish at home 794 86.7% Speak English very well122 13.3% Speak English less than very well0.4% of residents speak other language at home 19 54.3% Speak English very well16 45.7% Speak English less than very well
English speakers - Born in the United States 89.7% of residents of Rock Falls speak English at home.
9.0% of residents speak Spanish at home 90 94.7% Speak English very well5 5.3% Speak English less than very well0.9% of residents speak other language at home 9 100.0% Speak English very well
English speakers - Native, born elsewhere 36.4% of residents of Rock Falls speak English at home.
63.6% of residents speak Spanish at home 28 100.0% Speak English very well
English speakers - Foreign-born 7.9% of residents of Rock Falls speak English at home.
83.8% of residents speak Spanish at home 163 59.3% Speak English very well112 40.7% Speak English less than very well7.6% of residents speak other language at home 9 36.0% Speak English very well16 64.0% Speak English less than very well
White (Caucasian) - Speak only English Native:
99.6% (6,326)Foreign-born:
23.0% (9)
White (Caucasian) - Speak another language Native:
1.8% (117)Foreign-born:
77.6% (31)
Other race - Speak only English Native:
80.0% (97)Foreign-born:
7.4% (18)
Other race - Speak another language Native:
25.6% (31)Foreign-born:
92.6% (223)
Two or more races - Speak another language Native:
46.9% (661)Foreign-born:
100.0% (100)
White alone - Speak only English Native:
98.8% (5,983)Foreign-born:
28.4% (10)
White alone - Speak another language Native:
1.1% (69)Foreign-born:
70.7% (25)
Hispanic or Latino - Speak only English Native:
60.4% (878)Foreign-born:
5.1% (15)
Hispanic or Latino - Speak another language Native:
40.7% (591)Foreign-born:
95.0% (278)
Foreign-born residents in Rock Falls 327 residents are foreign born (3.2% Latin America ).
This city:
3.7%Illinois:
14.1%
Marital status for residents in Rock Falls Marital status - White (Caucasian) population 15 years and over
Males 45.3% Never married36.3% Now married0.8% Separated5.2% Widowed12.5% DivorcedFemales 30.0% Never married33.7% Now married0.6% Separated11.0% Widowed24.6% DivorcedWomen who gave birth in the past 12 months Now married:
41.5% (46)Unmarried:
58.5% (64)
Women who did not give birth in the past 12 months Now married:
30.5% (419)Unmarried:
69.5% (953)
Marital status - Black or African American population 15 years and over
Males 100.0% Never married0.0% Now married0.0% Separated0.0% Widowed0.0% DivorcedFemales 58.3% Never married41.7% Now married0.0% Separated0.0% Widowed0.0% DivorcedWomen who did not give birth in the past 12 months Now married:
47.6% (9)Unmarried:
52.4% (10)
Marital status - American Indian / Alaska Native population 15 years and over
Males 0.0% Never married68.4% Now married0.0% Separated31.6% Widowed0.0% DivorcedFemales 100.0% Never married0.0% Now married0.0% Separated0.0% Widowed0.0% DivorcedMarital status - Other race population 15 years and over
Males 27.6% Never married59.1% Now married0.0% Separated0.0% Widowed13.3% DivorcedFemales 22.1% Never married58.7% Now married0.0% Separated13.5% Widowed5.8% DivorcedWomen who did not give birth in the past 12 months Now married:
47.7% (24)Unmarried:
52.3% (27)
Marital status - Two or more races population 15 years and over
Males 34.4% Never married25.3% Now married20.7% Separated0.0% Widowed19.5% DivorcedFemales 36.0% Never married48.0% Now married0.0% Separated0.0% Widowed16.0% DivorcedWomen who did not give birth in the past 12 months Now married:
50.2% (224)Unmarried:
49.8% (222)
Marital status - White alone, not Hispanic / Latino population 15 years and over
Males 46.5% Never married34.3% Now married0.8% Separated5.5% Widowed12.8% DivorcedFemales 27.7% Never married34.2% Now married0.7% Separated11.8% Widowed25.6% DivorcedWomen who gave birth in the past 12 months Now married:
25.8% (24)Unmarried:
74.2% (69)
Women who did not give birth in the past 12 months Now married:
33.0% (424)Unmarried:
67.0% (862)
Marital status - Hispanic or Latino population 15 years and over
Males 26.0% Never married51.8% Now married8.5% Separated1.0% Widowed12.6% DivorcedFemales 39.6% Never married48.1% Now married0.0% Separated2.9% Widowed9.4% DivorcedWomen who gave birth in the past 12 months Now married:
100.0% (26)Unmarried:
0.0% (0)
Women who did not give birth in the past 12 months Now married:
40.5% (202)Unmarried:
59.5% (296)
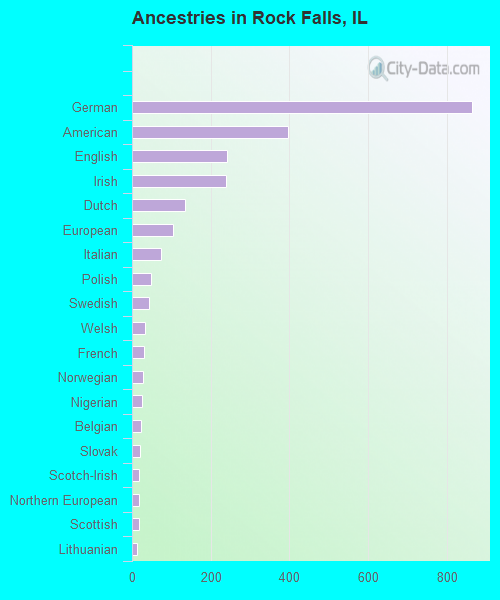
Ancestries in Rock Falls
864 24.1% German396 11.1% American241 6.7% English239 6.7% Irish135 3.8% Dutch104 2.9% European74 2.1% Italian48 1.3% Polish44 1.2% Swedish32 0.9% Welsh30 0.8% French28 0.8% Norwegian26 0.7% Nigerian24 0.7% Belgian21 0.6% Slovak18 0.5% Scotch-Irish17 0.5% Northern European17 0.5% Scottish13 0.4% Lithuanian7 0.2% Pennsylvania German6 0.2% British4 0.1% Romanian1 0.03% African
Children Nativity (place of birth) in Rock Falls
Children under 6 years - Living with two parents Both parents native 291 100.0% NativeChildren under 6 years - Living with one parent Native parent 299 100.0% NativeForeign-born parent 21 100.0% Native
Children 6 to 17 years - Living with two parents Both parents native 439 100.0% NativeBoth parents foreign-born 14 100.0% NativeOne native, one foreign-born parent 73 100.0% NativeChildren 6 to 17 years - Living with one parent Native parent 713 98.9% Native8 1.1% Foreign-bornForeign-born parent 9 100.0% Native
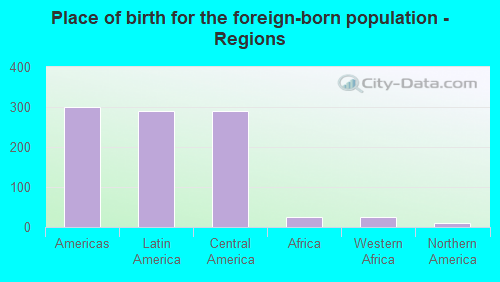
Place of birth for residents in Rock Falls 300 Americas289 Latin America289 Central America25 Africa25 Western Africa11 Northern America2 Asia2 Eastern Asia
Grandparents responsible for own grandchildren in Rock Falls
Grandparents (30 to 59 years) White / Caucasian 31 100.0% Responsible for grandchildrenWhite alone, not Hispanic / Latino 34 100.0% Responsible for grandchildrenGrandparents (60 years and over) White / Caucasian 35 51.8% Responsible for grandchildren33 48.2% Not responsible for grandchildrenWhite alone, not Hispanic / Latino 38 50.6% Responsible for grandchildren37 49.4% Not responsible for grandchildren