Races in Robinson Township, Pennsylvania (PA) Detailed Stats
Ancestries, Foreign-born residents, place of birth

Recent posts about races in Robinson Township, Pennsylvania on our local forum with over 2,400,000 registered users:
 | Pittsburgh MSA municipal population data (2020) (125 replies) |
| Where should I move to in the Pittsburgh Area? (35 replies) |
| Slippery Rock, Pittsburgh Suburb??? (69 replies) |
| Might be moving to Pittsburgh, seeking apartment suggestions (35 replies) |
| Looking at Moon/Robinson (12 replies) |
| Western PA School District Enrollment (6 replies) |
4.2% of Robinson Township, PA residents are foreign-born (2.1% born in Asia, 1.5% born in Europe), which is 66.1% less than the foreign-born rate of 7.0% across the entire state of Pennsylvania.
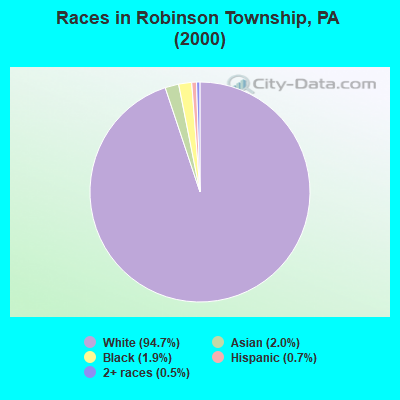
Race distribution in Robinson Township

- 11,64294.7%White alone
- 2482.0%Asian alone
- 2301.9%Black alone
- 900.7%Hispanic
- 660.5%Two or more races
- 70.06%American Indian alone
- 30.02%Other race alone
- 30.02%Native Hawaiian and Other
Pacific Islander alone
2000
2022
-
- 10,322,45584.1%White alone
- 1,202,4379.8%Black alone
- 394,0883.2%Hispanic
- 218,2961.8%Asian alone
- 113,0970.9%Two or more races
- 13,0860.1%Other race alone
- 14,9040.1%American Indian alone
- 2,6910.02%Native Hawaiian and Other
Pacific Islander alone

-
- 9,487,22873.1%White alone
- 1,311,58110.1%Black alone
- 1,115,9978.6%Hispanic
- 493,9423.8%Two or more races
- 487,1243.8%Asian alone
- 63,5820.5%Other race alone
- 10,1300.08%American Indian alone
- 2,4240.02%Native Hawaiian and Other
Pacific Islander alone

Income and house value in Robinson Township
- Median household income in 2022
- $105,710White non-Hispanic householders
- $54,979Black householders
- $20,276American Indian and Alaska Native householders
- $173,810Asian householders
- $172,762Some other race householders
- $181,298Two or more races householders
- $154,913Hispanic or Latino race householders
- Median 2022 house value
- $348,082White Non-Hispanic householders
- $116,292Black or African American householders
- $73,014American Indian or Alaska Native householders
- over $1,000,000Asian householders
- $365,074Two or more races householders
- $119,479Hispanic or Latino householders
Household income for White non-Hispanic householders

Household income for Black householders

Household income for American Indian and Alaska Native householders

Household income for Asian householders

Household income for Two or more races householders

Household income for Hispanic or Latino race householders

Foreign-born residents in Robinson Township
518 residents are foreign born (2.1% Asia, 1.5% Europe).
| This city: | 4.2% |
| Pennsylvania: | 4.1% |
Ancestries in Robinson Township

- 3,39321.2%German
- 2,62516.4%Italian
- 2,51315.7%Irish
- 1,60710.1%Other
- 1,3248.3%Polish
- 9876.2%English
- 5873.7%Slovak
- 3852.4%United States
- 3242.0%Scotch-Irish
- 3192.0%Ukrainian
- 2811.8%Czech
- 2701.7%Russian
- 2251.4%Hungarian
- 1951.2%Scottish
- 1901.2%French
- 1250.8%Welsh
- 1090.7%Swedish
- 1080.7%Lithuanian
- 1000.6%Greek
- 990.6%Dutch
- 650.4%Swiss
- 580.4%Arab
- 290.2%Subsaharan African
- 270.2%Norwegian
- 100.06%French Canadian
- 90.06%Portuguese
- 80.05%West Indian

Zip codes: 15136.