Races in Riverdale, Georgia (GA) Detailed Stats
Data:
Races - White alone (%)
Races - White alone (% change since 2000)
Races - Black alone (%)
Races - Black alone (% change since 2000)
Races - American Indian alone (%)
Races - American Indian alone (% change since 2000)
Races - Asian alone (%)
Races - Asian alone (% change since 2000)
Races - Hispanic (%)
Races - Hispanic (% change since 2000)
Races - Native Hawaiian and Other Pacific Islander alone (%)
Races - Native Hawaiian and Other Pacific Islander alone (% change since 2000)
Races - Two or more races(%)
Races - Two or more races(% change since 2000)
Races - Other race alone (%)
Races - Other race alone (% change since 2000)
Racial diversity
Place of birth - Born in state of residence (%)
Place of birth - Born in state of residence (%) - White
Place of birth - Born in state of residence (%) - Black or African American
Place of birth - Born in state of residence (%) - Asian
Place of birth - Born in state of residence (%) - Hispanic or Latino
Place of birth - Born in state of residence (%) - American Indian and Alaska Native
Place of birth - Born in state of residence (%) - Multirace
Place of birth - Born in state of residence (%) - Other Race
Place of birth - Born in other state (%)
Place of birth - Born in other state (%) - White
Place of birth - Born in other state (%) - Black or African American
Place of birth - Born in other state (%) - Asian
Place of birth - Born in other state (%) - Hispanic or Latino
Place of birth - Born in other state (%) - American Indian and Alaska Native
Place of birth - Born in other state (%) - Multirace
Place of birth - Born in other state (%) - Other Race
Place of birth - Native, outside of US (%)
Place of birth - Native, outside of US (%) - White
Place of birth - Native, outside of US (%) - Black or African American
Place of birth - Native, outside of US (%) - Asian
Place of birth - Native, outside of US (%) - Hispanic or Latino
Place of birth - Native, outside of US (%) - American Indian and Alaska Native
Place of birth - Native, outside of US (%) - Multirace
Place of birth - Native, outside of US (%) - Other Race
Place of birth - Foreign born (%)
Place of birth - Foreign born (%) - White
Place of birth - Foreign born (%) - Black or African American
Place of birth - Foreign born (%) - Asian
Place of birth - Foreign born (%) - Hispanic or Latino
Place of birth - Foreign born (%) - American Indian and Alaska Native
Place of birth - Foreign born (%) - Multirace
Place of birth - Foreign born (%) - Other Race
Residents speaking English at home (%)
Residents speaking English at home - Born in the United States (%)
Residents speaking English at home - Native, born elsewhere (%)
Residents speaking English at home - Foreign born (%)
Residents speaking Spanish at home (%)
Residents speaking Spanish at home - Born in the United States (%)
Residents speaking Spanish at home - Native, born elsewhere (%)
Residents speaking Spanish at home - Foreign born (%)
Residents speaking other language at home (%)
Residents speaking other language at home - Born in the United States (%)
Residents speaking other language at home - Native, born elsewhere (%)
Residents speaking other language at home - Foreign born (%)
Marital status - Never married (%)
Marital status - Now married (%)
Marital status - Separated (%)
Marital status - Widowed (%)
Marital status - Divorced (%)
Ancestries Reported - Arab (%)
Ancestries Reported - Czech (%)
Ancestries Reported - Danish (%)
Ancestries Reported - Dutch (%)
Ancestries Reported - English (%)
Ancestries Reported - French (%)
Ancestries Reported - French Canadian (%)
Ancestries Reported - German (%)
Ancestries Reported - Greek (%)
Ancestries Reported - Hungarian (%)
Ancestries Reported - Irish (%)
Ancestries Reported - Italian (%)
Ancestries Reported - Lithuanian (%)
Ancestries Reported - Norwegian (%)
Ancestries Reported - Polish (%)
Ancestries Reported - Portuguese (%)
Ancestries Reported - Russian (%)
Ancestries Reported - Scotch-Irish (%)
Ancestries Reported - Scottish (%)
Ancestries Reported - Slovak (%)
Ancestries Reported - Subsaharan African (%)
Ancestries Reported - Swedish (%)
Ancestries Reported - Swiss (%)
Ancestries Reported - Ukrainian (%)
Ancestries Reported - United States (%)
Ancestries Reported - Welsh (%)
Ancestries Reported - West Indian (%)
Ancestries Reported - Other (%)
Geographical mobility - Same house 1 year ago (%)
Geographical mobility - Same house 1 year ago (%) - White
Geographical mobility - Same house 1 year ago (%) - Black or African American
Geographical mobility - Same house 1 year ago (%) - Asian
Geographical mobility - Same house 1 year ago (%) - Hispanic or Latino
Geographical mobility - Same house 1 year ago (%) - American Indian and Alaska Native
Geographical mobility - Same house 1 year ago (%) - Multirace
Geographical mobility - Same house 1 year ago (%) - Other Race
Geographical mobility - Moved within same county (%)
Geographical mobility - Moved within same county (%) - White
Geographical mobility - Moved within same county (%) - Black or African American
Geographical mobility - Moved within same county (%) - Asian
Geographical mobility - Moved within same county (%) - Hispanic or Latino
Geographical mobility - Moved within same county (%) - American Indian and Alaska Native
Geographical mobility - Moved within same county (%) - Multirace
Geographical mobility - Moved within same county (%) - Other Race
Geographical mobility - Moved from different county within same state (%)
Geographical mobility - Moved from different county within same state (%) - White
Geographical mobility - Moved from different county within same state (%) - Black or African American
Geographical mobility - Moved from different county within same state (%) - Asian
Geographical mobility - Moved from different county within same state (%) - Hispanic or Latino
Geographical mobility - Moved from different county within same state (%) - American Indian and Alaska Native
Geographical mobility - Moved from different county within same state (%) - Multirace
Geographical mobility - Moved from different county within same state (%) - Other Race
Geographical mobility - Moved from different state (%)
Geographical mobility - Moved from different state (%) - White
Geographical mobility - Moved from different state (%) - Black or African American
Geographical mobility - Moved from different state (%) - Asian
Geographical mobility - Moved from different state (%) - Hispanic or Latino
Geographical mobility - Moved from different state (%) - American Indian and Alaska Native
Geographical mobility - Moved from different state (%) - Multirace
Geographical mobility - Moved from different state (%) - Other Race
Geographical mobility - Moved from abroad (%)
Geographical mobility - Moved from abroad (%) - White
Geographical mobility - Moved from abroad (%) - Black or African American
Geographical mobility - Moved from abroad (%) - Asian
Geographical mobility - Moved from abroad (%) - Hispanic or Latino
Geographical mobility - Moved from abroad (%) - American Indian and Alaska Native
Geographical mobility - Moved from abroad (%) - Multirace
Geographical mobility - Moved from abroad (%) - Other Race
Place of birth for the foreign-born population - Ireland (%)
Place of birth for the foreign-born population - Denmark (%)
Place of birth for the foreign-born population - Norway (%)
Place of birth for the foreign-born population - Sweden (%)
Place of birth for the foreign-born population - United Kingdom (%)
Place of birth for the foreign-born population - England (%)
Place of birth for the foreign-born population - Scotland (%)
Place of birth for the foreign-born population - Other Northern Europe (%)
Place of birth for the foreign-born population - Austria (%)
Place of birth for the foreign-born population - Belgium (%)
Place of birth for the foreign-born population - France (%)
Place of birth for the foreign-born population - Germany (%)
Place of birth for the foreign-born population - Netherlands (%)
Place of birth for the foreign-born population - Switzerland (%)
Place of birth for the foreign-born population - Other Western Europe (%)
Place of birth for the foreign-born population - Greece (%)
Place of birth for the foreign-born population - Italy (%)
Place of birth for the foreign-born population - Portugal (%)
Place of birth for the foreign-born population - Spain (%)
Place of birth for the foreign-born population - Other Southern Europe (%)
Place of birth for the foreign-born population - Albania (%)
Place of birth for the foreign-born population - Belarus (%)
Place of birth for the foreign-born population - Bosnia and Herzegovina (%)
Place of birth for the foreign-born population - Bulgaria (%)
Place of birth for the foreign-born population - Croatia (%)
Place of birth for the foreign-born population - Czechoslovakia (%)
Place of birth for the foreign-born population - Hungary (%)
Place of birth for the foreign-born population - Latvia (%)
Place of birth for the foreign-born population - Lithuania (%)
Place of birth for the foreign-born population - North Macedonia (Macedonia) (%)
Place of birth for the foreign-born population - Moldova (%)
Place of birth for the foreign-born population - Poland (%)
Place of birth for the foreign-born population - Romania (%)
Place of birth for the foreign-born population - Russia (%)
Place of birth for the foreign-born population - Serbia (%)
Place of birth for the foreign-born population - Ukraine (%)
Place of birth for the foreign-born population - Other Eastern Europe (%)
Place of birth for the foreign-born population - China (%)
Place of birth for the foreign-born population - Hong Kong (%)
Place of birth for the foreign-born population - Taiwan (%)
Place of birth for the foreign-born population - Japan (%)
Place of birth for the foreign-born population - Korea (%)
Place of birth for the foreign-born population - Other Eastern Asia (%)
Place of birth for the foreign-born population - Afghanistan (%)
Place of birth for the foreign-born population - Bangladesh (%)
Place of birth for the foreign-born population - India (%)
Place of birth for the foreign-born population - Iran (%)
Place of birth for the foreign-born population - Kazakhstan (%)
Place of birth for the foreign-born population - Nepal (%)
Place of birth for the foreign-born population - Pakistan (%)
Place of birth for the foreign-born population - Sri Lanka (%)
Place of birth for the foreign-born population - Uzbekistan (%)
Place of birth for the foreign-born population - Other South Central Asia (%)
Place of birth for the foreign-born population - Burma (%)
Place of birth for the foreign-born population - Cambodia (%)
Place of birth for the foreign-born population - Indonesia (%)
Place of birth for the foreign-born population - Laos (%)
Place of birth for the foreign-born population - Malaysia (%)
Place of birth for the foreign-born population - Philippines (%)
Place of birth for the foreign-born population - Singapore (%)
Place of birth for the foreign-born population - Thailand (%)
Place of birth for the foreign-born population - Vietnam (%)
Place of birth for the foreign-born population - Other South Eastern Asia (%)
Place of birth for the foreign-born population - Armenia (%)
Place of birth for the foreign-born population - Iraq (%)
Place of birth for the foreign-born population - Israel (%)
Place of birth for the foreign-born population - Jordan (%)
Place of birth for the foreign-born population - Kuwait (%)
Place of birth for the foreign-born population - Lebanon (%)
Place of birth for the foreign-born population - Saudi Arabia (%)
Place of birth for the foreign-born population - Syria (%)
Place of birth for the foreign-born population - Turkey (%)
Place of birth for the foreign-born population - Yemen (%)
Place of birth for the foreign-born population - Other Western Asia (%)
Place of birth for the foreign-born population - Eritrea (%)
Place of birth for the foreign-born population - Ethiopia (%)
Place of birth for the foreign-born population - Kenya (%)
Place of birth for the foreign-born population - Somalia (%)
Place of birth for the foreign-born population - Uganda (%)
Place of birth for the foreign-born population - Zimbabwe (%)
Place of birth for the foreign-born population - Other Eastern Africa (%)
Place of birth for the foreign-born population - Cameroon (%)
Place of birth for the foreign-born population - Congo (%)
Place of birth for the foreign-born population - Democratic Republic of Congo (Zaire) (%)
Place of birth for the foreign-born population - Other Middle Africa (%)
Place of birth for the foreign-born population - Egypt (%)
Place of birth for the foreign-born population - Morocco (%)
Place of birth for the foreign-born population - Sudan (%)
Place of birth for the foreign-born population - Other Northern Africa (%)
Place of birth for the foreign-born population - South Africa (%)
Place of birth for the foreign-born population - Other Southern Africa (%)
Place of birth for the foreign-born population - Cabo Verde (%)
Place of birth for the foreign-born population - Ghana (%)
Place of birth for the foreign-born population - Liberia (%)
Place of birth for the foreign-born population - Nigeria (%)
Place of birth for the foreign-born population - Senegal (%)
Place of birth for the foreign-born population - Sierra Leone (%)
Place of birth for the foreign-born population - Other Western Africa (%)
Place of birth for the foreign-born population - Australia (%)
Place of birth for the foreign-born population - New Zealand (%)
Place of birth for the foreign-born population - Fiji (%)
Place of birth for the foreign-born population - Micronesia (%)
Place of birth for the foreign-born population - Bahamas (%)
Place of birth for the foreign-born population - Barbados (%)
Place of birth for the foreign-born population - Cuba (%)
Place of birth for the foreign-born population - Dominica (%)
Place of birth for the foreign-born population - Dominican Republic (%)
Place of birth for the foreign-born population - Grenada (%)
Place of birth for the foreign-born population - Haiti (%)
Place of birth for the foreign-born population - Jamaica (%)
Place of birth for the foreign-born population - St. Vincent and the Grenadines (%)
Place of birth for the foreign-born population - Trinidad and Tobago (%)
Place of birth for the foreign-born population - West Indies (%)
Place of birth for the foreign-born population - Other Caribbean (%)
Place of birth for the foreign-born population - Belize (%)
Place of birth for the foreign-born population - Costa Rica (%)
Place of birth for the foreign-born population - El Salvador (%)
Place of birth for the foreign-born population - Guatemala (%)
Place of birth for the foreign-born population - Honduras (%)
Place of birth for the foreign-born population - Mexico (%)
Place of birth for the foreign-born population - Nicaragua (%)
Place of birth for the foreign-born population - Panama (%)
Place of birth for the foreign-born population - Other Central America (%)
Place of birth for the foreign-born population - Argentina (%)
Place of birth for the foreign-born population - Bolivia (%)
Place of birth for the foreign-born population - Brazil (%)
Place of birth for the foreign-born population - Chile (%)
Place of birth for the foreign-born population - Colombia (%)
Place of birth for the foreign-born population - Ecuador (%)
Place of birth for the foreign-born population - Guyana (%)
Place of birth for the foreign-born population - Peru (%)
Place of birth for the foreign-born population - Uruguay (%)
Place of birth for the foreign-born population - Venezuela (%)
Place of birth for the foreign-born population - Other South America (%)
Place of birth for the foreign-born population - Canada (%)
Place of birth for the foreign-born population - Other Northern America (%)
Place of birth for the foreign-born population - Other (%)
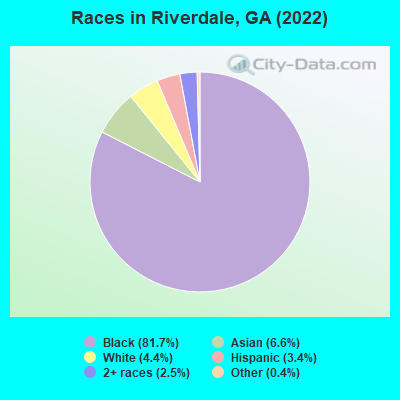
According to 2022 data, the most numerous races in Riverdale, GA are White alone (654 residents), Black alone (12,208 residents), and Hispanic (505 residents). 82.8% of Riverdale residents speak English at home. 14.1% of Riverdale, GA residents are foreign-born (5.6% born in Africa, 5.0% born in Asia, 2.8% born in Latin America), which is 29.1% greater than the foreign-born rate of 10.0% across the entire state of Georgia.
Race distribution in Riverdale
2000 2022
5,128,661 62.6% White alone 2,331,465 28.5% Black alone 435,227 5.3% Hispanic 171,513 2.1% Asian alone 87,364 1.1% Two or more races 17,670 0.2% American Indian alone 11,275 0.1% Other race alone 3,278 0.04% Native Hawaiian and Other
5,415,657 49.6% White alone 3,349,240 30.7% Black alone 1,132,604 10.4% Hispanic 479,156 4.4% Asian alone 462,923 4.2% Two or more races 54,416 0.5% Other race alone 11,923 0.1% American Indian alone 6,957 0.06% Native Hawaiian and Other
Income and house value in Riverdale Median household income in 2022 $27,215 White non-Hispanic householders$62,704 Black householders$169,373 Asian householdersover $200,000 Some other race householders$79,098 Two or more races householders$53,199 Hispanic or Latino race householdersMedian 2022 house value $172,529 White Non-Hispanic householders$208,930 Black or African American householders $193,206 Asian householders$218,407 Some other race householders$190,191 Two or more races householders$189,545 Hispanic or Latino householders
Median age by race in Riverdale
47.7 Median age for White residents30.8 62.7 37.3 Median age for Black or African American residents32.2 40.0 -566,666,666.1 Median age for American Indian / Alaska Native residents-560,327,197.8 -508,361,203.5 60.7 Median age for Asian residents63.2 59.1 -657,243,815.6 Median age for Native Hawaiian / Pacific Islander residents-693,227,090.9 -776,776,776.0 35.4 Median age for Other race residents-671,462,829.1 -605,087,014.1 25.0 Median age for Two or more races residents23.9 28.3 53.5 Median age for White alone residents25.5 59.2 25.0 Median age for Hispanic or Latino residents14.1 27.1
Owner/renter occupied households by race in Riverdale
House owners and renters - White residents 156 62.2% Owner occupied95 37.8% Renter occupiedHouse owners and renters - Black or African American residents 2,458 50.3% Owner occupied2,433 49.7% Renter occupiedHouse owners and renters - American Indian / Alaska Native residents 4 100.0% Owner occupiedHouse owners and renters - Asian residents 508 95.6% Owner occupied23 4.4% Renter occupiedHouse owners and renters - Other race residents 26 36.7% Owner occupied44 63.3% Renter occupiedHouse owners and renters - Two or more races residents 126 70.7% Owner occupied52 29.3% Renter occupiedHouse owners and renters - White alone residents 167 64.0% Owner occupied94 36.0% Renter occupiedHouse owners and renters - Hispanic or Latino residents 54 23.8% Owner occupied174 76.2% Renter occupied
Language usage in Riverdale
English speakers - Total 82.8% of residents of Riverdale speak English at home.
2.8% of residents speak Spanish at home 249 64.5% Speak English very well137 35.5% Speak English less than very well15.0% of residents speak other language at home 1,067 51.0% Speak English very well1,024 49.0% Speak English less than very well
English speakers - Born in the United States 93.1% of residents of Riverdale speak English at home.
4.5% of residents speak Spanish at home 152 71.4% Speak English very well61 28.6% Speak English less than very well0.5% of residents speak other language at home 23 100.0% Speak English very well
English speakers - Native, born elsewhere 83.7% of residents of Riverdale speak English at home.
21.6% of residents speak other language at home 53 100.0% Speak English very well
English speakers - Foreign-born 25.3% of residents of Riverdale speak English at home.
5.8% of residents speak Spanish at home 87 66.4% Speak English very well44 33.6% Speak English less than very well70.7% of residents speak other language at home 559 35.2% Speak English very well1,029 64.8% Speak English less than very well
White (Caucasian) - Speak only English Native:
100.0% (536)Foreign-born:
76.0% (14)
White (Caucasian) - Speak another language Native:
4.9% (26)Foreign-born:
38.6% (7)
Black or African American - Speak only English Native:
95.7% (9,750)Foreign-born:
30.7% (461)
Black or African American - Speak another language Native:
3.7% (374)Foreign-born:
73.4% (1,104)
Asian - Speak only English Native:
52.6% (101)Foreign-born:
1.0% (7)
Asian - Speak another language Native:
49.0% (94)Foreign-born:
95.1% (719)
Other race - Speak another language Native:
28.9% (16)Foreign-born:
93.5% (34)
Two or more races - Speak only English Native:
75.5% (432)Foreign-born:
53.2% (42)
Two or more races - Speak another language Native:
23.5% (134)Foreign-born:
59.6% (47)
White alone - Speak only English Native:
97.9% (598)Foreign-born:
100.0% (15)
Hispanic or Latino - Speak another language Native:
55.4% (174)Foreign-born:
98.9% (166)
Foreign-born residents in Riverdale 2,109 residents are foreign born (5.6% Africa , 5.0% Asia , 2.8% Latin America ).
This city:
14.1%Georgia:
10.4%
Marital status for residents in Riverdale Marital status - White (Caucasian) population 15 years and over
Males 42.1% Never married43.1% Now married0.0% Separated3.7% Widowed11.1% DivorcedFemales 41.7% Never married19.6% Now married5.4% Separated9.7% Widowed23.6% DivorcedWomen who did not give birth in the past 12 months Now married:
14.8% (18)Unmarried:
85.2% (106)
Marital status - Black or African American population 15 years and over
Males 47.6% Never married34.2% Now married2.3% Separated1.7% Widowed14.2% DivorcedFemales 40.8% Never married27.6% Now married5.7% Separated7.9% Widowed18.0% DivorcedWomen who gave birth in the past 12 months Now married:
49.7% (79)Unmarried:
50.3% (80)
Women who did not give birth in the past 12 months Now married:
27.8% (801)Unmarried:
72.2% (2,081)
Marital status - Asian population 15 years and over
Males 16.2% Never married83.8% Now married0.0% Separated0.0% Widowed0.0% DivorcedFemales 10.4% Never married73.2% Now married1.8% Separated11.7% Widowed2.9% DivorcedWomen who did not give birth in the past 12 months Now married:
10.4% (10)Unmarried:
89.6% (87)
Marital status - Other race population 15 years and over
Males 43.3% Never married0.0% Now married0.0% Separated0.0% Widowed56.7% DivorcedFemales 23.5% Never married76.5% Now married0.0% Separated0.0% Widowed0.0% DivorcedWomen who did not give birth in the past 12 months Now married:
100.0% (43)Unmarried:
0.0% (0)
Marital status - Two or more races population 15 years and over
Males 57.1% Never married36.7% Now married6.1% Separated0.0% Widowed0.0% DivorcedFemales 71.3% Never married21.0% Now married0.0% Separated0.0% Widowed7.8% DivorcedWomen who gave birth in the past 12 months Now married:
0.0% (0)Unmarried:
100.0% (8)
Women who did not give birth in the past 12 months Now married:
0.0% (0)Unmarried:
100.0% (190)
Marital status - White alone, not Hispanic / Latino population 15 years and over
Males 40.2% Never married44.5% Now married0.0% Separated3.8% Widowed11.5% DivorcedFemales 36.2% Never married22.5% Now married6.2% Separated8.0% Widowed27.1% DivorcedWomen who did not give birth in the past 12 months Now married:
19.2% (25)Unmarried:
80.8% (106)
Marital status - Hispanic or Latino population 15 years and over
Males 61.8% Never married0.0% Now married13.5% Separated0.0% Widowed24.7% DivorcedFemales 65.7% Never married10.6% Now married15.9% Separated4.9% Widowed2.9% DivorcedWomen who did not give birth in the past 12 months Now married:
32.2% (70)Unmarried:
67.8% (148)
Ancestries in Riverdale
960 9.1% Nigerian299 2.8% African270 2.5% American215 2.0% Jamaican206 1.9% Senegalese49 0.5% Ghanaian48 0.5% Trinidadian and Tobagonian35 0.3% West Indian28 0.3% English27 0.3% Italian17 0.2% German13 0.1% Irish12 0.1% Guyanese8 0.08% Polish6 0.06% Liberian4 0.04% European
Children Nativity (place of birth) in Riverdale
Children under 6 years - Living with two parents Both parents native 264 99.1% Native2 0.9% Foreign-bornBoth parents foreign-born 87 95.8% Native4 4.2% Foreign-bornOne native, one foreign-born parent 75 100.0% NativeChildren under 6 years - Living with one parent Native parent 475 100.0% NativeForeign-born parent 197 100.0% NativeChildren 6 to 17 years - Living with two parents Both parents native 344 100.0% NativeBoth parents foreign-born 97 96.0% Native4 4.0% Foreign-bornOne native, one foreign-born parent 209 70.6% Native87 29.4% Foreign-bornChildren 6 to 17 years - Living with one parent Native parent 841 100.0% NativeForeign-born parent 144 49.8% Native145 50.2% Foreign-born
Grandparents responsible for own grandchildren in Riverdale
Grandparents (30 to 59 years) Black or African American 61 47.6% Responsible for grandchildren67 52.4% Not responsible for grandchildrenTwo or more races 37 100.0% Not responsible for grandchildrenGrandparents (60 years and over) Black or African American 19 9.4% Responsible for grandchildren179 90.6% Not responsible for grandchildrenTwo or more races 1 26.0% Responsible for grandchildren4 74.0% Not responsible for grandchildren