Races in River Forest, Illinois (IL) Detailed Stats
Data:
Races - White alone (%)
Races - White alone (% change since 2000)
Races - Black alone (%)
Races - Black alone (% change since 2000)
Races - American Indian alone (%)
Races - American Indian alone (% change since 2000)
Races - Asian alone (%)
Races - Asian alone (% change since 2000)
Races - Hispanic (%)
Races - Hispanic (% change since 2000)
Races - Native Hawaiian and Other Pacific Islander alone (%)
Races - Native Hawaiian and Other Pacific Islander alone (% change since 2000)
Races - Two or more races(%)
Races - Two or more races(% change since 2000)
Races - Other race alone (%)
Races - Other race alone (% change since 2000)
Racial diversity
Place of birth - Born in state of residence (%)
Place of birth - Born in state of residence (%) - White
Place of birth - Born in state of residence (%) - Black or African American
Place of birth - Born in state of residence (%) - Asian
Place of birth - Born in state of residence (%) - Hispanic or Latino
Place of birth - Born in state of residence (%) - American Indian and Alaska Native
Place of birth - Born in state of residence (%) - Multirace
Place of birth - Born in state of residence (%) - Other Race
Place of birth - Born in other state (%)
Place of birth - Born in other state (%) - White
Place of birth - Born in other state (%) - Black or African American
Place of birth - Born in other state (%) - Asian
Place of birth - Born in other state (%) - Hispanic or Latino
Place of birth - Born in other state (%) - American Indian and Alaska Native
Place of birth - Born in other state (%) - Multirace
Place of birth - Born in other state (%) - Other Race
Place of birth - Native, outside of US (%)
Place of birth - Native, outside of US (%) - White
Place of birth - Native, outside of US (%) - Black or African American
Place of birth - Native, outside of US (%) - Asian
Place of birth - Native, outside of US (%) - Hispanic or Latino
Place of birth - Native, outside of US (%) - American Indian and Alaska Native
Place of birth - Native, outside of US (%) - Multirace
Place of birth - Native, outside of US (%) - Other Race
Place of birth - Foreign born (%)
Place of birth - Foreign born (%) - White
Place of birth - Foreign born (%) - Black or African American
Place of birth - Foreign born (%) - Asian
Place of birth - Foreign born (%) - Hispanic or Latino
Place of birth - Foreign born (%) - American Indian and Alaska Native
Place of birth - Foreign born (%) - Multirace
Place of birth - Foreign born (%) - Other Race
Residents speaking English at home (%)
Residents speaking English at home - Born in the United States (%)
Residents speaking English at home - Native, born elsewhere (%)
Residents speaking English at home - Foreign born (%)
Residents speaking Spanish at home (%)
Residents speaking Spanish at home - Born in the United States (%)
Residents speaking Spanish at home - Native, born elsewhere (%)
Residents speaking Spanish at home - Foreign born (%)
Residents speaking other language at home (%)
Residents speaking other language at home - Born in the United States (%)
Residents speaking other language at home - Native, born elsewhere (%)
Residents speaking other language at home - Foreign born (%)
Marital status - Never married (%)
Marital status - Now married (%)
Marital status - Separated (%)
Marital status - Widowed (%)
Marital status - Divorced (%)
Ancestries Reported - Arab (%)
Ancestries Reported - Czech (%)
Ancestries Reported - Danish (%)
Ancestries Reported - Dutch (%)
Ancestries Reported - English (%)
Ancestries Reported - French (%)
Ancestries Reported - French Canadian (%)
Ancestries Reported - German (%)
Ancestries Reported - Greek (%)
Ancestries Reported - Hungarian (%)
Ancestries Reported - Irish (%)
Ancestries Reported - Italian (%)
Ancestries Reported - Lithuanian (%)
Ancestries Reported - Norwegian (%)
Ancestries Reported - Polish (%)
Ancestries Reported - Portuguese (%)
Ancestries Reported - Russian (%)
Ancestries Reported - Scotch-Irish (%)
Ancestries Reported - Scottish (%)
Ancestries Reported - Slovak (%)
Ancestries Reported - Subsaharan African (%)
Ancestries Reported - Swedish (%)
Ancestries Reported - Swiss (%)
Ancestries Reported - Ukrainian (%)
Ancestries Reported - United States (%)
Ancestries Reported - Welsh (%)
Ancestries Reported - West Indian (%)
Ancestries Reported - Other (%)
Geographical mobility - Same house 1 year ago (%)
Geographical mobility - Same house 1 year ago (%) - White
Geographical mobility - Same house 1 year ago (%) - Black or African American
Geographical mobility - Same house 1 year ago (%) - Asian
Geographical mobility - Same house 1 year ago (%) - Hispanic or Latino
Geographical mobility - Same house 1 year ago (%) - American Indian and Alaska Native
Geographical mobility - Same house 1 year ago (%) - Multirace
Geographical mobility - Same house 1 year ago (%) - Other Race
Geographical mobility - Moved within same county (%)
Geographical mobility - Moved within same county (%) - White
Geographical mobility - Moved within same county (%) - Black or African American
Geographical mobility - Moved within same county (%) - Asian
Geographical mobility - Moved within same county (%) - Hispanic or Latino
Geographical mobility - Moved within same county (%) - American Indian and Alaska Native
Geographical mobility - Moved within same county (%) - Multirace
Geographical mobility - Moved within same county (%) - Other Race
Geographical mobility - Moved from different county within same state (%)
Geographical mobility - Moved from different county within same state (%) - White
Geographical mobility - Moved from different county within same state (%) - Black or African American
Geographical mobility - Moved from different county within same state (%) - Asian
Geographical mobility - Moved from different county within same state (%) - Hispanic or Latino
Geographical mobility - Moved from different county within same state (%) - American Indian and Alaska Native
Geographical mobility - Moved from different county within same state (%) - Multirace
Geographical mobility - Moved from different county within same state (%) - Other Race
Geographical mobility - Moved from different state (%)
Geographical mobility - Moved from different state (%) - White
Geographical mobility - Moved from different state (%) - Black or African American
Geographical mobility - Moved from different state (%) - Asian
Geographical mobility - Moved from different state (%) - Hispanic or Latino
Geographical mobility - Moved from different state (%) - American Indian and Alaska Native
Geographical mobility - Moved from different state (%) - Multirace
Geographical mobility - Moved from different state (%) - Other Race
Geographical mobility - Moved from abroad (%)
Geographical mobility - Moved from abroad (%) - White
Geographical mobility - Moved from abroad (%) - Black or African American
Geographical mobility - Moved from abroad (%) - Asian
Geographical mobility - Moved from abroad (%) - Hispanic or Latino
Geographical mobility - Moved from abroad (%) - American Indian and Alaska Native
Geographical mobility - Moved from abroad (%) - Multirace
Geographical mobility - Moved from abroad (%) - Other Race
Place of birth for the foreign-born population - Ireland (%)
Place of birth for the foreign-born population - Denmark (%)
Place of birth for the foreign-born population - Norway (%)
Place of birth for the foreign-born population - Sweden (%)
Place of birth for the foreign-born population - United Kingdom (%)
Place of birth for the foreign-born population - England (%)
Place of birth for the foreign-born population - Scotland (%)
Place of birth for the foreign-born population - Other Northern Europe (%)
Place of birth for the foreign-born population - Austria (%)
Place of birth for the foreign-born population - Belgium (%)
Place of birth for the foreign-born population - France (%)
Place of birth for the foreign-born population - Germany (%)
Place of birth for the foreign-born population - Netherlands (%)
Place of birth for the foreign-born population - Switzerland (%)
Place of birth for the foreign-born population - Other Western Europe (%)
Place of birth for the foreign-born population - Greece (%)
Place of birth for the foreign-born population - Italy (%)
Place of birth for the foreign-born population - Portugal (%)
Place of birth for the foreign-born population - Spain (%)
Place of birth for the foreign-born population - Other Southern Europe (%)
Place of birth for the foreign-born population - Albania (%)
Place of birth for the foreign-born population - Belarus (%)
Place of birth for the foreign-born population - Bosnia and Herzegovina (%)
Place of birth for the foreign-born population - Bulgaria (%)
Place of birth for the foreign-born population - Croatia (%)
Place of birth for the foreign-born population - Czechoslovakia (%)
Place of birth for the foreign-born population - Hungary (%)
Place of birth for the foreign-born population - Latvia (%)
Place of birth for the foreign-born population - Lithuania (%)
Place of birth for the foreign-born population - North Macedonia (Macedonia) (%)
Place of birth for the foreign-born population - Moldova (%)
Place of birth for the foreign-born population - Poland (%)
Place of birth for the foreign-born population - Romania (%)
Place of birth for the foreign-born population - Russia (%)
Place of birth for the foreign-born population - Serbia (%)
Place of birth for the foreign-born population - Ukraine (%)
Place of birth for the foreign-born population - Other Eastern Europe (%)
Place of birth for the foreign-born population - China (%)
Place of birth for the foreign-born population - Hong Kong (%)
Place of birth for the foreign-born population - Taiwan (%)
Place of birth for the foreign-born population - Japan (%)
Place of birth for the foreign-born population - Korea (%)
Place of birth for the foreign-born population - Other Eastern Asia (%)
Place of birth for the foreign-born population - Afghanistan (%)
Place of birth for the foreign-born population - Bangladesh (%)
Place of birth for the foreign-born population - India (%)
Place of birth for the foreign-born population - Iran (%)
Place of birth for the foreign-born population - Kazakhstan (%)
Place of birth for the foreign-born population - Nepal (%)
Place of birth for the foreign-born population - Pakistan (%)
Place of birth for the foreign-born population - Sri Lanka (%)
Place of birth for the foreign-born population - Uzbekistan (%)
Place of birth for the foreign-born population - Other South Central Asia (%)
Place of birth for the foreign-born population - Burma (%)
Place of birth for the foreign-born population - Cambodia (%)
Place of birth for the foreign-born population - Indonesia (%)
Place of birth for the foreign-born population - Laos (%)
Place of birth for the foreign-born population - Malaysia (%)
Place of birth for the foreign-born population - Philippines (%)
Place of birth for the foreign-born population - Singapore (%)
Place of birth for the foreign-born population - Thailand (%)
Place of birth for the foreign-born population - Vietnam (%)
Place of birth for the foreign-born population - Other South Eastern Asia (%)
Place of birth for the foreign-born population - Armenia (%)
Place of birth for the foreign-born population - Iraq (%)
Place of birth for the foreign-born population - Israel (%)
Place of birth for the foreign-born population - Jordan (%)
Place of birth for the foreign-born population - Kuwait (%)
Place of birth for the foreign-born population - Lebanon (%)
Place of birth for the foreign-born population - Saudi Arabia (%)
Place of birth for the foreign-born population - Syria (%)
Place of birth for the foreign-born population - Turkey (%)
Place of birth for the foreign-born population - Yemen (%)
Place of birth for the foreign-born population - Other Western Asia (%)
Place of birth for the foreign-born population - Eritrea (%)
Place of birth for the foreign-born population - Ethiopia (%)
Place of birth for the foreign-born population - Kenya (%)
Place of birth for the foreign-born population - Somalia (%)
Place of birth for the foreign-born population - Uganda (%)
Place of birth for the foreign-born population - Zimbabwe (%)
Place of birth for the foreign-born population - Other Eastern Africa (%)
Place of birth for the foreign-born population - Cameroon (%)
Place of birth for the foreign-born population - Congo (%)
Place of birth for the foreign-born population - Democratic Republic of Congo (Zaire) (%)
Place of birth for the foreign-born population - Other Middle Africa (%)
Place of birth for the foreign-born population - Egypt (%)
Place of birth for the foreign-born population - Morocco (%)
Place of birth for the foreign-born population - Sudan (%)
Place of birth for the foreign-born population - Other Northern Africa (%)
Place of birth for the foreign-born population - South Africa (%)
Place of birth for the foreign-born population - Other Southern Africa (%)
Place of birth for the foreign-born population - Cabo Verde (%)
Place of birth for the foreign-born population - Ghana (%)
Place of birth for the foreign-born population - Liberia (%)
Place of birth for the foreign-born population - Nigeria (%)
Place of birth for the foreign-born population - Senegal (%)
Place of birth for the foreign-born population - Sierra Leone (%)
Place of birth for the foreign-born population - Other Western Africa (%)
Place of birth for the foreign-born population - Australia (%)
Place of birth for the foreign-born population - New Zealand (%)
Place of birth for the foreign-born population - Fiji (%)
Place of birth for the foreign-born population - Micronesia (%)
Place of birth for the foreign-born population - Bahamas (%)
Place of birth for the foreign-born population - Barbados (%)
Place of birth for the foreign-born population - Cuba (%)
Place of birth for the foreign-born population - Dominica (%)
Place of birth for the foreign-born population - Dominican Republic (%)
Place of birth for the foreign-born population - Grenada (%)
Place of birth for the foreign-born population - Haiti (%)
Place of birth for the foreign-born population - Jamaica (%)
Place of birth for the foreign-born population - St. Vincent and the Grenadines (%)
Place of birth for the foreign-born population - Trinidad and Tobago (%)
Place of birth for the foreign-born population - West Indies (%)
Place of birth for the foreign-born population - Other Caribbean (%)
Place of birth for the foreign-born population - Belize (%)
Place of birth for the foreign-born population - Costa Rica (%)
Place of birth for the foreign-born population - El Salvador (%)
Place of birth for the foreign-born population - Guatemala (%)
Place of birth for the foreign-born population - Honduras (%)
Place of birth for the foreign-born population - Mexico (%)
Place of birth for the foreign-born population - Nicaragua (%)
Place of birth for the foreign-born population - Panama (%)
Place of birth for the foreign-born population - Other Central America (%)
Place of birth for the foreign-born population - Argentina (%)
Place of birth for the foreign-born population - Bolivia (%)
Place of birth for the foreign-born population - Brazil (%)
Place of birth for the foreign-born population - Chile (%)
Place of birth for the foreign-born population - Colombia (%)
Place of birth for the foreign-born population - Ecuador (%)
Place of birth for the foreign-born population - Guyana (%)
Place of birth for the foreign-born population - Peru (%)
Place of birth for the foreign-born population - Uruguay (%)
Place of birth for the foreign-born population - Venezuela (%)
Place of birth for the foreign-born population - Other South America (%)
Place of birth for the foreign-born population - Canada (%)
Place of birth for the foreign-born population - Other Northern America (%)
Place of birth for the foreign-born population - Other (%)
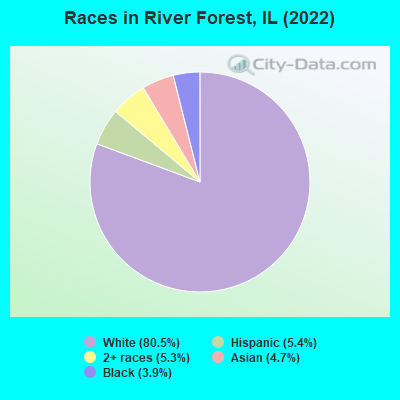
According to 2022 data, the most numerous races in River Forest, IL are White alone (9,100 residents), Hispanic (608 residents), and Black alone (438 residents). 87.6% of River Forest residents speak English at home. 8.9% of River Forest, IL residents are foreign-born (3.1% born in Europe, 3.1% born in Asia, 1.3% born in Latin America), which is 57.6% less than the foreign-born rate of 14.0% across the entire state of Illinois.
Race distribution in River Forest
2000 2022
8,424,140 67.8% White alone 1,856,152 14.9% Black alone 1,530,262 12.3% Hispanic 419,916 3.4% Asian alone 153,996 1.2% Two or more races 13,479 0.1% Other race alone 18,232 0.1% American Indian alone 3,116 0.03% Native Hawaiian and Other
7,356,301 58.5% White alone 2,299,726 18.3% Hispanic 1,660,423 13.2% Black alone 747,296 5.9% Asian alone 458,599 3.6% Two or more races 45,386 0.4% Other race alone 10,405 0.08% American Indian alone 3,896 0.03% Native Hawaiian and Other
Income and house value in River Forest Median household income in 2022 $137,942 White non-Hispanic householders$138,463 Asian householdersover $200,000 Two or more races householdersover $200,000 Hispanic or Latino race householdersMedian 2022 house value $780,806 White Non-Hispanic householders$839,111 Black or African American householders $712,483 Asian householders$286,516 Some other race householders$653,377 Hispanic or Latino householders
Median age by race in River Forest
42.6 Median age for White residents40.9 45.2 43.6 Median age for Black or African American residents36.6 59.6 -680,473,372.1 Median age for American Indian / Alaska Native residents-736,736,736.0 -641,399,416.3 45.1 Median age for Asian residents49.3 39.4 -687,999,999.3 Median age for Native Hawaiian / Pacific Islander residents-918,721,460.3 -610,229,276.3 26.1 Median age for Other race residents26.9 4.8 21.9 Median age for Two or more races residents21.6 23.6 41.9 Median age for White alone residents40.3 44.2 26.1 Median age for Hispanic or Latino residents32.9 21.1
Owner/renter occupied households by race in River Forest
House owners and renters - White residents 3,056 88.0% Owner occupied415 12.0% Renter occupiedHouse owners and renters - Black or African American residents 163 77.0% Owner occupied49 23.0% Renter occupiedHouse owners and renters - Asian residents 183 96.0% Owner occupied8 4.0% Renter occupiedHouse owners and renters - Other race residents 47 80.3% Owner occupied11 19.7% Renter occupiedHouse owners and renters - Two or more races residents 235 88.9% Owner occupied29 11.1% Renter occupiedHouse owners and renters - White alone residents 3,189 87.4% Owner occupied458 12.6% Renter occupiedHouse owners and renters - Hispanic or Latino residents 194 86.4% Owner occupied31 13.6% Renter occupied
Language usage in River Forest
English speakers - Total 87.6% of residents of River Forest speak English at home.
3.4% of residents speak Spanish at home 249 68.4% Speak English very well115 31.6% Speak English less than very well8.4% of residents speak other language at home 575 64.0% Speak English very well323 36.0% Speak English less than very well
English speakers - Born in the United States 93.1% of residents of River Forest speak English at home.
2.7% of residents speak Spanish at home 58 78.4% Speak English very well16 21.6% Speak English less than very well4.2% of residents speak other language at home 102 87.2% Speak English very well15 12.8% Speak English less than very well
All residents speak only English at home
English speakers - Foreign-born 35.3% of residents of River Forest speak English at home.
10.4% of residents speak Spanish at home 80 76.2% Speak English very well25 23.8% Speak English less than very well51.8% of residents speak other language at home 236 45.3% Speak English very well285 54.7% Speak English less than very well
White (Caucasian) - Speak only English Native:
99.8% (7,594)Foreign-born:
35.0% (160)
White (Caucasian) - Speak another language Native:
3.4% (259)Foreign-born:
66.6% (305)
Black or African American - Speak only English Native:
99.3% (427)Foreign-born:
100.0% (35)
Black or African American - Speak another language Native:
0.7% (3)Foreign-born:
12.0% (4)
Asian - Speak only English Native:
57.6% (139)Foreign-born:
38.7% (114)
Asian - Speak another language Native:
42.4% (102)Foreign-born:
57.3% (169)
Other race - Speak another language Native:
6.9% (6)Foreign-born:
100.0% (4)
Two or more races - Speak only English Native:
74.0% (603)Foreign-born:
32.4% (33)
Two or more races - Speak another language Native:
24.0% (196)Foreign-born:
67.6% (69)
White alone - Speak only English Native:
96.1% (7,713)Foreign-born:
34.6% (177)
White alone - Speak another language Native:
3.5% (280)Foreign-born:
63.2% (323)
Hispanic or Latino - Speak only English Native:
49.7% (228)Foreign-born:
21.5% (30)
Hispanic or Latino - Speak another language Native:
51.4% (236)Foreign-born:
76.5% (106)
Foreign-born residents in River Forest 1,005 residents are foreign born (3.1% Europe , 3.1% Asia , 1.3% Latin America ).
This city:
8.9%Illinois:
14.1%
Marital status for residents in River Forest Marital status - White (Caucasian) population 15 years and over
Males 35.0% Never married58.9% Now married0.5% Separated1.0% Widowed4.7% DivorcedFemales 27.2% Never married56.8% Now married1.3% Separated10.3% Widowed4.5% DivorcedWomen who gave birth in the past 12 months Now married:
100.0% (87)Unmarried:
0.0% (0)
Women who did not give birth in the past 12 months Now married:
52.0% (809)Unmarried:
48.0% (745)
Marital status - Black or African American population 15 years and over
Males 59.6% Never married23.7% Now married0.0% Separated0.0% Widowed16.7% DivorcedFemales 53.6% Never married7.2% Now married5.9% Separated0.0% Widowed33.3% DivorcedWomen who did not give birth in the past 12 months Now married:
14.6% (13)Unmarried:
85.4% (77)
Marital status - Asian population 15 years and over
Males 35.1% Never married64.9% Now married0.0% Separated0.0% Widowed0.0% DivorcedFemales 43.1% Never married48.4% Now married0.0% Separated3.8% Widowed4.7% DivorcedWomen who did not give birth in the past 12 months Now married:
22.5% (40)Unmarried:
77.5% (139)
Marital status - Other race population 15 years and over
Males 43.4% Never married56.6% Now married0.0% Separated0.0% Widowed0.0% DivorcedFemales 100.0% Never married0.0% Now married0.0% Separated0.0% Widowed0.0% DivorcedWomen who did not give birth in the past 12 months Now married:
0.0% (0)Unmarried:
100.0% (7)
Marital status - Two or more races population 15 years and over
Males 56.7% Never married42.2% Now married0.0% Separated0.0% Widowed1.1% DivorcedFemales 50.2% Never married38.6% Now married0.0% Separated3.2% Widowed8.0% DivorcedWomen who gave birth in the past 12 months Now married:
0.0% (0)Unmarried:
100.0% (18)
Women who did not give birth in the past 12 months Now married:
34.9% (83)Unmarried:
65.1% (155)
Marital status - White alone, not Hispanic / Latino population 15 years and over
Males 34.4% Never married59.3% Now married0.5% Separated1.0% Widowed4.8% DivorcedFemales 26.0% Never married57.3% Now married1.3% Separated10.7% Widowed4.7% DivorcedWomen who gave birth in the past 12 months Now married:
100.0% (98)Unmarried:
0.0% (0)
Women who did not give birth in the past 12 months Now married:
53.1% (855)Unmarried:
46.9% (754)
Marital status - Hispanic or Latino population 15 years and over
Males 44.2% Never married42.3% Now married0.0% Separated0.0% Widowed13.6% DivorcedFemales 42.7% Never married46.3% Now married0.0% Separated3.1% Widowed7.8% DivorcedWomen who did not give birth in the past 12 months Now married:
44.9% (89)Unmarried:
55.1% (109)
Ancestries in River Forest
862 19.1% Irish461 10.2% Italian372 8.2% German371 8.2% Polish251 5.6% English242 5.4% American119 2.6% European109 2.4% Greek94 2.1% Northern European73 1.6% Ukrainian71 1.6% Iranian52 1.2% Scandinavian36 0.8% Czech30 0.7% Dutch30 0.7% French29 0.6% Scottish29 0.6% African21 0.5% Russian19 0.4% Icelander19 0.4% Norwegian16 0.4% Bulgarian15 0.3% Canadian14 0.3% Armenian14 0.3% British14 0.3% Finnish14 0.3% French Canadian14 0.3% Slovene13 0.3% Croatian13 0.3% Hungarian11 0.2% Romanian9 0.2% Swiss8 0.2% Arab7 0.2% Lebanese6 0.1% Palestinian6 0.1% Moroccan5 0.1% Swedish5 0.1% Austrian4 0.09% Israeli4 0.09% Lithuanian3 0.07% Jamaican1 0.02% Haitian
Children Nativity (place of birth) in River Forest
Children under 6 years - Living with two parents Both parents native 566 100.0% NativeOne native, one foreign-born parent 20 100.0% NativeChildren under 6 years - Living with one parent Native parent 122 100.0% NativeChildren 6 to 17 years - Living with two parents Both parents native 1,474 99.3% Native10 0.7% Foreign-bornBoth parents foreign-born 24 63.3% Native14 36.7% Foreign-bornOne native, one foreign-born parent 204 100.0% NativeChildren 6 to 17 years - Living with one parent Native parent 112 100.0% Native