Races in Ridgefield Park, New Jersey (NJ) Detailed Stats
Data:
Races - White alone (%)
Races - White alone (% change since 2000)
Races - Black alone (%)
Races - Black alone (% change since 2000)
Races - American Indian alone (%)
Races - American Indian alone (% change since 2000)
Races - Asian alone (%)
Races - Asian alone (% change since 2000)
Races - Hispanic (%)
Races - Hispanic (% change since 2000)
Races - Native Hawaiian and Other Pacific Islander alone (%)
Races - Native Hawaiian and Other Pacific Islander alone (% change since 2000)
Races - Two or more races(%)
Races - Two or more races(% change since 2000)
Races - Other race alone (%)
Races - Other race alone (% change since 2000)
Racial diversity
Place of birth - Born in state of residence (%)
Place of birth - Born in state of residence (%) - White
Place of birth - Born in state of residence (%) - Black or African American
Place of birth - Born in state of residence (%) - Asian
Place of birth - Born in state of residence (%) - Hispanic or Latino
Place of birth - Born in state of residence (%) - American Indian and Alaska Native
Place of birth - Born in state of residence (%) - Multirace
Place of birth - Born in state of residence (%) - Other Race
Place of birth - Born in other state (%)
Place of birth - Born in other state (%) - White
Place of birth - Born in other state (%) - Black or African American
Place of birth - Born in other state (%) - Asian
Place of birth - Born in other state (%) - Hispanic or Latino
Place of birth - Born in other state (%) - American Indian and Alaska Native
Place of birth - Born in other state (%) - Multirace
Place of birth - Born in other state (%) - Other Race
Place of birth - Native, outside of US (%)
Place of birth - Native, outside of US (%) - White
Place of birth - Native, outside of US (%) - Black or African American
Place of birth - Native, outside of US (%) - Asian
Place of birth - Native, outside of US (%) - Hispanic or Latino
Place of birth - Native, outside of US (%) - American Indian and Alaska Native
Place of birth - Native, outside of US (%) - Multirace
Place of birth - Native, outside of US (%) - Other Race
Place of birth - Foreign born (%)
Place of birth - Foreign born (%) - White
Place of birth - Foreign born (%) - Black or African American
Place of birth - Foreign born (%) - Asian
Place of birth - Foreign born (%) - Hispanic or Latino
Place of birth - Foreign born (%) - American Indian and Alaska Native
Place of birth - Foreign born (%) - Multirace
Place of birth - Foreign born (%) - Other Race
Residents speaking English at home (%)
Residents speaking English at home - Born in the United States (%)
Residents speaking English at home - Native, born elsewhere (%)
Residents speaking English at home - Foreign born (%)
Residents speaking Spanish at home (%)
Residents speaking Spanish at home - Born in the United States (%)
Residents speaking Spanish at home - Native, born elsewhere (%)
Residents speaking Spanish at home - Foreign born (%)
Residents speaking other language at home (%)
Residents speaking other language at home - Born in the United States (%)
Residents speaking other language at home - Native, born elsewhere (%)
Residents speaking other language at home - Foreign born (%)
Marital status - Never married (%)
Marital status - Now married (%)
Marital status - Separated (%)
Marital status - Widowed (%)
Marital status - Divorced (%)
Ancestries Reported - Arab (%)
Ancestries Reported - Czech (%)
Ancestries Reported - Danish (%)
Ancestries Reported - Dutch (%)
Ancestries Reported - English (%)
Ancestries Reported - French (%)
Ancestries Reported - French Canadian (%)
Ancestries Reported - German (%)
Ancestries Reported - Greek (%)
Ancestries Reported - Hungarian (%)
Ancestries Reported - Irish (%)
Ancestries Reported - Italian (%)
Ancestries Reported - Lithuanian (%)
Ancestries Reported - Norwegian (%)
Ancestries Reported - Polish (%)
Ancestries Reported - Portuguese (%)
Ancestries Reported - Russian (%)
Ancestries Reported - Scotch-Irish (%)
Ancestries Reported - Scottish (%)
Ancestries Reported - Slovak (%)
Ancestries Reported - Subsaharan African (%)
Ancestries Reported - Swedish (%)
Ancestries Reported - Swiss (%)
Ancestries Reported - Ukrainian (%)
Ancestries Reported - United States (%)
Ancestries Reported - Welsh (%)
Ancestries Reported - West Indian (%)
Ancestries Reported - Other (%)
Geographical mobility - Same house 1 year ago (%)
Geographical mobility - Same house 1 year ago (%) - White
Geographical mobility - Same house 1 year ago (%) - Black or African American
Geographical mobility - Same house 1 year ago (%) - Asian
Geographical mobility - Same house 1 year ago (%) - Hispanic or Latino
Geographical mobility - Same house 1 year ago (%) - American Indian and Alaska Native
Geographical mobility - Same house 1 year ago (%) - Multirace
Geographical mobility - Same house 1 year ago (%) - Other Race
Geographical mobility - Moved within same county (%)
Geographical mobility - Moved within same county (%) - White
Geographical mobility - Moved within same county (%) - Black or African American
Geographical mobility - Moved within same county (%) - Asian
Geographical mobility - Moved within same county (%) - Hispanic or Latino
Geographical mobility - Moved within same county (%) - American Indian and Alaska Native
Geographical mobility - Moved within same county (%) - Multirace
Geographical mobility - Moved within same county (%) - Other Race
Geographical mobility - Moved from different county within same state (%)
Geographical mobility - Moved from different county within same state (%) - White
Geographical mobility - Moved from different county within same state (%) - Black or African American
Geographical mobility - Moved from different county within same state (%) - Asian
Geographical mobility - Moved from different county within same state (%) - Hispanic or Latino
Geographical mobility - Moved from different county within same state (%) - American Indian and Alaska Native
Geographical mobility - Moved from different county within same state (%) - Multirace
Geographical mobility - Moved from different county within same state (%) - Other Race
Geographical mobility - Moved from different state (%)
Geographical mobility - Moved from different state (%) - White
Geographical mobility - Moved from different state (%) - Black or African American
Geographical mobility - Moved from different state (%) - Asian
Geographical mobility - Moved from different state (%) - Hispanic or Latino
Geographical mobility - Moved from different state (%) - American Indian and Alaska Native
Geographical mobility - Moved from different state (%) - Multirace
Geographical mobility - Moved from different state (%) - Other Race
Geographical mobility - Moved from abroad (%)
Geographical mobility - Moved from abroad (%) - White
Geographical mobility - Moved from abroad (%) - Black or African American
Geographical mobility - Moved from abroad (%) - Asian
Geographical mobility - Moved from abroad (%) - Hispanic or Latino
Geographical mobility - Moved from abroad (%) - American Indian and Alaska Native
Geographical mobility - Moved from abroad (%) - Multirace
Geographical mobility - Moved from abroad (%) - Other Race
Place of birth for the foreign-born population - Ireland (%)
Place of birth for the foreign-born population - Denmark (%)
Place of birth for the foreign-born population - Norway (%)
Place of birth for the foreign-born population - Sweden (%)
Place of birth for the foreign-born population - United Kingdom (%)
Place of birth for the foreign-born population - England (%)
Place of birth for the foreign-born population - Scotland (%)
Place of birth for the foreign-born population - Other Northern Europe (%)
Place of birth for the foreign-born population - Austria (%)
Place of birth for the foreign-born population - Belgium (%)
Place of birth for the foreign-born population - France (%)
Place of birth for the foreign-born population - Germany (%)
Place of birth for the foreign-born population - Netherlands (%)
Place of birth for the foreign-born population - Switzerland (%)
Place of birth for the foreign-born population - Other Western Europe (%)
Place of birth for the foreign-born population - Greece (%)
Place of birth for the foreign-born population - Italy (%)
Place of birth for the foreign-born population - Portugal (%)
Place of birth for the foreign-born population - Spain (%)
Place of birth for the foreign-born population - Other Southern Europe (%)
Place of birth for the foreign-born population - Albania (%)
Place of birth for the foreign-born population - Belarus (%)
Place of birth for the foreign-born population - Bosnia and Herzegovina (%)
Place of birth for the foreign-born population - Bulgaria (%)
Place of birth for the foreign-born population - Croatia (%)
Place of birth for the foreign-born population - Czechoslovakia (%)
Place of birth for the foreign-born population - Hungary (%)
Place of birth for the foreign-born population - Latvia (%)
Place of birth for the foreign-born population - Lithuania (%)
Place of birth for the foreign-born population - North Macedonia (Macedonia) (%)
Place of birth for the foreign-born population - Moldova (%)
Place of birth for the foreign-born population - Poland (%)
Place of birth for the foreign-born population - Romania (%)
Place of birth for the foreign-born population - Russia (%)
Place of birth for the foreign-born population - Serbia (%)
Place of birth for the foreign-born population - Ukraine (%)
Place of birth for the foreign-born population - Other Eastern Europe (%)
Place of birth for the foreign-born population - China (%)
Place of birth for the foreign-born population - Hong Kong (%)
Place of birth for the foreign-born population - Taiwan (%)
Place of birth for the foreign-born population - Japan (%)
Place of birth for the foreign-born population - Korea (%)
Place of birth for the foreign-born population - Other Eastern Asia (%)
Place of birth for the foreign-born population - Afghanistan (%)
Place of birth for the foreign-born population - Bangladesh (%)
Place of birth for the foreign-born population - India (%)
Place of birth for the foreign-born population - Iran (%)
Place of birth for the foreign-born population - Kazakhstan (%)
Place of birth for the foreign-born population - Nepal (%)
Place of birth for the foreign-born population - Pakistan (%)
Place of birth for the foreign-born population - Sri Lanka (%)
Place of birth for the foreign-born population - Uzbekistan (%)
Place of birth for the foreign-born population - Other South Central Asia (%)
Place of birth for the foreign-born population - Burma (%)
Place of birth for the foreign-born population - Cambodia (%)
Place of birth for the foreign-born population - Indonesia (%)
Place of birth for the foreign-born population - Laos (%)
Place of birth for the foreign-born population - Malaysia (%)
Place of birth for the foreign-born population - Philippines (%)
Place of birth for the foreign-born population - Singapore (%)
Place of birth for the foreign-born population - Thailand (%)
Place of birth for the foreign-born population - Vietnam (%)
Place of birth for the foreign-born population - Other South Eastern Asia (%)
Place of birth for the foreign-born population - Armenia (%)
Place of birth for the foreign-born population - Iraq (%)
Place of birth for the foreign-born population - Israel (%)
Place of birth for the foreign-born population - Jordan (%)
Place of birth for the foreign-born population - Kuwait (%)
Place of birth for the foreign-born population - Lebanon (%)
Place of birth for the foreign-born population - Saudi Arabia (%)
Place of birth for the foreign-born population - Syria (%)
Place of birth for the foreign-born population - Turkey (%)
Place of birth for the foreign-born population - Yemen (%)
Place of birth for the foreign-born population - Other Western Asia (%)
Place of birth for the foreign-born population - Eritrea (%)
Place of birth for the foreign-born population - Ethiopia (%)
Place of birth for the foreign-born population - Kenya (%)
Place of birth for the foreign-born population - Somalia (%)
Place of birth for the foreign-born population - Uganda (%)
Place of birth for the foreign-born population - Zimbabwe (%)
Place of birth for the foreign-born population - Other Eastern Africa (%)
Place of birth for the foreign-born population - Cameroon (%)
Place of birth for the foreign-born population - Congo (%)
Place of birth for the foreign-born population - Democratic Republic of Congo (Zaire) (%)
Place of birth for the foreign-born population - Other Middle Africa (%)
Place of birth for the foreign-born population - Egypt (%)
Place of birth for the foreign-born population - Morocco (%)
Place of birth for the foreign-born population - Sudan (%)
Place of birth for the foreign-born population - Other Northern Africa (%)
Place of birth for the foreign-born population - South Africa (%)
Place of birth for the foreign-born population - Other Southern Africa (%)
Place of birth for the foreign-born population - Cabo Verde (%)
Place of birth for the foreign-born population - Ghana (%)
Place of birth for the foreign-born population - Liberia (%)
Place of birth for the foreign-born population - Nigeria (%)
Place of birth for the foreign-born population - Senegal (%)
Place of birth for the foreign-born population - Sierra Leone (%)
Place of birth for the foreign-born population - Other Western Africa (%)
Place of birth for the foreign-born population - Australia (%)
Place of birth for the foreign-born population - New Zealand (%)
Place of birth for the foreign-born population - Fiji (%)
Place of birth for the foreign-born population - Micronesia (%)
Place of birth for the foreign-born population - Bahamas (%)
Place of birth for the foreign-born population - Barbados (%)
Place of birth for the foreign-born population - Cuba (%)
Place of birth for the foreign-born population - Dominica (%)
Place of birth for the foreign-born population - Dominican Republic (%)
Place of birth for the foreign-born population - Grenada (%)
Place of birth for the foreign-born population - Haiti (%)
Place of birth for the foreign-born population - Jamaica (%)
Place of birth for the foreign-born population - St. Vincent and the Grenadines (%)
Place of birth for the foreign-born population - Trinidad and Tobago (%)
Place of birth for the foreign-born population - West Indies (%)
Place of birth for the foreign-born population - Other Caribbean (%)
Place of birth for the foreign-born population - Belize (%)
Place of birth for the foreign-born population - Costa Rica (%)
Place of birth for the foreign-born population - El Salvador (%)
Place of birth for the foreign-born population - Guatemala (%)
Place of birth for the foreign-born population - Honduras (%)
Place of birth for the foreign-born population - Mexico (%)
Place of birth for the foreign-born population - Nicaragua (%)
Place of birth for the foreign-born population - Panama (%)
Place of birth for the foreign-born population - Other Central America (%)
Place of birth for the foreign-born population - Argentina (%)
Place of birth for the foreign-born population - Bolivia (%)
Place of birth for the foreign-born population - Brazil (%)
Place of birth for the foreign-born population - Chile (%)
Place of birth for the foreign-born population - Colombia (%)
Place of birth for the foreign-born population - Ecuador (%)
Place of birth for the foreign-born population - Guyana (%)
Place of birth for the foreign-born population - Peru (%)
Place of birth for the foreign-born population - Uruguay (%)
Place of birth for the foreign-born population - Venezuela (%)
Place of birth for the foreign-born population - Other South America (%)
Place of birth for the foreign-born population - Canada (%)
Place of birth for the foreign-born population - Other Northern America (%)
Place of birth for the foreign-born population - Other (%)
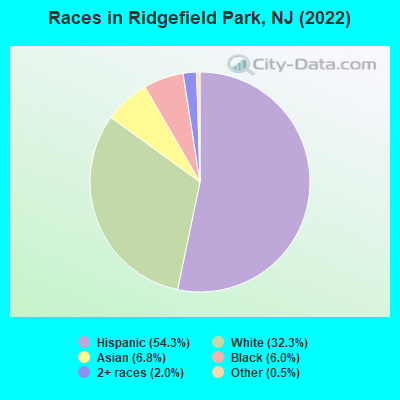
According to 2022 data, the most numerous races in Ridgefield Park, NJ are White alone (4,247 residents), Hispanic (7,141 residents), and Black alone (792 residents). 44.1% of Ridgefield Park residents speak English at home. 38.6% of Ridgefield Park, NJ residents are foreign-born (27.2% born in Latin America, 5.5% born in Asia, 4.2% born in Europe), which is 40.5% greater than the foreign-born rate of 23.0% across the entire state of New Jersey.
Race distribution in Ridgefield Park
2000 2022
5,557,209 66.0% White alone 1,117,191 13.3% Hispanic 1,096,171 13.0% Black alone 477,012 5.7% Asian alone 133,689 1.6% Two or more races 19,565 0.2% Other race alone 11,338 0.1% American Indian alone 2,175 0.03% Native Hawaiian and Other
4,766,476 51.5% White alone 2,028,470 21.9% Hispanic 1,111,632 12.0% Black alone 923,546 10.0% Asian alone 332,237 3.6% Two or more races 89,847 1.0% Other race alone 8,557 0.09% American Indian alone 934 0.01% Native Hawaiian and Other
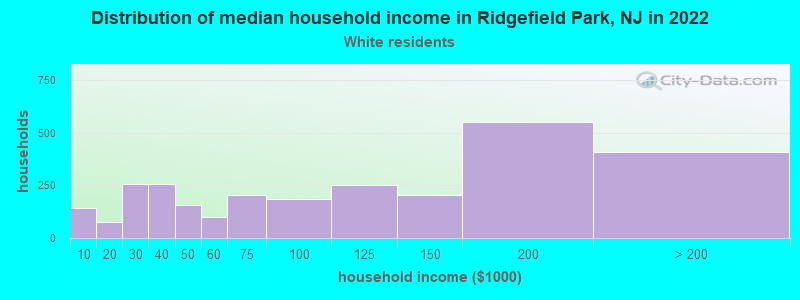
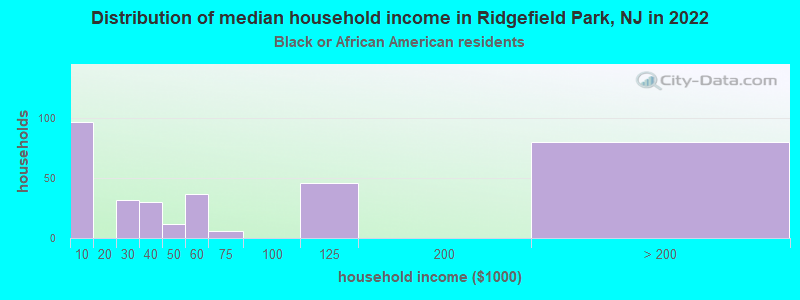
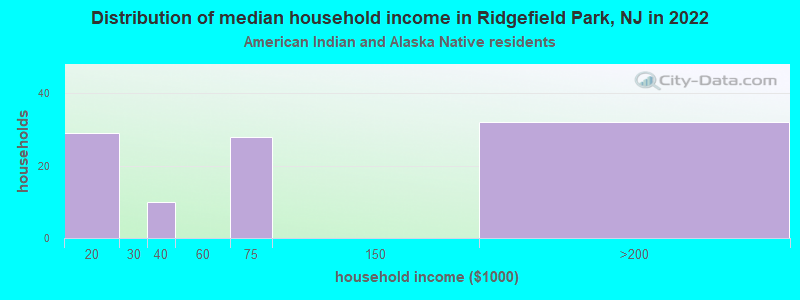
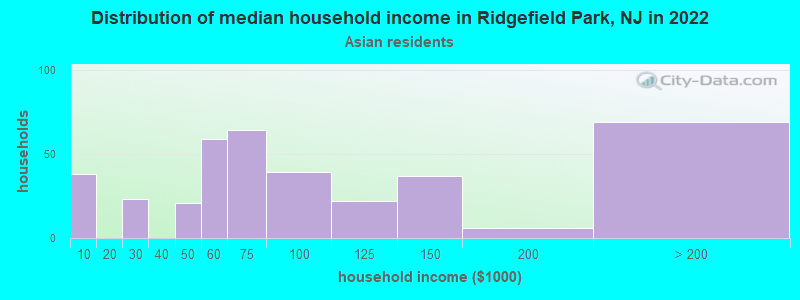
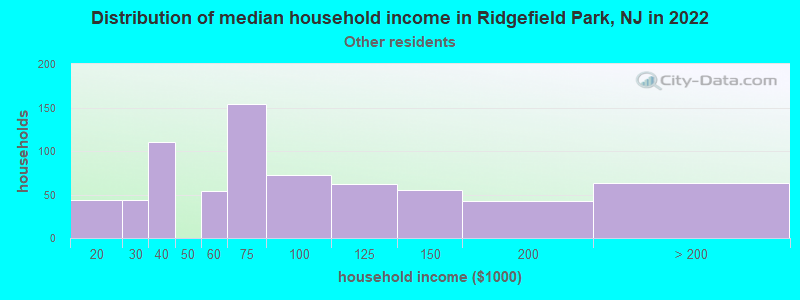
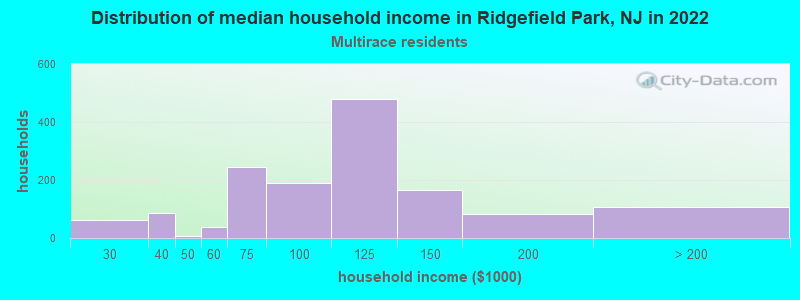
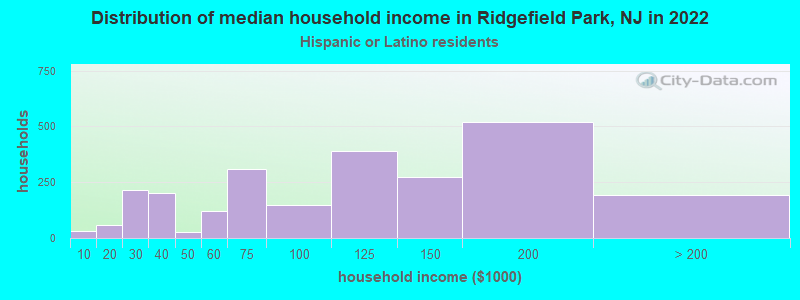
Income and house value in Ridgefield Park Median household income in 2022 $88,355 White non-Hispanic householders$77,795 Asian householders$65,342 Some other race householders$105,989 Two or more races householders$105,929 Hispanic or Latino race householdersMedian 2022 house value $442,252 White Non-Hispanic householders$586,023 Black or African American householders $439,647 Asian householders$488,352 Some other race householders$461,265 Two or more races householders$465,172 Hispanic or Latino householders
Median age by race in Ridgefield Park
45.3 Median age for White residents45.8 44.5 28.3 Median age for Black or African American residents30.3 27.4 47.0 Median age for American Indian / Alaska Native residents-686,322,685.6 46.2 38.7 Median age for Asian residents32.8 43.0 -510,460,250.5 Median age for Native Hawaiian / Pacific Islander residents-514,767,932.0 -713,070,378.3 40.3 Median age for Other race residents41.7 35.5 34.8 Median age for Two or more races residents36.1 33.5 51.8 Median age for White alone residents50.1 52.5 35.4 Median age for Hispanic or Latino residents35.9 34.2
Owner/renter occupied households by race in Ridgefield Park
House owners and renters - White residents 1,677 61.7% Owner occupied1,043 38.3% Renter occupiedHouse owners and renters - Black or African American residents 103 36.8% Owner occupied177 63.2% Renter occupiedHouse owners and renters - American Indian / Alaska Native residents 28 28.0% Owner occupied73 72.0% Renter occupiedHouse owners and renters - Asian residents 192 54.2% Owner occupied162 45.8% Renter occupiedHouse owners and renters - Other race residents 470 63.1% Owner occupied275 36.9% Renter occupiedHouse owners and renters - Two or more races residents 633 46.3% Owner occupied733 53.7% Renter occupiedHouse owners and renters - White alone residents 1,242 63.1% Owner occupied728 36.9% Renter occupiedHouse owners and renters - Hispanic or Latino residents 1,356 53.6% Owner occupied1,176 46.4% Renter occupied
Language usage in Ridgefield Park
English speakers - Total 44.1% of residents of Ridgefield Park speak English at home.
43.9% of residents speak Spanish at home 3,416 63.5% Speak English very well1,963 36.5% Speak English less than very well13.9% of residents speak other language at home 889 52.2% Speak English very well814 47.8% Speak English less than very well
English speakers - Born in the United States 59.1% of residents of Ridgefield Park speak English at home.
34.7% of residents speak Spanish at home 818 90.6% Speak English very well85 9.4% Speak English less than very well10.4% of residents speak other language at home 268 98.5% Speak English very well4 1.5% Speak English less than very well
English speakers - Native, born elsewhere 30.3% of residents of Ridgefield Park speak English at home.
66.3% of residents speak Spanish at home 257 78.4% Speak English very well71 21.6% Speak English less than very well5.1% of residents speak other language at home 25 100.0% Speak English very well
English speakers - Foreign-born 14.5% of residents of Ridgefield Park speak English at home.
61.7% of residents speak Spanish at home 1,500 47.9% Speak English very well1,631 52.1% Speak English less than very well24.7% of residents speak other language at home 457 36.4% Speak English very well797 63.6% Speak English less than very well
White (Caucasian) - Speak only English Native:
79.3% (3,355)Foreign-born:
18.6% (299)
White (Caucasian) - Speak another language Native:
18.1% (765)Foreign-born:
80.7% (1,299)
Black or African American - Speak only English Native:
96.7% (511)Foreign-born:
78.2% (149)
Black or African American - Speak another language Native:
3.2% (17)Foreign-born:
24.6% (47)
American Indian / Alaska Native - Speak another language Native:
99.5% (56)Foreign-born:
100.0% (57)
Asian - Speak only English Native:
40.4% (82)Foreign-born:
12.2% (82)
Asian - Speak another language Native:
59.4% (120)Foreign-born:
87.8% (592)
Other race - Speak only English Native:
28.2% (238)Foreign-born:
7.4% (63)
Other race - Speak another language Native:
70.4% (594)Foreign-born:
91.2% (772)
Two or more races - Speak only English Native:
30.6% (556)Foreign-born:
7.4% (171)
Two or more races - Speak another language Native:
73.0% (1,328)Foreign-born:
93.4% (2,169)
White alone - Speak only English Native:
88.8% (2,926)Foreign-born:
21.8% (163)
White alone - Speak another language Native:
11.0% (362)Foreign-born:
78.2% (584)
Hispanic or Latino - Speak only English Native:
31.3% (980)Foreign-born:
11.3% (405)
Hispanic or Latino - Speak another language Native:
70.2% (2,197)Foreign-born:
89.1% (3,176)
Foreign-born residents in Ridgefield Park 5,084 residents are foreign born (27.2% Latin America , 5.5% Asia , 4.2% Europe ).
This city:
38.6%New Jersey:
23.2%
Marital status for residents in Ridgefield Park Marital status - White (Caucasian) population 15 years and over
Males 28.7% Never married52.6% Now married3.0% Separated1.5% Widowed14.2% DivorcedFemales 33.9% Never married44.7% Now married1.1% Separated8.6% Widowed11.7% DivorcedWomen who gave birth in the past 12 months Now married:
77.3% (104)Unmarried:
22.7% (30)
Women who did not give birth in the past 12 months Now married:
34.3% (442)Unmarried:
65.7% (847)
Marital status - Black or African American population 15 years and over
Males 61.4% Never married34.4% Now married0.0% Separated0.0% Widowed4.2% DivorcedFemales 44.4% Never married38.5% Now married0.0% Separated0.0% Widowed17.0% DivorcedWomen who did not give birth in the past 12 months Now married:
30.3% (68)Unmarried:
69.7% (156)
Marital status - Asian population 15 years and over
Males 44.5% Never married55.5% Now married0.0% Separated0.0% Widowed0.0% DivorcedFemales 45.3% Never married36.7% Now married0.0% Separated14.0% Widowed4.0% DivorcedWomen who did not give birth in the past 12 months Now married:
45.9% (115)Unmarried:
54.1% (136)
Marital status - Other race population 15 years and over
Males 23.4% Never married69.9% Now married3.1% Separated0.0% Widowed3.6% DivorcedFemales 39.1% Never married35.9% Now married2.0% Separated11.5% Widowed11.5% DivorcedWomen who gave birth in the past 12 months Now married:
0.0% (0)Unmarried:
100.0% (42)
Women who did not give birth in the past 12 months Now married:
36.1% (217)Unmarried:
63.9% (385)
Marital status - Two or more races population 15 years and over
Males 37.1% Never married34.5% Now married5.2% Separated0.0% Widowed23.3% DivorcedFemales 47.7% Never married39.9% Now married0.9% Separated1.5% Widowed10.0% DivorcedWomen who gave birth in the past 12 months Now married:
0.0% (0)Unmarried:
100.0% (219)
Women who did not give birth in the past 12 months Now married:
44.5% (360)Unmarried:
55.5% (449)
Marital status - White alone, not Hispanic / Latino population 15 years and over
Males 31.3% Never married50.4% Now married2.7% Separated1.0% Widowed14.5% DivorcedFemales 29.4% Never married42.7% Now married1.6% Separated13.0% Widowed13.3% DivorcedWomen who gave birth in the past 12 months Now married:
100.0% (47)Unmarried:
0.0% (0)
Women who did not give birth in the past 12 months Now married:
34.1% (285)Unmarried:
65.9% (550)
Marital status - Hispanic or Latino population 15 years and over
Males 28.6% Never married49.7% Now married4.2% Separated0.9% Widowed16.6% DivorcedFemales 43.3% Never married42.6% Now married0.8% Separated3.8% Widowed9.5% DivorcedWomen who gave birth in the past 12 months Now married:
28.4% (79)Unmarried:
71.6% (201)
Women who did not give birth in the past 12 months Now married:
38.0% (654)Unmarried:
62.0% (1,066)
Ancestries in Ridgefield Park
523 6.5% Italian332 4.1% African276 3.4% Irish207 2.6% Jamaican180 2.2% Greek149 1.8% Egyptian125 1.6% American111 1.4% Albanian104 1.3% German72 0.9% Polish68 0.8% Haitian66 0.8% Russian55 0.7% Brazilian46 0.6% Ukrainian27 0.3% Armenian23 0.3% Palestinian10 0.1% French10 0.1% Swedish10 0.1% Dutch West Indian9 0.1% Slovak8 0.10% Northern European8 0.10% West Indian7 0.09% English7 0.09% Scottish6 0.07% British5 0.06% Hungarian
Children Nativity (place of birth) in Ridgefield Park
Children under 6 years - Living with two parents Both parents native 95 100.0% NativeBoth parents foreign-born 257 100.0% NativeOne native, one foreign-born parent 163 100.0% NativeChildren under 6 years - Living with one parent Native parent 127 100.0% NativeForeign-born parent 187 100.0% NativeChildren 6 to 17 years - Living with two parents Both parents native 201 94.2% Native12 5.8% Foreign-bornBoth parents foreign-born 486 87.4% Native70 12.6% Foreign-bornOne native, one foreign-born parent 280 97.1% Native8 2.9% Foreign-bornChildren 6 to 17 years - Living with one parent Native parent 4 100.0% NativeForeign-born parent 605 57.8% Native441 42.2% Foreign-born
Grandparents responsible for own grandchildren in Ridgefield Park
Grandparents (30 to 59 years) White / Caucasian 20 100.0% Not responsible for grandchildrenTwo or more races 49 100.0% Not responsible for grandchildrenHispanic or Latino 32 100.0% Not responsible for grandchildrenGrandparents (60 years and over) White / Caucasian 94 100.0% Not responsible for grandchildrenTwo or more races 124 100.0% Not responsible for grandchildrenHispanic or Latino 27 14.3% Responsible for grandchildren162 85.7% Not responsible for grandchildren