Races in Richmond, Virginia (VA) Detailed Stats
Data:
Races - White alone (%)
Races - White alone (% change since 2000)
Races - Black alone (%)
Races - Black alone (% change since 2000)
Races - American Indian alone (%)
Races - American Indian alone (% change since 2000)
Races - Asian alone (%)
Races - Asian alone (% change since 2000)
Races - Hispanic (%)
Races - Hispanic (% change since 2000)
Races - Native Hawaiian and Other Pacific Islander alone (%)
Races - Native Hawaiian and Other Pacific Islander alone (% change since 2000)
Races - Two or more races(%)
Races - Two or more races(% change since 2000)
Races - Other race alone (%)
Races - Other race alone (% change since 2000)
Racial diversity
Place of birth - Born in state of residence (%)
Place of birth - Born in state of residence (%) - White
Place of birth - Born in state of residence (%) - Black or African American
Place of birth - Born in state of residence (%) - Asian
Place of birth - Born in state of residence (%) - Hispanic or Latino
Place of birth - Born in state of residence (%) - American Indian and Alaska Native
Place of birth - Born in state of residence (%) - Multirace
Place of birth - Born in state of residence (%) - Other Race
Place of birth - Born in other state (%)
Place of birth - Born in other state (%) - White
Place of birth - Born in other state (%) - Black or African American
Place of birth - Born in other state (%) - Asian
Place of birth - Born in other state (%) - Hispanic or Latino
Place of birth - Born in other state (%) - American Indian and Alaska Native
Place of birth - Born in other state (%) - Multirace
Place of birth - Born in other state (%) - Other Race
Place of birth - Native, outside of US (%)
Place of birth - Native, outside of US (%) - White
Place of birth - Native, outside of US (%) - Black or African American
Place of birth - Native, outside of US (%) - Asian
Place of birth - Native, outside of US (%) - Hispanic or Latino
Place of birth - Native, outside of US (%) - American Indian and Alaska Native
Place of birth - Native, outside of US (%) - Multirace
Place of birth - Native, outside of US (%) - Other Race
Place of birth - Foreign born (%)
Place of birth - Foreign born (%) - White
Place of birth - Foreign born (%) - Black or African American
Place of birth - Foreign born (%) - Asian
Place of birth - Foreign born (%) - Hispanic or Latino
Place of birth - Foreign born (%) - American Indian and Alaska Native
Place of birth - Foreign born (%) - Multirace
Place of birth - Foreign born (%) - Other Race
Residents speaking English at home (%)
Residents speaking English at home - Born in the United States (%)
Residents speaking English at home - Native, born elsewhere (%)
Residents speaking English at home - Foreign born (%)
Residents speaking Spanish at home (%)
Residents speaking Spanish at home - Born in the United States (%)
Residents speaking Spanish at home - Native, born elsewhere (%)
Residents speaking Spanish at home - Foreign born (%)
Residents speaking other language at home (%)
Residents speaking other language at home - Born in the United States (%)
Residents speaking other language at home - Native, born elsewhere (%)
Residents speaking other language at home - Foreign born (%)
Marital status - Never married (%)
Marital status - Now married (%)
Marital status - Separated (%)
Marital status - Widowed (%)
Marital status - Divorced (%)
Ancestries Reported - Arab (%)
Ancestries Reported - Czech (%)
Ancestries Reported - Danish (%)
Ancestries Reported - Dutch (%)
Ancestries Reported - English (%)
Ancestries Reported - French (%)
Ancestries Reported - French Canadian (%)
Ancestries Reported - German (%)
Ancestries Reported - Greek (%)
Ancestries Reported - Hungarian (%)
Ancestries Reported - Irish (%)
Ancestries Reported - Italian (%)
Ancestries Reported - Lithuanian (%)
Ancestries Reported - Norwegian (%)
Ancestries Reported - Polish (%)
Ancestries Reported - Portuguese (%)
Ancestries Reported - Russian (%)
Ancestries Reported - Scotch-Irish (%)
Ancestries Reported - Scottish (%)
Ancestries Reported - Slovak (%)
Ancestries Reported - Subsaharan African (%)
Ancestries Reported - Swedish (%)
Ancestries Reported - Swiss (%)
Ancestries Reported - Ukrainian (%)
Ancestries Reported - United States (%)
Ancestries Reported - Welsh (%)
Ancestries Reported - West Indian (%)
Ancestries Reported - Other (%)
Geographical mobility - Same house 1 year ago (%)
Geographical mobility - Same house 1 year ago (%) - White
Geographical mobility - Same house 1 year ago (%) - Black or African American
Geographical mobility - Same house 1 year ago (%) - Asian
Geographical mobility - Same house 1 year ago (%) - Hispanic or Latino
Geographical mobility - Same house 1 year ago (%) - American Indian and Alaska Native
Geographical mobility - Same house 1 year ago (%) - Multirace
Geographical mobility - Same house 1 year ago (%) - Other Race
Geographical mobility - Moved within same county (%)
Geographical mobility - Moved within same county (%) - White
Geographical mobility - Moved within same county (%) - Black or African American
Geographical mobility - Moved within same county (%) - Asian
Geographical mobility - Moved within same county (%) - Hispanic or Latino
Geographical mobility - Moved within same county (%) - American Indian and Alaska Native
Geographical mobility - Moved within same county (%) - Multirace
Geographical mobility - Moved within same county (%) - Other Race
Geographical mobility - Moved from different county within same state (%)
Geographical mobility - Moved from different county within same state (%) - White
Geographical mobility - Moved from different county within same state (%) - Black or African American
Geographical mobility - Moved from different county within same state (%) - Asian
Geographical mobility - Moved from different county within same state (%) - Hispanic or Latino
Geographical mobility - Moved from different county within same state (%) - American Indian and Alaska Native
Geographical mobility - Moved from different county within same state (%) - Multirace
Geographical mobility - Moved from different county within same state (%) - Other Race
Geographical mobility - Moved from different state (%)
Geographical mobility - Moved from different state (%) - White
Geographical mobility - Moved from different state (%) - Black or African American
Geographical mobility - Moved from different state (%) - Asian
Geographical mobility - Moved from different state (%) - Hispanic or Latino
Geographical mobility - Moved from different state (%) - American Indian and Alaska Native
Geographical mobility - Moved from different state (%) - Multirace
Geographical mobility - Moved from different state (%) - Other Race
Geographical mobility - Moved from abroad (%)
Geographical mobility - Moved from abroad (%) - White
Geographical mobility - Moved from abroad (%) - Black or African American
Geographical mobility - Moved from abroad (%) - Asian
Geographical mobility - Moved from abroad (%) - Hispanic or Latino
Geographical mobility - Moved from abroad (%) - American Indian and Alaska Native
Geographical mobility - Moved from abroad (%) - Multirace
Geographical mobility - Moved from abroad (%) - Other Race
Place of birth for the foreign-born population - Ireland (%)
Place of birth for the foreign-born population - Denmark (%)
Place of birth for the foreign-born population - Norway (%)
Place of birth for the foreign-born population - Sweden (%)
Place of birth for the foreign-born population - United Kingdom (%)
Place of birth for the foreign-born population - England (%)
Place of birth for the foreign-born population - Scotland (%)
Place of birth for the foreign-born population - Other Northern Europe (%)
Place of birth for the foreign-born population - Austria (%)
Place of birth for the foreign-born population - Belgium (%)
Place of birth for the foreign-born population - France (%)
Place of birth for the foreign-born population - Germany (%)
Place of birth for the foreign-born population - Netherlands (%)
Place of birth for the foreign-born population - Switzerland (%)
Place of birth for the foreign-born population - Other Western Europe (%)
Place of birth for the foreign-born population - Greece (%)
Place of birth for the foreign-born population - Italy (%)
Place of birth for the foreign-born population - Portugal (%)
Place of birth for the foreign-born population - Spain (%)
Place of birth for the foreign-born population - Other Southern Europe (%)
Place of birth for the foreign-born population - Albania (%)
Place of birth for the foreign-born population - Belarus (%)
Place of birth for the foreign-born population - Bosnia and Herzegovina (%)
Place of birth for the foreign-born population - Bulgaria (%)
Place of birth for the foreign-born population - Croatia (%)
Place of birth for the foreign-born population - Czechoslovakia (%)
Place of birth for the foreign-born population - Hungary (%)
Place of birth for the foreign-born population - Latvia (%)
Place of birth for the foreign-born population - Lithuania (%)
Place of birth for the foreign-born population - North Macedonia (Macedonia) (%)
Place of birth for the foreign-born population - Moldova (%)
Place of birth for the foreign-born population - Poland (%)
Place of birth for the foreign-born population - Romania (%)
Place of birth for the foreign-born population - Russia (%)
Place of birth for the foreign-born population - Serbia (%)
Place of birth for the foreign-born population - Ukraine (%)
Place of birth for the foreign-born population - Other Eastern Europe (%)
Place of birth for the foreign-born population - China (%)
Place of birth for the foreign-born population - Hong Kong (%)
Place of birth for the foreign-born population - Taiwan (%)
Place of birth for the foreign-born population - Japan (%)
Place of birth for the foreign-born population - Korea (%)
Place of birth for the foreign-born population - Other Eastern Asia (%)
Place of birth for the foreign-born population - Afghanistan (%)
Place of birth for the foreign-born population - Bangladesh (%)
Place of birth for the foreign-born population - India (%)
Place of birth for the foreign-born population - Iran (%)
Place of birth for the foreign-born population - Kazakhstan (%)
Place of birth for the foreign-born population - Nepal (%)
Place of birth for the foreign-born population - Pakistan (%)
Place of birth for the foreign-born population - Sri Lanka (%)
Place of birth for the foreign-born population - Uzbekistan (%)
Place of birth for the foreign-born population - Other South Central Asia (%)
Place of birth for the foreign-born population - Burma (%)
Place of birth for the foreign-born population - Cambodia (%)
Place of birth for the foreign-born population - Indonesia (%)
Place of birth for the foreign-born population - Laos (%)
Place of birth for the foreign-born population - Malaysia (%)
Place of birth for the foreign-born population - Philippines (%)
Place of birth for the foreign-born population - Singapore (%)
Place of birth for the foreign-born population - Thailand (%)
Place of birth for the foreign-born population - Vietnam (%)
Place of birth for the foreign-born population - Other South Eastern Asia (%)
Place of birth for the foreign-born population - Armenia (%)
Place of birth for the foreign-born population - Iraq (%)
Place of birth for the foreign-born population - Israel (%)
Place of birth for the foreign-born population - Jordan (%)
Place of birth for the foreign-born population - Kuwait (%)
Place of birth for the foreign-born population - Lebanon (%)
Place of birth for the foreign-born population - Saudi Arabia (%)
Place of birth for the foreign-born population - Syria (%)
Place of birth for the foreign-born population - Turkey (%)
Place of birth for the foreign-born population - Yemen (%)
Place of birth for the foreign-born population - Other Western Asia (%)
Place of birth for the foreign-born population - Eritrea (%)
Place of birth for the foreign-born population - Ethiopia (%)
Place of birth for the foreign-born population - Kenya (%)
Place of birth for the foreign-born population - Somalia (%)
Place of birth for the foreign-born population - Uganda (%)
Place of birth for the foreign-born population - Zimbabwe (%)
Place of birth for the foreign-born population - Other Eastern Africa (%)
Place of birth for the foreign-born population - Cameroon (%)
Place of birth for the foreign-born population - Congo (%)
Place of birth for the foreign-born population - Democratic Republic of Congo (Zaire) (%)
Place of birth for the foreign-born population - Other Middle Africa (%)
Place of birth for the foreign-born population - Egypt (%)
Place of birth for the foreign-born population - Morocco (%)
Place of birth for the foreign-born population - Sudan (%)
Place of birth for the foreign-born population - Other Northern Africa (%)
Place of birth for the foreign-born population - South Africa (%)
Place of birth for the foreign-born population - Other Southern Africa (%)
Place of birth for the foreign-born population - Cabo Verde (%)
Place of birth for the foreign-born population - Ghana (%)
Place of birth for the foreign-born population - Liberia (%)
Place of birth for the foreign-born population - Nigeria (%)
Place of birth for the foreign-born population - Senegal (%)
Place of birth for the foreign-born population - Sierra Leone (%)
Place of birth for the foreign-born population - Other Western Africa (%)
Place of birth for the foreign-born population - Australia (%)
Place of birth for the foreign-born population - New Zealand (%)
Place of birth for the foreign-born population - Fiji (%)
Place of birth for the foreign-born population - Micronesia (%)
Place of birth for the foreign-born population - Bahamas (%)
Place of birth for the foreign-born population - Barbados (%)
Place of birth for the foreign-born population - Cuba (%)
Place of birth for the foreign-born population - Dominica (%)
Place of birth for the foreign-born population - Dominican Republic (%)
Place of birth for the foreign-born population - Grenada (%)
Place of birth for the foreign-born population - Haiti (%)
Place of birth for the foreign-born population - Jamaica (%)
Place of birth for the foreign-born population - St. Vincent and the Grenadines (%)
Place of birth for the foreign-born population - Trinidad and Tobago (%)
Place of birth for the foreign-born population - West Indies (%)
Place of birth for the foreign-born population - Other Caribbean (%)
Place of birth for the foreign-born population - Belize (%)
Place of birth for the foreign-born population - Costa Rica (%)
Place of birth for the foreign-born population - El Salvador (%)
Place of birth for the foreign-born population - Guatemala (%)
Place of birth for the foreign-born population - Honduras (%)
Place of birth for the foreign-born population - Mexico (%)
Place of birth for the foreign-born population - Nicaragua (%)
Place of birth for the foreign-born population - Panama (%)
Place of birth for the foreign-born population - Other Central America (%)
Place of birth for the foreign-born population - Argentina (%)
Place of birth for the foreign-born population - Bolivia (%)
Place of birth for the foreign-born population - Brazil (%)
Place of birth for the foreign-born population - Chile (%)
Place of birth for the foreign-born population - Colombia (%)
Place of birth for the foreign-born population - Ecuador (%)
Place of birth for the foreign-born population - Guyana (%)
Place of birth for the foreign-born population - Peru (%)
Place of birth for the foreign-born population - Uruguay (%)
Place of birth for the foreign-born population - Venezuela (%)
Place of birth for the foreign-born population - Other South America (%)
Place of birth for the foreign-born population - Canada (%)
Place of birth for the foreign-born population - Other Northern America (%)
Place of birth for the foreign-born population - Other (%)
Latest news about races in Richmond, VA collected exclusively by city-data.com from local newspapers, TV, and radio stations
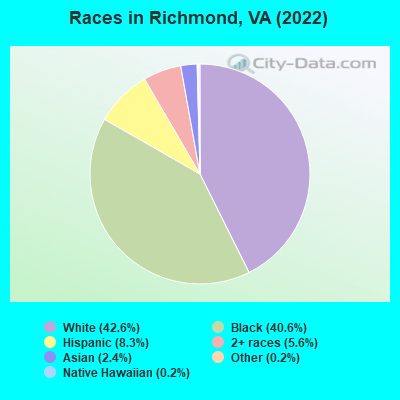
According to 2022 data, the most numerous races in Richmond, VA are White alone (97,829 residents), Black alone (93,198 residents), and Hispanic (19,086 residents). 88.7% of Richmond residents speak English at home. 7.5% of Richmond, VA residents are foreign-born (4.4% born in Latin America, 1.5% born in Asia, 0.8% born in Europe), which is 61.0% less than the foreign-born rate of 12.0% across the entire state of Virginia.
Race distribution in Richmond
2000 2022
112,455 56.9% Black alone 74,506 37.7% White alone 5,074 2.6% Hispanic 2,473 1.3% Two or more races 2,437 1.2% Asian alone 319 0.2% Other race alone 460 0.2% American Indian alone 66 0.03% Native Hawaiian and Other
97,829 42.6% White alone 93,198 40.6% Black alone 19,086 8.3% Hispanic 12,781 5.6% Two or more races 5,511 2.4% Asian alone 467 0.2% Other race alone 349 0.2% Native Hawaiian and Other 174 0.08% American Indian alone
2000 2022
4,965,637 70.2% White alone 1,376,378 19.4% Black alone 329,540 4.7% Hispanic 259,277 3.7% Asian alone 114,022 1.6% Two or more races 18,596 0.3% American Indian alone 11,685 0.2% Other race alone 3,380 0.05% Native Hawaiian and Other
5,095,130 58.7% White alone 1,594,785 18.4% Black alone 905,750 10.4% Hispanic 602,881 6.9% Asian alone 406,047 4.7% Two or more races 60,419 0.7% Other race alone 11,738 0.1% American Indian alone 6,869 0.08% Native Hawaiian and Other
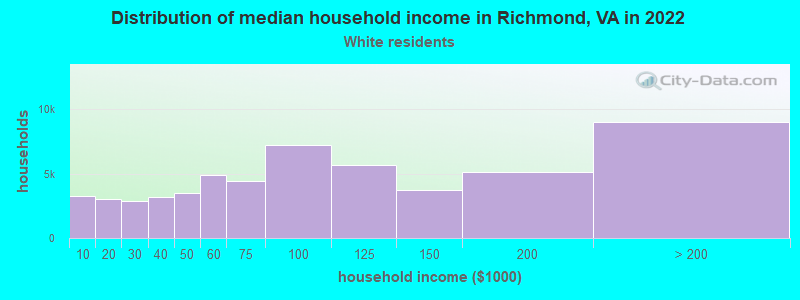
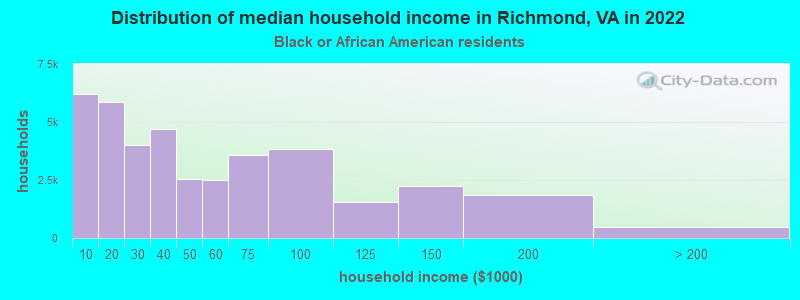
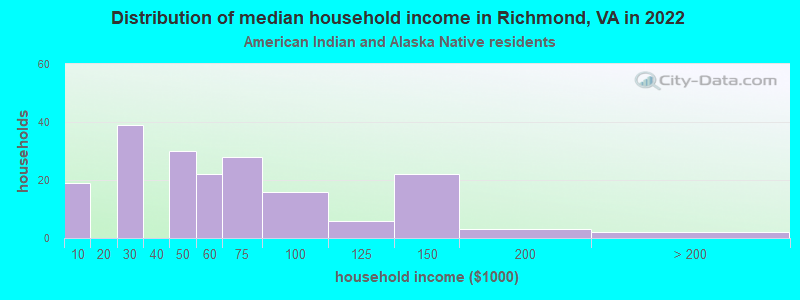
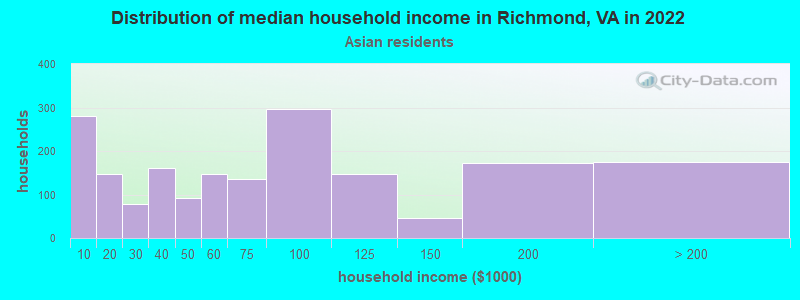
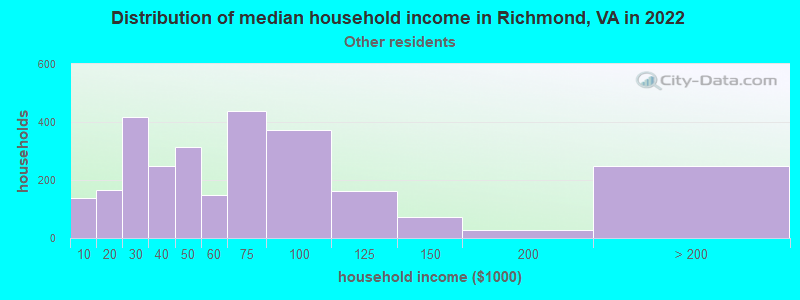
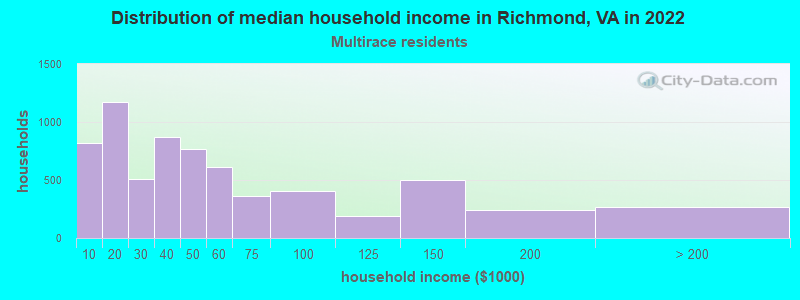
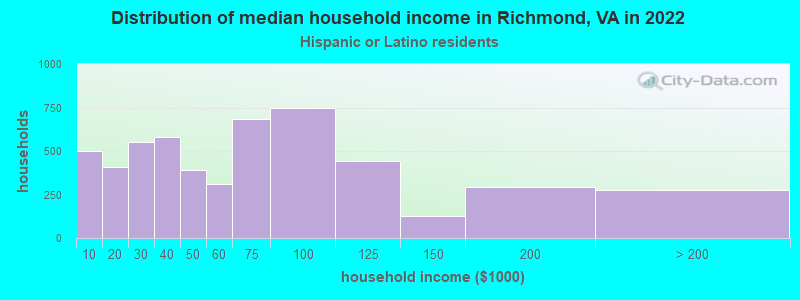
Income and house value in Richmond Median household income in 2022 $81,810 White non-Hispanic householders$37,707 Black householders$75,926 Asian householders$42,420 Some other race householders$39,803 Two or more races householders$43,941 Hispanic or Latino race householdersMedian 2022 house value $517,819 White Non-Hispanic householders$262,282 Black or African American householders$376,956 American Indian or Alaska Native householders $349,180 Asian householders$359,497 Native Hawaiian and other Pacific Islander householders$321,405 Some other race householders$331,324 Two or more races householders$350,767 Hispanic or Latino householders
Median age by race in Richmond
35.9 Median age for White residents36.3 35.5 37.8 Median age for Black or African American residents36.3 39.5 46.3 Median age for American Indian / Alaska Native residents46.3 -666,666,666.0 21.9 Median age for Asian residents23.0 21.0 18.0 Median age for Native Hawaiian / Pacific Islander residents16.2 19.8 27.8 Median age for Other race residents29.5 24.6 25.3 Median age for Two or more races residents23.5 28.4 36.1 Median age for White alone residents36.4 35.7 27.0 Median age for Hispanic or Latino residents28.2 24.2
Owner/renter occupied households by race in Richmond
House owners and renters - White residents 28,531 51.2% Owner occupied27,219 48.8% Renter occupiedHouse owners and renters - Black or African American residents 14,832 37.7% Owner occupied24,525 62.3% Renter occupiedHouse owners and renters - American Indian / Alaska Native residents 60 30.1% Owner occupied140 69.9% Renter occupiedHouse owners and renters - Asian residents 380 26.1% Owner occupied1,078 73.9% Renter occupiedHouse owners and renters - Native Hawaiian / Pacific Islander residents 22 100.0% Renter occupiedHouse owners and renters - Other race residents 687 24.4% Owner occupied2,128 75.6% Renter occupiedHouse owners and renters - Two or more races residents 1,544 23.0% Owner occupied5,181 77.0% Renter occupiedHouse owners and renters - White alone residents 28,237 52.0% Owner occupied26,060 48.0% Renter occupiedHouse owners and renters - Hispanic or Latino residents 1,392 23.2% Owner occupied4,613 76.8% Renter occupied
Language usage in Richmond
English speakers - Total 88.7% of residents of Richmond speak English at home.
7.2% of residents speak Spanish at home 7,480 48.0% Speak English very well8,095 52.0% Speak English less than very well4.1% of residents speak other language at home 5,510 61.9% Speak English very well3,389 38.1% Speak English less than very well
English speakers - Born in the United States 95.1% of residents of Richmond speak English at home.
3.7% of residents speak Spanish at home 2,450 94.2% Speak English very well151 5.8% Speak English less than very well1.2% of residents speak other language at home 762 86.3% Speak English very well121 13.7% Speak English less than very well
English speakers - Native, born elsewhere 70.5% of residents of Richmond speak English at home.
28.4% of residents speak Spanish at home 912 81.6% Speak English very well206 18.4% Speak English less than very well1.1% of residents speak other language at home 43 100.0% Speak English very well
English speakers - Foreign-born 14.8% of residents of Richmond speak English at home.
49.8% of residents speak Spanish at home 2,116 26.2% Speak English very well5,963 73.8% Speak English less than very well35.4% of residents speak other language at home 3,046 53.1% Speak English very well2,686 46.9% Speak English less than very well
White (Caucasian) - Speak only English Native:
96.7% (91,135)Foreign-born:
28.5% (806)
White (Caucasian) - Speak another language Native:
3.3% (3,129)Foreign-born:
71.5% (2,022)
Black or African American - Speak only English Native:
98.6% (83,083)Foreign-born:
17.4% (469)
Black or African American - Speak another language Native:
1.4% (1,215)Foreign-born:
82.6% (2,232)
American Indian / Alaska Native - Speak another language Native:
19.8% (58)Foreign-born:
100.0% (67)
Asian - Speak only English Native:
55.0% (1,528)Foreign-born:
16.9% (477)
Asian - Speak another language Native:
45.0% (1,249)Foreign-born:
83.1% (2,343)
Other race - Speak only English Native:
24.1% (876)Foreign-born:
2.8% (124)
Other race - Speak another language Native:
75.9% (2,763)Foreign-born:
97.2% (4,276)
Two or more races - Speak only English Native:
86.0% (12,444)Foreign-born:
15.2% (526)
Two or more races - Speak another language Native:
14.0% (2,022)Foreign-born:
84.8% (2,938)
White alone - Speak only English Native:
97.4% (90,049)Foreign-born:
35.5% (671)
White alone - Speak another language Native:
2.6% (2,439)Foreign-born:
64.5% (1,220)
Hispanic or Latino - Speak only English Native:
35.9% (3,037)Foreign-born:
3.1% (259)
Hispanic or Latino - Speak another language Native:
64.1% (5,414)Foreign-born:
96.9% (8,016)
Foreign-born residents in Richmond 17,099 residents are foreign born (4.4% Latin America , 1.5% Asia , 0.8% Europe ).
This city:
7.5%Virginia:
12.6%
Marital status for residents in Richmond Marital status - White (Caucasian) population 15 years and over
Males 48.1% Never married39.4% Now married0.5% Separated1.9% Widowed10.1% DivorcedFemales 48.4% Never married35.2% Now married0.5% Separated5.2% Widowed10.8% DivorcedWomen who gave birth in the past 12 months Now married:
100.0% (1,024)Unmarried:
0.0% (0)
Women who did not give birth in the past 12 months Now married:
25.3% (7,521)Unmarried:
74.7% (22,238)
Marital status - Black or African American population 15 years and over
Males 59.5% Never married26.3% Now married2.0% Separated2.8% Widowed9.4% DivorcedFemales 54.1% Never married22.3% Now married3.2% Separated7.6% Widowed12.8% DivorcedWomen who gave birth in the past 12 months Now married:
44.6% (344)Unmarried:
55.4% (428)
Women who did not give birth in the past 12 months Now married:
15.4% (3,718)Unmarried:
84.6% (20,456)
Marital status - American Indian / Alaska Native population 15 years and over
Males 74.3% Never married25.7% Now married0.0% Separated0.0% Widowed0.0% DivorcedFemales 46.1% Never married48.7% Now married5.2% Separated0.0% Widowed0.0% DivorcedWomen who gave birth in the past 12 months Now married:
68.2% (16)Unmarried:
31.8% (7)
Women who did not give birth in the past 12 months Now married:
29.2% (20)Unmarried:
70.8% (49)
Marital status - Asian population 15 years and over
Males 61.6% Never married33.4% Now married2.1% Separated0.0% Widowed2.8% DivorcedFemales 63.3% Never married24.3% Now married1.8% Separated6.0% Widowed4.7% DivorcedWomen who gave birth in the past 12 months Now married:
66.2% (51)Unmarried:
33.8% (26)
Women who did not give birth in the past 12 months Now married:
19.8% (388)Unmarried:
80.2% (1,574)
Marital status - Native Hawaiian / Pacific Islander population 15 years and over
Males 58.9% Never married41.1% Now married0.0% Separated0.0% Widowed0.0% DivorcedFemales 56.8% Never married21.6% Now married0.0% Separated21.6% Widowed0.0% DivorcedWomen who did not give birth in the past 12 months Now married:
0.0% (0)Unmarried:
100.0% (22)
Marital status - Other race population 15 years and over
Males 56.8% Never married30.3% Now married4.4% Separated1.9% Widowed6.6% DivorcedFemales 57.6% Never married31.1% Now married4.1% Separated1.1% Widowed6.1% DivorcedWomen who gave birth in the past 12 months Now married:
48.0% (62)Unmarried:
52.0% (67)
Women who did not give birth in the past 12 months Now married:
32.4% (693)Unmarried:
67.6% (1,445)
Marital status - Two or more races population 15 years and over
Males 69.5% Never married23.2% Now married0.0% Separated2.1% Widowed5.2% DivorcedFemales 56.6% Never married25.3% Now married4.6% Separated4.7% Widowed8.9% DivorcedWomen who gave birth in the past 12 months Now married:
100.0% (131)Unmarried:
0.0% (0)
Women who did not give birth in the past 12 months Now married:
18.7% (1,059)Unmarried:
81.3% (4,592)
Marital status - White alone, not Hispanic / Latino population 15 years and over
Males 48.6% Never married39.2% Now married0.5% Separated1.9% Widowed9.8% DivorcedFemales 47.4% Never married35.7% Now married0.5% Separated5.3% Widowed11.1% DivorcedWomen who gave birth in the past 12 months Now married:
100.0% (1,024)Unmarried:
0.0% (0)
Women who did not give birth in the past 12 months Now married:
25.7% (7,351)Unmarried:
74.3% (21,249)
Marital status - Hispanic or Latino population 15 years and over
Males 49.9% Never married36.2% Now married6.2% Separated0.0% Widowed7.7% DivorcedFemales 57.7% Never married26.0% Now married4.9% Separated3.1% Widowed8.4% DivorcedWomen who gave birth in the past 12 months Now married:
100.0% (170)Unmarried:
0.0% (0)
Women who did not give birth in the past 12 months Now married:
25.1% (1,239)Unmarried:
74.9% (3,691)
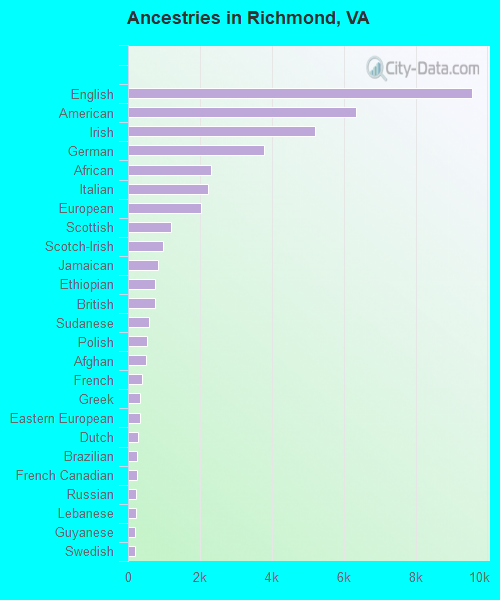
Ancestries in Richmond
9,565 7.7% English6,349 5.1% American5,191 4.2% Irish3,782 3.0% German2,305 1.8% African2,222 1.8% Italian2,026 1.6% European1,193 1.0% Scottish986 0.8% Scotch-Irish828 0.7% Jamaican761 0.6% Ethiopian758 0.6% British591 0.5% Sudanese542 0.4% Polish497 0.4% Afghan393 0.3% French344 0.3% Greek343 0.3% Eastern European277 0.2% Dutch253 0.2% Brazilian238 0.2% French Canadian236 0.2% Russian216 0.2% Lebanese207 0.2% Guyanese185 0.1% Swedish182 0.1% Egyptian178 0.1% Norwegian165 0.1% Nigerian160 0.1% Iranian156 0.1% Barbadian148 0.1% Welsh136 0.1% Sierra Leonean134 0.1% Bahamian129 0.1% Senegalese125 0.1% Haitian124 0.10% West Indian114 0.09% Turkish105 0.08% Lithuanian101 0.08% Danish99 0.08% Swiss96 0.08% Northern European89 0.07% Canadian85 0.07% Armenian84 0.07% Czech74 0.06% Scandinavian72 0.06% Arab62 0.05% Israeli58 0.05% Palestinian57 0.05% Ukrainian55 0.04% Austrian51 0.04% South African50 0.04% Trinidadian and Tobagonian48 0.04% Romanian48 0.04% Hungarian44 0.04% Ghanaian43 0.03% Slovak42 0.03% British West Indian41 0.03% Iraqi40 0.03% Serbian40 0.03% Yugoslavian35 0.03% Somali34 0.03% Slovene34 0.03% Cajun31 0.02% Ugandan29 0.02% New Zealander28 0.02% Croatian26 0.02% Portuguese22 0.02% Estonian20 0.02% Jordanian20 0.02% Belgian19 0.02% Zimbabwean16 0.01% Bulgarian14 0.01% Albanian13 0.01% Celtic13 0.01% Belizean9 0.01% Syrian8 0.01% Finnish8 0.01% Icelander
Geographical mobility in Richmond Same house 1 year ago 78,320 78.7% White (Caucasian)81,734 88.8% Black or African American322 82.9% American Indian / Alaska Native3,468 61.1% Asian68 49.4% Native Hawaiian / Pacific Islander8,037 84.2% Other race14,727 74.2% Two or more races76,460 79.0% White alone, not Hispanic / Latino14,901 78.3% Hispanic or LatinoMoved within same county 9,731 9.8% White / Caucasian5,376 5.8% Black or African American78 20.2% American Indian / Alaska Native584 10.3% Asian340 3.6% Other race1,850 9.3% Two or more races9,442 9.8% White alone, not Hispanic / Latino1,210 6.4% Hispanic or LatinoMoved within same state 7,467 7.5% White / Caucasian3,486 3.8% Black or African American11 2.9% American Indian / Alaska Native1,125 19.8% Asian39 28.6% Native Hawaiian / Pacific Islander622 6.5% Other race1,798 9.1% Two or more races7,085 7.3% White alone, not Hispanic / Latino1,292 6.8% Hispanic or LatinoMoved from different state 3,716 3.7% White / Caucasian1,332 1.4% Black or African American52 0.9% Asian29 21.5% Native Hawaiian / Pacific Islander105 1.1% Other race1,102 5.6% Two or more races3,585 3.7% White alone, not Hispanic / Latino1,198 6.3% Hispanic or LatinoMoved from abroad 279 0.3% White66 0.1% Black or African American451 7.9% Asian455 4.8% Other race368 1.9% Two or more races228 0.2% White alone, not Hispanic / Latino422 2.2% Hispanic or Latino
Children Nativity (place of birth) in Richmond
Children under 6 years - Living with two parents Both parents native 5,203 100.0% NativeBoth parents foreign-born 993 85.7% Native166 14.3% Foreign-bornOne native, one foreign-born parent 543 100.0% NativeChildren under 6 years - Living with one parent Native parent 6,051 100.0% NativeForeign-born parent 795 100.0% NativeChildren 6 to 17 years - Living with two parents Both parents native 6,153 100.0% NativeBoth parents foreign-born 908 32.7% Native1,868 67.3% Foreign-bornOne native, one foreign-born parent 754 100.0% NativeChildren 6 to 17 years - Living with one parent Native parent 8,053 98.5% Native120 1.5% Foreign-bornForeign-born parent 2,286 67.9% Native1,083 32.1% Foreign-born
Place of birth for residents in Richmond 10,317 Americas10,038 Latin America7,798 Central America3,445 Asia1,781 Europe1,500 Africa1,430 South Central Asia1,301 Caribbean938 South America922 Eastern Asia685 South Eastern Asia666 Eastern Africa576 China518 Eastern Europe451 Northern Europe430 Western Europe405 Western Asia373 Southern Europe327 Western Africa278 Northern America251 Middle Africa223 Northern Africa54 Oceania54 Australia and New Zealand Subregion32 Southern Africa3,403 Guatemala1,885 El Salvador1,260 Mexico1,031 Honduras627 India485 Ethiopia465 China353 Jamaica311 Korea310 Afghanistan254 Cuba244 Iran243 Canada239 Brazil233 United Kingdom226 Cameroon220 Germany201 Thailand196 Russia172 Vietnam171 England167 Greece158 Philippines158 Haiti152 Venezuela149 Italy147 Peru141 Egypt131 Guyana126 Trinidad and Tobago125 France120 St. Lucia118 Pakistan114 Sierra Leone114 Colombia108 Senegal98 Turkey98 Taiwan96 Barbados93 Dominican Republic92 Costa Rica90 Nicaragua85 Saudi Arabia81 Sudan77 Bangladesh66 Bosnia and Herzegovina66 Cambodia50 Australia47 Poland43 Chile43 Argentina42 Dominica41 Nigeria41 United Arab Emirates40 Ghana39 Singapore38 Netherlands38 Armenia36 Eritrea36 Lithuania35 Moldova35 Georgia35 Panama33 Lebanon32 South Africa31 Spain31 Zimbabwe28 Ecuador26 Kazakhstan26 Ukraine26 Nepal26 Jordan25 Portugal24 Democratic Republic of Congo (Zaire)23 Iraq23 Malaysia21 Uruguay20 Ivory Coast18 Austria17 Japan17 Serbia15 Ireland14 Burma (Myanmar)14 Latvia14 Switzerland13 Romania13 Belgium12 Hong Kong11 West Indies11 Bolivia9 Laos9 Denmark8 Sweden7 Israel5 Yemen5 Hungary4 New Zealand4 Bulgaria2 Kuwait2 Liberia1 Tanzania1 Congo
Grandparents responsible for own grandchildren in Richmond
Grandparents (30 to 59 years) White / Caucasian 17 29.2% Responsible for grandchildren41 70.8% Not responsible for grandchildrenBlack or African American 358 45.5% Responsible for grandchildren429 54.5% Not responsible for grandchildrenOther race 134 100.0% Responsible for grandchildrenWhite alone, not Hispanic / Latino 17 50.4% Responsible for grandchildren17 49.6% Not responsible for grandchildrenHispanic or Latino 114 79.7% Responsible for grandchildren29 20.3% Not responsible for grandchildrenGrandparents (60 years and over) White / Caucasian 9 6.4% Responsible for grandchildren124 93.6% Not responsible for grandchildrenBlack or African American 395 34.8% Responsible for grandchildren740 65.2% Not responsible for grandchildrenOther race 47 100.0% Responsible for grandchildrenWhite alone, not Hispanic / Latino 9 7.0% Responsible for grandchildren116 93.0% Not responsible for grandchildrenHispanic or Latino 27 35.5% Responsible for grandchildren50 64.5% Not responsible for grandchildren