Races in Rexburg, Idaho (ID) Detailed Stats
Data:
Races - White alone (%)
Races - White alone (% change since 2000)
Races - Black alone (%)
Races - Black alone (% change since 2000)
Races - American Indian alone (%)
Races - American Indian alone (% change since 2000)
Races - Asian alone (%)
Races - Asian alone (% change since 2000)
Races - Hispanic (%)
Races - Hispanic (% change since 2000)
Races - Native Hawaiian and Other Pacific Islander alone (%)
Races - Native Hawaiian and Other Pacific Islander alone (% change since 2000)
Races - Two or more races(%)
Races - Two or more races(% change since 2000)
Races - Other race alone (%)
Races - Other race alone (% change since 2000)
Racial diversity
Place of birth - Born in state of residence (%)
Place of birth - Born in state of residence (%) - White
Place of birth - Born in state of residence (%) - Black or African American
Place of birth - Born in state of residence (%) - Asian
Place of birth - Born in state of residence (%) - Hispanic or Latino
Place of birth - Born in state of residence (%) - American Indian and Alaska Native
Place of birth - Born in state of residence (%) - Multirace
Place of birth - Born in state of residence (%) - Other Race
Place of birth - Born in other state (%)
Place of birth - Born in other state (%) - White
Place of birth - Born in other state (%) - Black or African American
Place of birth - Born in other state (%) - Asian
Place of birth - Born in other state (%) - Hispanic or Latino
Place of birth - Born in other state (%) - American Indian and Alaska Native
Place of birth - Born in other state (%) - Multirace
Place of birth - Born in other state (%) - Other Race
Place of birth - Native, outside of US (%)
Place of birth - Native, outside of US (%) - White
Place of birth - Native, outside of US (%) - Black or African American
Place of birth - Native, outside of US (%) - Asian
Place of birth - Native, outside of US (%) - Hispanic or Latino
Place of birth - Native, outside of US (%) - American Indian and Alaska Native
Place of birth - Native, outside of US (%) - Multirace
Place of birth - Native, outside of US (%) - Other Race
Place of birth - Foreign born (%)
Place of birth - Foreign born (%) - White
Place of birth - Foreign born (%) - Black or African American
Place of birth - Foreign born (%) - Asian
Place of birth - Foreign born (%) - Hispanic or Latino
Place of birth - Foreign born (%) - American Indian and Alaska Native
Place of birth - Foreign born (%) - Multirace
Place of birth - Foreign born (%) - Other Race
Residents speaking English at home (%)
Residents speaking English at home - Born in the United States (%)
Residents speaking English at home - Native, born elsewhere (%)
Residents speaking English at home - Foreign born (%)
Residents speaking Spanish at home (%)
Residents speaking Spanish at home - Born in the United States (%)
Residents speaking Spanish at home - Native, born elsewhere (%)
Residents speaking Spanish at home - Foreign born (%)
Residents speaking other language at home (%)
Residents speaking other language at home - Born in the United States (%)
Residents speaking other language at home - Native, born elsewhere (%)
Residents speaking other language at home - Foreign born (%)
Marital status - Never married (%)
Marital status - Now married (%)
Marital status - Separated (%)
Marital status - Widowed (%)
Marital status - Divorced (%)
Ancestries Reported - Arab (%)
Ancestries Reported - Czech (%)
Ancestries Reported - Danish (%)
Ancestries Reported - Dutch (%)
Ancestries Reported - English (%)
Ancestries Reported - French (%)
Ancestries Reported - French Canadian (%)
Ancestries Reported - German (%)
Ancestries Reported - Greek (%)
Ancestries Reported - Hungarian (%)
Ancestries Reported - Irish (%)
Ancestries Reported - Italian (%)
Ancestries Reported - Lithuanian (%)
Ancestries Reported - Norwegian (%)
Ancestries Reported - Polish (%)
Ancestries Reported - Portuguese (%)
Ancestries Reported - Russian (%)
Ancestries Reported - Scotch-Irish (%)
Ancestries Reported - Scottish (%)
Ancestries Reported - Slovak (%)
Ancestries Reported - Subsaharan African (%)
Ancestries Reported - Swedish (%)
Ancestries Reported - Swiss (%)
Ancestries Reported - Ukrainian (%)
Ancestries Reported - United States (%)
Ancestries Reported - Welsh (%)
Ancestries Reported - West Indian (%)
Ancestries Reported - Other (%)
Geographical mobility - Same house 1 year ago (%)
Geographical mobility - Same house 1 year ago (%) - White
Geographical mobility - Same house 1 year ago (%) - Black or African American
Geographical mobility - Same house 1 year ago (%) - Asian
Geographical mobility - Same house 1 year ago (%) - Hispanic or Latino
Geographical mobility - Same house 1 year ago (%) - American Indian and Alaska Native
Geographical mobility - Same house 1 year ago (%) - Multirace
Geographical mobility - Same house 1 year ago (%) - Other Race
Geographical mobility - Moved within same county (%)
Geographical mobility - Moved within same county (%) - White
Geographical mobility - Moved within same county (%) - Black or African American
Geographical mobility - Moved within same county (%) - Asian
Geographical mobility - Moved within same county (%) - Hispanic or Latino
Geographical mobility - Moved within same county (%) - American Indian and Alaska Native
Geographical mobility - Moved within same county (%) - Multirace
Geographical mobility - Moved within same county (%) - Other Race
Geographical mobility - Moved from different county within same state (%)
Geographical mobility - Moved from different county within same state (%) - White
Geographical mobility - Moved from different county within same state (%) - Black or African American
Geographical mobility - Moved from different county within same state (%) - Asian
Geographical mobility - Moved from different county within same state (%) - Hispanic or Latino
Geographical mobility - Moved from different county within same state (%) - American Indian and Alaska Native
Geographical mobility - Moved from different county within same state (%) - Multirace
Geographical mobility - Moved from different county within same state (%) - Other Race
Geographical mobility - Moved from different state (%)
Geographical mobility - Moved from different state (%) - White
Geographical mobility - Moved from different state (%) - Black or African American
Geographical mobility - Moved from different state (%) - Asian
Geographical mobility - Moved from different state (%) - Hispanic or Latino
Geographical mobility - Moved from different state (%) - American Indian and Alaska Native
Geographical mobility - Moved from different state (%) - Multirace
Geographical mobility - Moved from different state (%) - Other Race
Geographical mobility - Moved from abroad (%)
Geographical mobility - Moved from abroad (%) - White
Geographical mobility - Moved from abroad (%) - Black or African American
Geographical mobility - Moved from abroad (%) - Asian
Geographical mobility - Moved from abroad (%) - Hispanic or Latino
Geographical mobility - Moved from abroad (%) - American Indian and Alaska Native
Geographical mobility - Moved from abroad (%) - Multirace
Geographical mobility - Moved from abroad (%) - Other Race
Place of birth for the foreign-born population - Ireland (%)
Place of birth for the foreign-born population - Denmark (%)
Place of birth for the foreign-born population - Norway (%)
Place of birth for the foreign-born population - Sweden (%)
Place of birth for the foreign-born population - United Kingdom (%)
Place of birth for the foreign-born population - England (%)
Place of birth for the foreign-born population - Scotland (%)
Place of birth for the foreign-born population - Other Northern Europe (%)
Place of birth for the foreign-born population - Austria (%)
Place of birth for the foreign-born population - Belgium (%)
Place of birth for the foreign-born population - France (%)
Place of birth for the foreign-born population - Germany (%)
Place of birth for the foreign-born population - Netherlands (%)
Place of birth for the foreign-born population - Switzerland (%)
Place of birth for the foreign-born population - Other Western Europe (%)
Place of birth for the foreign-born population - Greece (%)
Place of birth for the foreign-born population - Italy (%)
Place of birth for the foreign-born population - Portugal (%)
Place of birth for the foreign-born population - Spain (%)
Place of birth for the foreign-born population - Other Southern Europe (%)
Place of birth for the foreign-born population - Albania (%)
Place of birth for the foreign-born population - Belarus (%)
Place of birth for the foreign-born population - Bosnia and Herzegovina (%)
Place of birth for the foreign-born population - Bulgaria (%)
Place of birth for the foreign-born population - Croatia (%)
Place of birth for the foreign-born population - Czechoslovakia (%)
Place of birth for the foreign-born population - Hungary (%)
Place of birth for the foreign-born population - Latvia (%)
Place of birth for the foreign-born population - Lithuania (%)
Place of birth for the foreign-born population - North Macedonia (Macedonia) (%)
Place of birth for the foreign-born population - Moldova (%)
Place of birth for the foreign-born population - Poland (%)
Place of birth for the foreign-born population - Romania (%)
Place of birth for the foreign-born population - Russia (%)
Place of birth for the foreign-born population - Serbia (%)
Place of birth for the foreign-born population - Ukraine (%)
Place of birth for the foreign-born population - Other Eastern Europe (%)
Place of birth for the foreign-born population - China (%)
Place of birth for the foreign-born population - Hong Kong (%)
Place of birth for the foreign-born population - Taiwan (%)
Place of birth for the foreign-born population - Japan (%)
Place of birth for the foreign-born population - Korea (%)
Place of birth for the foreign-born population - Other Eastern Asia (%)
Place of birth for the foreign-born population - Afghanistan (%)
Place of birth for the foreign-born population - Bangladesh (%)
Place of birth for the foreign-born population - India (%)
Place of birth for the foreign-born population - Iran (%)
Place of birth for the foreign-born population - Kazakhstan (%)
Place of birth for the foreign-born population - Nepal (%)
Place of birth for the foreign-born population - Pakistan (%)
Place of birth for the foreign-born population - Sri Lanka (%)
Place of birth for the foreign-born population - Uzbekistan (%)
Place of birth for the foreign-born population - Other South Central Asia (%)
Place of birth for the foreign-born population - Burma (%)
Place of birth for the foreign-born population - Cambodia (%)
Place of birth for the foreign-born population - Indonesia (%)
Place of birth for the foreign-born population - Laos (%)
Place of birth for the foreign-born population - Malaysia (%)
Place of birth for the foreign-born population - Philippines (%)
Place of birth for the foreign-born population - Singapore (%)
Place of birth for the foreign-born population - Thailand (%)
Place of birth for the foreign-born population - Vietnam (%)
Place of birth for the foreign-born population - Other South Eastern Asia (%)
Place of birth for the foreign-born population - Armenia (%)
Place of birth for the foreign-born population - Iraq (%)
Place of birth for the foreign-born population - Israel (%)
Place of birth for the foreign-born population - Jordan (%)
Place of birth for the foreign-born population - Kuwait (%)
Place of birth for the foreign-born population - Lebanon (%)
Place of birth for the foreign-born population - Saudi Arabia (%)
Place of birth for the foreign-born population - Syria (%)
Place of birth for the foreign-born population - Turkey (%)
Place of birth for the foreign-born population - Yemen (%)
Place of birth for the foreign-born population - Other Western Asia (%)
Place of birth for the foreign-born population - Eritrea (%)
Place of birth for the foreign-born population - Ethiopia (%)
Place of birth for the foreign-born population - Kenya (%)
Place of birth for the foreign-born population - Somalia (%)
Place of birth for the foreign-born population - Uganda (%)
Place of birth for the foreign-born population - Zimbabwe (%)
Place of birth for the foreign-born population - Other Eastern Africa (%)
Place of birth for the foreign-born population - Cameroon (%)
Place of birth for the foreign-born population - Congo (%)
Place of birth for the foreign-born population - Democratic Republic of Congo (Zaire) (%)
Place of birth for the foreign-born population - Other Middle Africa (%)
Place of birth for the foreign-born population - Egypt (%)
Place of birth for the foreign-born population - Morocco (%)
Place of birth for the foreign-born population - Sudan (%)
Place of birth for the foreign-born population - Other Northern Africa (%)
Place of birth for the foreign-born population - South Africa (%)
Place of birth for the foreign-born population - Other Southern Africa (%)
Place of birth for the foreign-born population - Cabo Verde (%)
Place of birth for the foreign-born population - Ghana (%)
Place of birth for the foreign-born population - Liberia (%)
Place of birth for the foreign-born population - Nigeria (%)
Place of birth for the foreign-born population - Senegal (%)
Place of birth for the foreign-born population - Sierra Leone (%)
Place of birth for the foreign-born population - Other Western Africa (%)
Place of birth for the foreign-born population - Australia (%)
Place of birth for the foreign-born population - New Zealand (%)
Place of birth for the foreign-born population - Fiji (%)
Place of birth for the foreign-born population - Micronesia (%)
Place of birth for the foreign-born population - Bahamas (%)
Place of birth for the foreign-born population - Barbados (%)
Place of birth for the foreign-born population - Cuba (%)
Place of birth for the foreign-born population - Dominica (%)
Place of birth for the foreign-born population - Dominican Republic (%)
Place of birth for the foreign-born population - Grenada (%)
Place of birth for the foreign-born population - Haiti (%)
Place of birth for the foreign-born population - Jamaica (%)
Place of birth for the foreign-born population - St. Vincent and the Grenadines (%)
Place of birth for the foreign-born population - Trinidad and Tobago (%)
Place of birth for the foreign-born population - West Indies (%)
Place of birth for the foreign-born population - Other Caribbean (%)
Place of birth for the foreign-born population - Belize (%)
Place of birth for the foreign-born population - Costa Rica (%)
Place of birth for the foreign-born population - El Salvador (%)
Place of birth for the foreign-born population - Guatemala (%)
Place of birth for the foreign-born population - Honduras (%)
Place of birth for the foreign-born population - Mexico (%)
Place of birth for the foreign-born population - Nicaragua (%)
Place of birth for the foreign-born population - Panama (%)
Place of birth for the foreign-born population - Other Central America (%)
Place of birth for the foreign-born population - Argentina (%)
Place of birth for the foreign-born population - Bolivia (%)
Place of birth for the foreign-born population - Brazil (%)
Place of birth for the foreign-born population - Chile (%)
Place of birth for the foreign-born population - Colombia (%)
Place of birth for the foreign-born population - Ecuador (%)
Place of birth for the foreign-born population - Guyana (%)
Place of birth for the foreign-born population - Peru (%)
Place of birth for the foreign-born population - Uruguay (%)
Place of birth for the foreign-born population - Venezuela (%)
Place of birth for the foreign-born population - Other South America (%)
Place of birth for the foreign-born population - Canada (%)
Place of birth for the foreign-born population - Other Northern America (%)
Place of birth for the foreign-born population - Other (%)
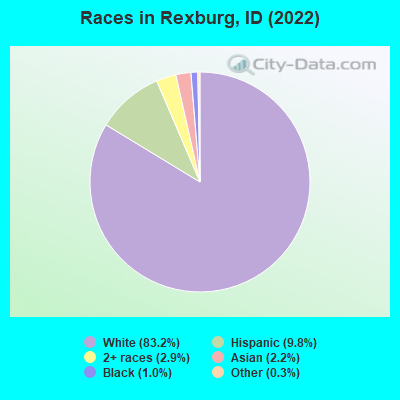
According to 2022 data, the most numerous races in Rexburg, ID are White alone (33,779 residents), Hispanic (3,964 residents), and Two or more races (1,179 residents). 87.9% of Rexburg residents speak English at home. 4.6% of Rexburg, ID residents are foreign-born (2.6% born in Latin America, 1.2% born in Asia), which is 9.7% less than the foreign-born rate of 5.0% across the entire state of Idaho.
Race distribution in Rexburg
2000 2022
1,139,291 88.0% White alone 101,690 7.9% Hispanic 18,261 1.4% Two or more races 15,789 1.2% American Indian alone 11,641 0.9% Asian alone 4,889 0.4% Black alone 1,192 0.09% Other race alone 1,200 0.09% Native Hawaiian and Other
1,531,219 79.0% White alone 261,921 13.5% Hispanic 81,112 4.2% Two or more races 25,174 1.3% Asian alone 15,825 0.8% American Indian alone 11,868 0.6% Black alone 8,752 0.5% Other race alone 3,162 0.2% Native Hawaiian and Other
Income and house value in Rexburg Median household income in 2022 $47,257 White non-Hispanic householders$76,725 Black householders$56,756 Asian householders$56,312 Some other race householders$34,197 Two or more races householders$37,481 Hispanic or Latino race householdersMedian 2022 house value $475,391 White Non-Hispanic householders$378,709 American Indian or Alaska Native householders$289,601 Hispanic or Latino householders
Median age by race in Rexburg
21.6 Median age for White residents23.0 20.5 27.6 Median age for Black or African American residents25.8 30.5 37.4 Median age for American Indian / Alaska Native residents-708,860,758.8 34.1 29.0 Median age for Asian residents31.7 23.7 -393,939,393.5 Median age for Native Hawaiian / Pacific Islander residents-355,119,825.4 -679,245,282.3 25.0 Median age for Other race residents29.5 23.8 22.0 Median age for Two or more races residents20.7 22.2 21.3 Median age for White alone residents22.8 20.1 23.4 Median age for Hispanic or Latino residents23.3 23.1
Owner/renter occupied households by race in Rexburg
House owners and renters - White residents 2,123 26.8% Owner occupied5,791 73.2% Renter occupiedHouse owners and renters - Black or African American residents 185 100.0% Renter occupiedHouse owners and renters - Asian residents 122 38.5% Owner occupied195 61.5% Renter occupiedHouse owners and renters - Other race residents 246 100.0% Renter occupiedHouse owners and renters - Two or more races residents 80 14.5% Owner occupied475 85.5% Renter occupiedHouse owners and renters - White alone residents 2,050 26.4% Owner occupied5,720 73.6% Renter occupiedHouse owners and renters - Hispanic or Latino residents 135 26.1% Owner occupied383 73.9% Renter occupied
Language usage in Rexburg
English speakers - Total 87.9% of residents of Rexburg speak English at home.
7.7% of residents speak Spanish at home 2,750 94.0% Speak English very well177 6.0% Speak English less than very well4.4% of residents speak other language at home 1,416 84.3% Speak English very well263 15.7% Speak English less than very well
English speakers - Born in the United States 92.1% of residents of Rexburg speak English at home.
6.7% of residents speak Spanish at home 1,714 98.4% Speak English very well28 1.6% Speak English less than very well1.4% of residents speak other language at home 337 95.5% Speak English very well16 4.5% Speak English less than very well
English speakers - Native, born elsewhere 86.4% of residents of Rexburg speak English at home.
6.3% of residents speak other language at home 12 100.0% Speak English very well
English speakers - Foreign-born 19.1% of residents of Rexburg speak English at home.
32.3% of residents speak Spanish at home 495 77.6% Speak English very well143 22.4% Speak English less than very well50.4% of residents speak other language at home 760 76.4% Speak English very well235 23.6% Speak English less than very well
White (Caucasian) - Speak only English Native:
95.4% (30,459)Foreign-born:
24.7% (114)
White (Caucasian) - Speak another language Native:
4.3% (1,359)Foreign-born:
75.9% (350)
Black or African American - Speak only English Native:
78.4% (165)Foreign-born:
68.3% (131)
Black or African American - Speak another language Native:
15.8% (33)Foreign-born:
35.1% (68)
Asian - Speak only English Native:
58.1% (252)Foreign-born:
16.6% (75)
Asian - Speak another language Native:
37.4% (162)Foreign-born:
82.3% (374)
Other race - Speak only English Native:
45.1% (406)Foreign-born:
12.0% (56)
Other race - Speak another language Native:
54.6% (492)Foreign-born:
88.2% (408)
Two or more races - Speak only English Native:
68.3% (1,540)Foreign-born:
6.9% (29)
Two or more races - Speak another language Native:
34.1% (769)Foreign-born:
92.1% (382)
White alone - Speak only English Native:
95.3% (29,951)Foreign-born:
30.0% (99)
White alone - Speak another language Native:
4.7% (1,474)Foreign-born:
77.2% (256)
Hispanic or Latino - Speak only English Native:
59.1% (1,649)Foreign-born:
13.1% (98)
Hispanic or Latino - Speak another language Native:
40.9% (1,141)Foreign-born:
87.4% (653)
Foreign-born residents in Rexburg 1,850 residents are foreign born (2.6% Latin America , 1.2% Asia ).
Marital status for residents in Rexburg Marital status - White (Caucasian) population 15 years and over
Males 54.8% Never married43.7% Now married0.7% Separated0.3% Widowed0.5% DivorcedFemales 66.7% Never married29.6% Now married0.1% Separated1.6% Widowed2.0% DivorcedWomen who gave birth in the past 12 months Now married:
96.3% (529)Unmarried:
3.7% (20)
Women who did not give birth in the past 12 months Now married:
24.4% (3,741)Unmarried:
75.6% (11,563)
Marital status - Black or African American population 15 years and over
Males 28.0% Never married70.0% Now married0.0% Separated0.0% Widowed2.0% DivorcedFemales 50.2% Never married49.8% Now married0.0% Separated0.0% Widowed0.0% DivorcedWomen who did not give birth in the past 12 months Now married:
49.8% (98)Unmarried:
50.2% (99)
Marital status - Asian population 15 years and over
Males 16.2% Never married83.8% Now married0.0% Separated0.0% Widowed0.0% DivorcedFemales 57.7% Never married38.7% Now married0.0% Separated3.6% Widowed0.0% DivorcedWomen who gave birth in the past 12 months Now married:
100.0% (68)Unmarried:
0.0% (0)
Women who did not give birth in the past 12 months Now married:
31.0% (139)Unmarried:
69.0% (308)
Marital status - Other race population 15 years and over
Males 51.8% Never married48.2% Now married0.0% Separated0.0% Widowed0.0% DivorcedFemales 88.7% Never married7.3% Now married0.0% Separated0.0% Widowed3.9% DivorcedWomen who gave birth in the past 12 months Now married:
100.0% (24)Unmarried:
0.0% (0)
Women who did not give birth in the past 12 months Now married:
4.8% (37)Unmarried:
95.2% (730)
Marital status - Two or more races population 15 years and over
Males 65.1% Never married34.9% Now married0.0% Separated0.0% Widowed0.0% DivorcedFemales 34.7% Never married61.6% Now married0.0% Separated3.7% Widowed0.0% DivorcedWomen who gave birth in the past 12 months Now married:
100.0% (103)Unmarried:
0.0% (0)
Women who did not give birth in the past 12 months Now married:
59.7% (513)Unmarried:
40.3% (347)
Marital status - White alone, not Hispanic / Latino population 15 years and over
Males 54.4% Never married44.1% Now married0.7% Separated0.3% Widowed0.5% DivorcedFemales 67.8% Never married28.3% Now married0.1% Separated1.6% Widowed2.1% DivorcedWomen who gave birth in the past 12 months Now married:
95.9% (482)Unmarried:
4.1% (21)
Women who did not give birth in the past 12 months Now married:
23.1% (3,474)Unmarried:
76.9% (11,596)
Marital status - Hispanic or Latino population 15 years and over
Males 66.4% Never married32.7% Now married0.3% Separated0.0% Widowed0.6% DivorcedFemales 62.1% Never married34.5% Now married0.0% Separated1.6% Widowed1.8% DivorcedWomen who gave birth in the past 12 months Now married:
100.0% (83)Unmarried:
0.0% (0)
Women who did not give birth in the past 12 months Now married:
32.4% (539)Unmarried:
67.6% (1,121)
Ancestries in Rexburg
5,195 32.1% English2,309 14.3% American1,474 9.1% European786 4.9% German417 2.6% Irish415 2.6% Scottish306 1.9% Danish228 1.4% Italian187 1.2% Scandinavian172 1.1% Swedish158 1.0% British147 0.9% Norwegian141 0.9% Dutch124 0.8% Swiss76 0.5% Armenian76 0.5% African72 0.4% Haitian58 0.4% Russian49 0.3% French45 0.3% Scotch-Irish44 0.3% Welsh31 0.2% Ukrainian26 0.2% Canadian20 0.1% Portuguese15 0.09% Austrian15 0.09% Brazilian12 0.07% Polish11 0.07% Northern European10 0.06% Albanian8 0.05% Czech2 0.01% Ghanaian
Geographical mobility in Rexburg Same house 1 year ago 16,441 48.9% White (Caucasian)145 36.5% Black or African American17 47.7% American Indian / Alaska Native491 54.0% Asian25 100.0% Native Hawaiian / Pacific Islander703 51.7% Other race1,977 63.1% Two or more races16,056 48.5% White alone, not Hispanic / Latino2,272 57.9% Hispanic or LatinoMoved within same county 4,516 13.4% White / Caucasian61 15.4% Black or African American130 14.3% Asian65 4.7% Other race174 5.6% Two or more races4,489 13.6% White alone, not Hispanic / Latino251 6.4% Hispanic or LatinoMoved within same state 2,701 8.0% White / Caucasian4 1.1% Black or African American148 10.9% Other race466 14.9% Two or more races2,732 8.3% White alone, not Hispanic / Latino451 11.5% Hispanic or LatinoMoved from different state 8,836 26.3% White / Caucasian19 51.9% American Indian / Alaska Native126 13.9% Asian172 12.7% Other race482 15.4% Two or more races8,712 26.3% White alone, not Hispanic / Latino583 14.9% Hispanic or LatinoMoved from abroad 555 1.6% White200 50.4% Black or African American183 20.2% Asian229 16.9% Other race461 1.4% White alone, not Hispanic / Latino208 5.3% Hispanic or Latino
Children Nativity (place of birth) in Rexburg
Children under 6 years - Living with two parents Both parents native 2,370 100.0% NativeBoth parents foreign-born 115 80.4% Native28 19.6% Foreign-bornOne native, one foreign-born parent 196 100.0% NativeChildren under 6 years - Living with one parent Native parent 121 100.0% NativeForeign-born parent 10 100.0% NativeChildren 6 to 17 years - Living with two parents Both parents native 2,579 100.0% NativeBoth parents foreign-born 65 41.6% Native91 58.4% Foreign-bornOne native, one foreign-born parent 150 100.0% NativeChildren 6 to 17 years - Living with one parent Native parent 325 100.0% NativeForeign-born parent 11 51.1% Native11 48.9% Foreign-born
Grandparents responsible for own grandchildren in Rexburg
Grandparents (30 to 59 years) White / Caucasian 40 100.0% Not responsible for grandchildrenWhite alone, not Hispanic / Latino 40 100.0% Not responsible for grandchildrenGrandparents (60 years and over) White / Caucasian 45 37.7% Responsible for grandchildren75 62.3% Not responsible for grandchildrenWhite alone, not Hispanic / Latino 45 36.8% Responsible for grandchildren78 63.2% Not responsible for grandchildren