Races in Redding, Connecticut (CT) Detailed Stats
Ancestries, Foreign-born residents, place of birth

Discuss Redding, Connecticut races on our local forum with over 2,400,000 registered users
9.8% of Redding, CT residents are foreign-born (5.5% born in Europe, 2.0% born in Asia), which is 53.3% less than the foreign-born rate of 15.0% across the entire state of Connecticut.
Race distribution in Redding

- 7,85595.0%White alone
- 1471.8%Asian alone
- 1221.5%Hispanic
- 630.8%Two or more races
- 610.7%Black alone
- 170.2%Other race alone
- 50.06%American Indian alone

2000
2022
-
- 2,638,84577.5%White alone
- 320,3239.4%Hispanic
- 295,5718.7%Black alone
- 81,5642.4%Asian alone
- 52,8961.6%Two or more races
- 8,1410.2%Other race alone
- 7,2670.2%American Indian alone
- 9580.03%Native Hawaiian and Other
Pacific Islander alone

-
- 2,246,91362.0%White alone
- 658,97818.2%Hispanic
- 353,9739.8%Black alone
- 172,9294.8%Asian alone
- 159,6314.4%Two or more races
- 29,7610.8%Other race alone
- 3,4280.09%American Indian alone
- 5920.02%Native Hawaiian and Other
Pacific Islander alone

Income and house value in Redding
- Median household income in 2022
- $180,995White non-Hispanic householders
- $111,395Black householders
- over $200,000Asian householders
- $144,732Some other race householders
- over $200,000Two or more races householders
- $53,203Hispanic or Latino race householders
- Median 2022 house value
- $850,921White Non-Hispanic householders
- $594,520Black or African American householders
- $921,614Asian householders
- $756,662Some other race householders
- over $1,000,000Two or more races householders
- $895,672Hispanic or Latino householders
Household income for White non-Hispanic householders

Household income for Black householders

Household income for Asian householders

Household income for Two or more races householders

Household income for Hispanic or Latino race householders

Foreign-born residents in Redding
809 residents are foreign born (5.5% Europe, 2.0% Asia).
| This city: | 9.8% |
| Connecticut: | 10.9% |
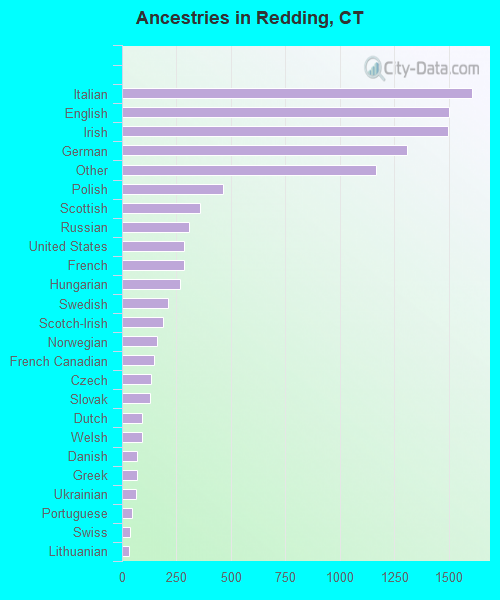
Ancestries in Redding

- 1,60515.2%Italian
- 1,50014.2%English
- 1,49914.2%Irish
- 1,30912.4%German
- 1,16711.0%Other
- 4654.4%Polish
- 3573.4%Scottish
- 3062.9%Russian
- 2852.7%United States
- 2842.7%French
- 2662.5%Hungarian
- 2102.0%Swedish
- 1891.8%Scotch-Irish
- 1631.5%Norwegian
- 1491.4%French Canadian
- 1341.3%Czech
- 1271.2%Slovak
- 920.9%Dutch
- 910.9%Welsh
- 710.7%Danish
- 670.6%Greek
- 640.6%Ukrainian
- 480.5%Portuguese
- 390.4%Swiss
- 330.3%Lithuanian
- 270.3%West Indian
- 250.2%Arab
- 60.06%Subsaharan African
Zip codes: 06896.