Races in Rawlins, Wyoming (WY) Detailed Stats
Data:
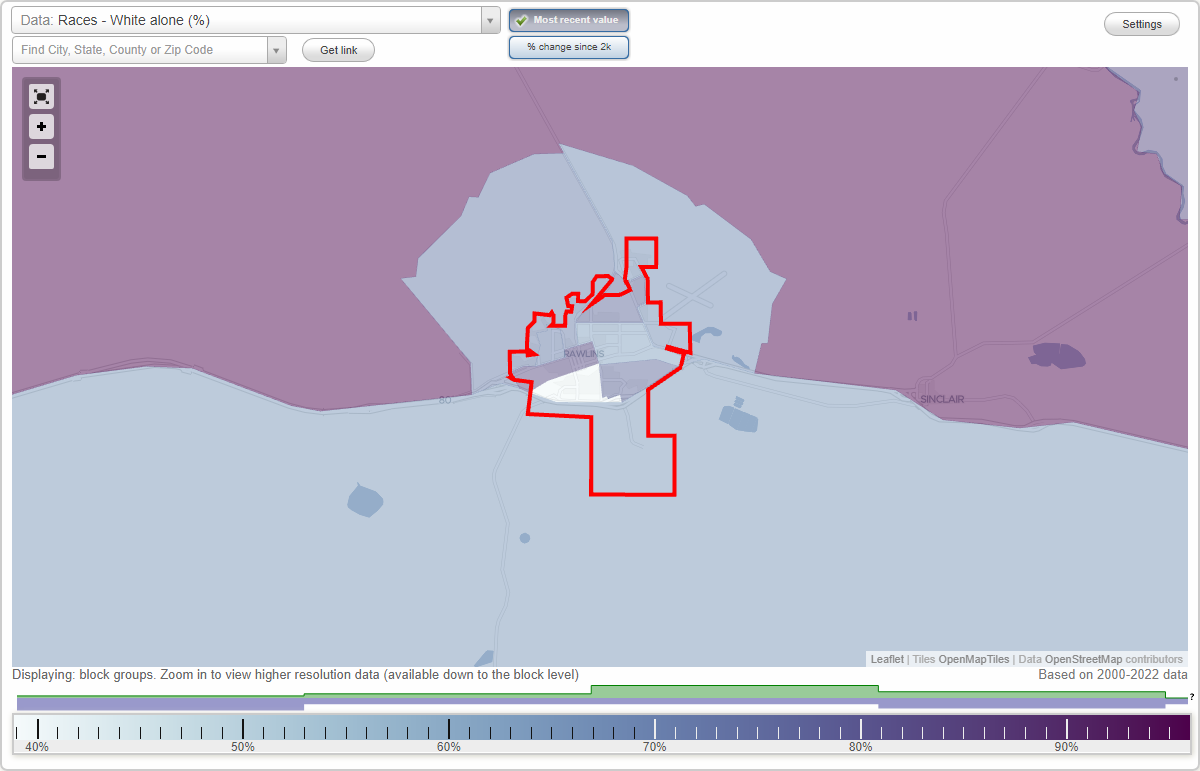
Races - White alone (%)
Races - White alone (% change since 2000)
Races - Black alone (%)
Races - Black alone (% change since 2000)
Races - American Indian alone (%)
Races - American Indian alone (% change since 2000)
Races - Asian alone (%)
Races - Asian alone (% change since 2000)
Races - Hispanic (%)
Races - Hispanic (% change since 2000)
Races - Native Hawaiian and Other Pacific Islander alone (%)
Races - Native Hawaiian and Other Pacific Islander alone (% change since 2000)
Races - Two or more races(%)
Races - Two or more races(% change since 2000)
Races - Other race alone (%)
Races - Other race alone (% change since 2000)
Racial diversity
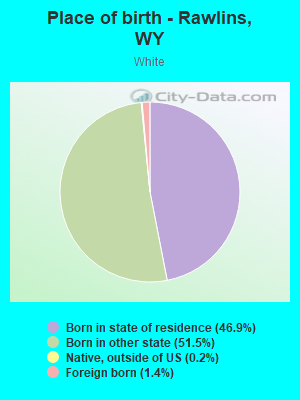
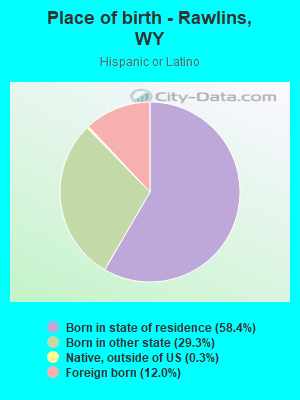
Place of birth - Born in state of residence (%)
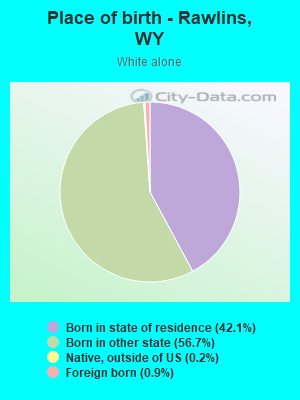
Place of birth - Born in state of residence (%) - White
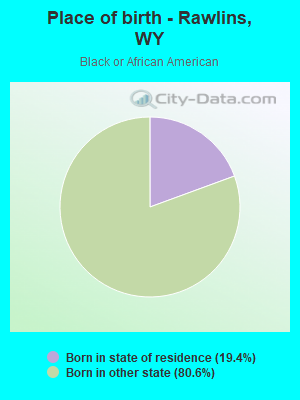
Place of birth - Born in state of residence (%) - Black or African American
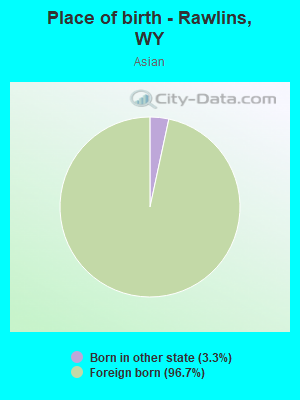
Place of birth - Born in state of residence (%) - Asian
Place of birth - Born in state of residence (%) - Hispanic or Latino
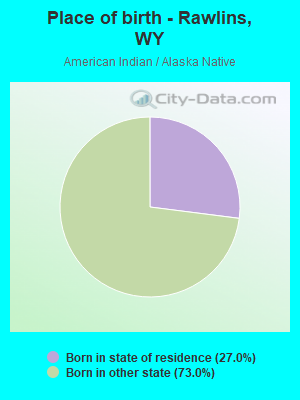
Place of birth - Born in state of residence (%) - American Indian and Alaska Native
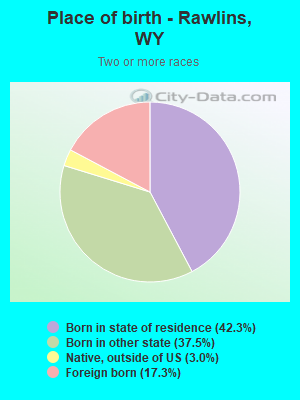
Place of birth - Born in state of residence (%) - Multirace
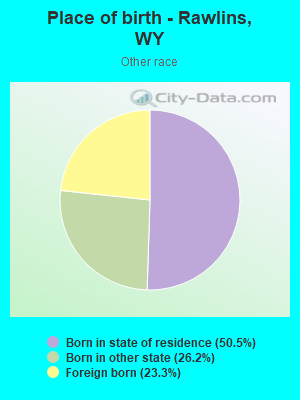
Place of birth - Born in state of residence (%) - Other Race
Place of birth - Born in other state (%)
Place of birth - Born in other state (%) - White
Place of birth - Born in other state (%) - Black or African American
Place of birth - Born in other state (%) - Asian
Place of birth - Born in other state (%) - Hispanic or Latino
Place of birth - Born in other state (%) - American Indian and Alaska Native
Place of birth - Born in other state (%) - Multirace
Place of birth - Born in other state (%) - Other Race
Place of birth - Native, outside of US (%)
Place of birth - Native, outside of US (%) - White
Place of birth - Native, outside of US (%) - Black or African American
Place of birth - Native, outside of US (%) - Asian
Place of birth - Native, outside of US (%) - Hispanic or Latino
Place of birth - Native, outside of US (%) - American Indian and Alaska Native
Place of birth - Native, outside of US (%) - Multirace
Place of birth - Native, outside of US (%) - Other Race
Place of birth - Foreign born (%)
Place of birth - Foreign born (%) - White
Place of birth - Foreign born (%) - Black or African American
Place of birth - Foreign born (%) - Asian
Place of birth - Foreign born (%) - Hispanic or Latino
Place of birth - Foreign born (%) - American Indian and Alaska Native
Place of birth - Foreign born (%) - Multirace
Place of birth - Foreign born (%) - Other Race
Residents speaking English at home (%)
Residents speaking English at home - Born in the United States (%)
Residents speaking English at home - Native, born elsewhere (%)
Residents speaking English at home - Foreign born (%)
Residents speaking Spanish at home (%)
Residents speaking Spanish at home - Born in the United States (%)
Residents speaking Spanish at home - Native, born elsewhere (%)
Residents speaking Spanish at home - Foreign born (%)
Residents speaking other language at home (%)
Residents speaking other language at home - Born in the United States (%)
Residents speaking other language at home - Native, born elsewhere (%)
Residents speaking other language at home - Foreign born (%)
Marital status - Never married (%)
Marital status - Now married (%)
Marital status - Separated (%)
Marital status - Widowed (%)
Marital status - Divorced (%)
Ancestries Reported - Arab (%)
Ancestries Reported - Czech (%)
Ancestries Reported - Danish (%)
Ancestries Reported - Dutch (%)
Ancestries Reported - English (%)
Ancestries Reported - French (%)
Ancestries Reported - French Canadian (%)
Ancestries Reported - German (%)
Ancestries Reported - Greek (%)
Ancestries Reported - Hungarian (%)
Ancestries Reported - Irish (%)
Ancestries Reported - Italian (%)
Ancestries Reported - Lithuanian (%)
Ancestries Reported - Norwegian (%)
Ancestries Reported - Polish (%)
Ancestries Reported - Portuguese (%)
Ancestries Reported - Russian (%)
Ancestries Reported - Scotch-Irish (%)
Ancestries Reported - Scottish (%)
Ancestries Reported - Slovak (%)
Ancestries Reported - Subsaharan African (%)
Ancestries Reported - Swedish (%)
Ancestries Reported - Swiss (%)
Ancestries Reported - Ukrainian (%)
Ancestries Reported - United States (%)
Ancestries Reported - Welsh (%)
Ancestries Reported - West Indian (%)
Ancestries Reported - Other (%)
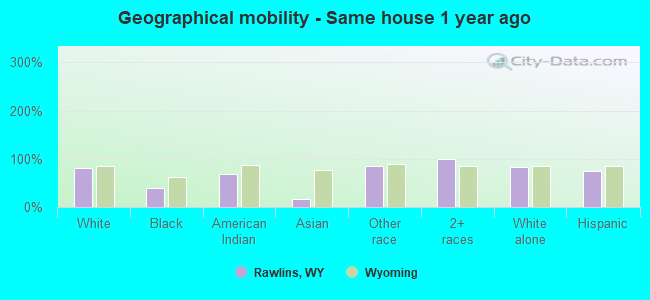
Geographical mobility - Same house 1 year ago (%)
Geographical mobility - Same house 1 year ago (%) - White
Geographical mobility - Same house 1 year ago (%) - Black or African American
Geographical mobility - Same house 1 year ago (%) - Asian
Geographical mobility - Same house 1 year ago (%) - Hispanic or Latino
Geographical mobility - Same house 1 year ago (%) - American Indian and Alaska Native
Geographical mobility - Same house 1 year ago (%) - Multirace
Geographical mobility - Same house 1 year ago (%) - Other Race
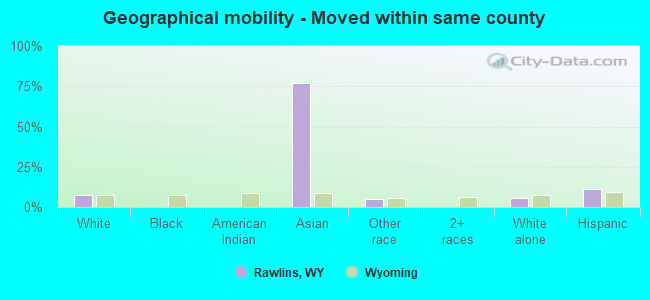
Geographical mobility - Moved within same county (%)
Geographical mobility - Moved within same county (%) - White
Geographical mobility - Moved within same county (%) - Black or African American
Geographical mobility - Moved within same county (%) - Asian
Geographical mobility - Moved within same county (%) - Hispanic or Latino
Geographical mobility - Moved within same county (%) - American Indian and Alaska Native
Geographical mobility - Moved within same county (%) - Multirace
Geographical mobility - Moved within same county (%) - Other Race
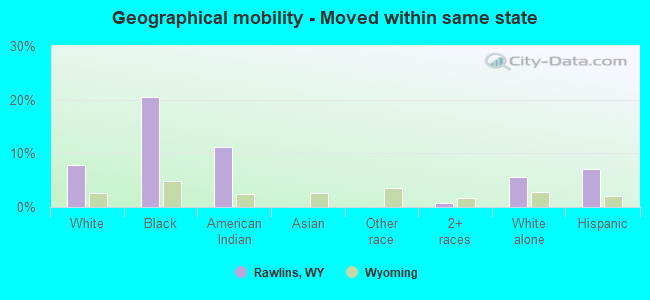
Geographical mobility - Moved from different county within same state (%)
Geographical mobility - Moved from different county within same state (%) - White
Geographical mobility - Moved from different county within same state (%) - Black or African American
Geographical mobility - Moved from different county within same state (%) - Asian
Geographical mobility - Moved from different county within same state (%) - Hispanic or Latino
Geographical mobility - Moved from different county within same state (%) - American Indian and Alaska Native
Geographical mobility - Moved from different county within same state (%) - Multirace
Geographical mobility - Moved from different county within same state (%) - Other Race
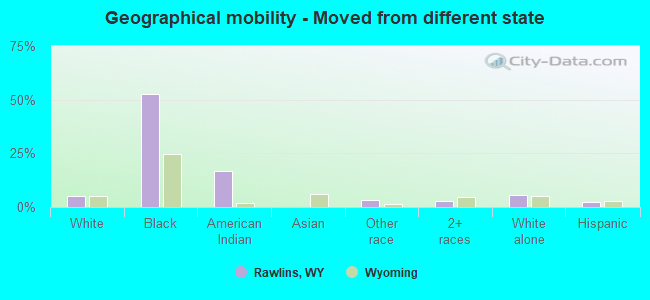
Geographical mobility - Moved from different state (%)
Geographical mobility - Moved from different state (%) - White
Geographical mobility - Moved from different state (%) - Black or African American
Geographical mobility - Moved from different state (%) - Asian
Geographical mobility - Moved from different state (%) - Hispanic or Latino
Geographical mobility - Moved from different state (%) - American Indian and Alaska Native
Geographical mobility - Moved from different state (%) - Multirace
Geographical mobility - Moved from different state (%) - Other Race
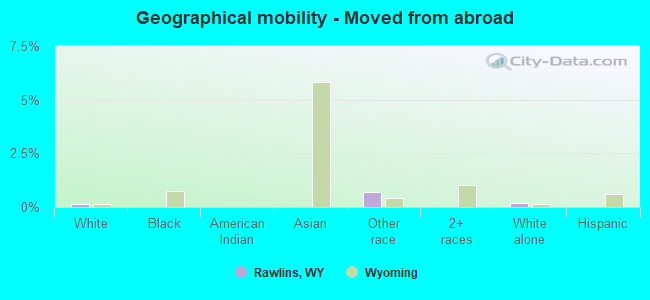
Geographical mobility - Moved from abroad (%)
Geographical mobility - Moved from abroad (%) - White
Geographical mobility - Moved from abroad (%) - Black or African American
Geographical mobility - Moved from abroad (%) - Asian
Geographical mobility - Moved from abroad (%) - Hispanic or Latino
Geographical mobility - Moved from abroad (%) - American Indian and Alaska Native
Geographical mobility - Moved from abroad (%) - Multirace
Geographical mobility - Moved from abroad (%) - Other Race
Place of birth for the foreign-born population - Ireland (%)
Place of birth for the foreign-born population - Denmark (%)
Place of birth for the foreign-born population - Norway (%)
Place of birth for the foreign-born population - Sweden (%)
Place of birth for the foreign-born population - United Kingdom (%)
Place of birth for the foreign-born population - England (%)
Place of birth for the foreign-born population - Scotland (%)
Place of birth for the foreign-born population - Other Northern Europe (%)
Place of birth for the foreign-born population - Austria (%)
Place of birth for the foreign-born population - Belgium (%)
Place of birth for the foreign-born population - France (%)
Place of birth for the foreign-born population - Germany (%)
Place of birth for the foreign-born population - Netherlands (%)
Place of birth for the foreign-born population - Switzerland (%)
Place of birth for the foreign-born population - Other Western Europe (%)
Place of birth for the foreign-born population - Greece (%)
Place of birth for the foreign-born population - Italy (%)
Place of birth for the foreign-born population - Portugal (%)
Place of birth for the foreign-born population - Spain (%)
Place of birth for the foreign-born population - Other Southern Europe (%)
Place of birth for the foreign-born population - Albania (%)
Place of birth for the foreign-born population - Belarus (%)
Place of birth for the foreign-born population - Bosnia and Herzegovina (%)
Place of birth for the foreign-born population - Bulgaria (%)
Place of birth for the foreign-born population - Croatia (%)
Place of birth for the foreign-born population - Czechoslovakia (%)
Place of birth for the foreign-born population - Hungary (%)
Place of birth for the foreign-born population - Latvia (%)
Place of birth for the foreign-born population - Lithuania (%)
Place of birth for the foreign-born population - North Macedonia (Macedonia) (%)
Place of birth for the foreign-born population - Moldova (%)
Place of birth for the foreign-born population - Poland (%)
Place of birth for the foreign-born population - Romania (%)
Place of birth for the foreign-born population - Russia (%)
Place of birth for the foreign-born population - Serbia (%)
Place of birth for the foreign-born population - Ukraine (%)
Place of birth for the foreign-born population - Other Eastern Europe (%)
Place of birth for the foreign-born population - China (%)
Place of birth for the foreign-born population - Hong Kong (%)
Place of birth for the foreign-born population - Taiwan (%)
Place of birth for the foreign-born population - Japan (%)
Place of birth for the foreign-born population - Korea (%)
Place of birth for the foreign-born population - Other Eastern Asia (%)
Place of birth for the foreign-born population - Afghanistan (%)
Place of birth for the foreign-born population - Bangladesh (%)
Place of birth for the foreign-born population - India (%)
Place of birth for the foreign-born population - Iran (%)
Place of birth for the foreign-born population - Kazakhstan (%)
Place of birth for the foreign-born population - Nepal (%)
Place of birth for the foreign-born population - Pakistan (%)
Place of birth for the foreign-born population - Sri Lanka (%)
Place of birth for the foreign-born population - Uzbekistan (%)
Place of birth for the foreign-born population - Other South Central Asia (%)
Place of birth for the foreign-born population - Burma (%)
Place of birth for the foreign-born population - Cambodia (%)
Place of birth for the foreign-born population - Indonesia (%)
Place of birth for the foreign-born population - Laos (%)
Place of birth for the foreign-born population - Malaysia (%)
Place of birth for the foreign-born population - Philippines (%)
Place of birth for the foreign-born population - Singapore (%)
Place of birth for the foreign-born population - Thailand (%)
Place of birth for the foreign-born population - Vietnam (%)
Place of birth for the foreign-born population - Other South Eastern Asia (%)
Place of birth for the foreign-born population - Armenia (%)
Place of birth for the foreign-born population - Iraq (%)
Place of birth for the foreign-born population - Israel (%)
Place of birth for the foreign-born population - Jordan (%)
Place of birth for the foreign-born population - Kuwait (%)
Place of birth for the foreign-born population - Lebanon (%)
Place of birth for the foreign-born population - Saudi Arabia (%)
Place of birth for the foreign-born population - Syria (%)
Place of birth for the foreign-born population - Turkey (%)
Place of birth for the foreign-born population - Yemen (%)
Place of birth for the foreign-born population - Other Western Asia (%)
Place of birth for the foreign-born population - Eritrea (%)
Place of birth for the foreign-born population - Ethiopia (%)
Place of birth for the foreign-born population - Kenya (%)
Place of birth for the foreign-born population - Somalia (%)
Place of birth for the foreign-born population - Uganda (%)
Place of birth for the foreign-born population - Zimbabwe (%)
Place of birth for the foreign-born population - Other Eastern Africa (%)
Place of birth for the foreign-born population - Cameroon (%)
Place of birth for the foreign-born population - Congo (%)
Place of birth for the foreign-born population - Democratic Republic of Congo (Zaire) (%)
Place of birth for the foreign-born population - Other Middle Africa (%)
Place of birth for the foreign-born population - Egypt (%)
Place of birth for the foreign-born population - Morocco (%)
Place of birth for the foreign-born population - Sudan (%)
Place of birth for the foreign-born population - Other Northern Africa (%)
Place of birth for the foreign-born population - South Africa (%)
Place of birth for the foreign-born population - Other Southern Africa (%)
Place of birth for the foreign-born population - Cabo Verde (%)
Place of birth for the foreign-born population - Ghana (%)
Place of birth for the foreign-born population - Liberia (%)
Place of birth for the foreign-born population - Nigeria (%)
Place of birth for the foreign-born population - Senegal (%)
Place of birth for the foreign-born population - Sierra Leone (%)
Place of birth for the foreign-born population - Other Western Africa (%)
Place of birth for the foreign-born population - Australia (%)
Place of birth for the foreign-born population - New Zealand (%)
Place of birth for the foreign-born population - Fiji (%)
Place of birth for the foreign-born population - Micronesia (%)
Place of birth for the foreign-born population - Bahamas (%)
Place of birth for the foreign-born population - Barbados (%)
Place of birth for the foreign-born population - Cuba (%)
Place of birth for the foreign-born population - Dominica (%)
Place of birth for the foreign-born population - Dominican Republic (%)
Place of birth for the foreign-born population - Grenada (%)
Place of birth for the foreign-born population - Haiti (%)
Place of birth for the foreign-born population - Jamaica (%)
Place of birth for the foreign-born population - St. Vincent and the Grenadines (%)
Place of birth for the foreign-born population - Trinidad and Tobago (%)
Place of birth for the foreign-born population - West Indies (%)
Place of birth for the foreign-born population - Other Caribbean (%)
Place of birth for the foreign-born population - Belize (%)
Place of birth for the foreign-born population - Costa Rica (%)
Place of birth for the foreign-born population - El Salvador (%)
Place of birth for the foreign-born population - Guatemala (%)
Place of birth for the foreign-born population - Honduras (%)
Place of birth for the foreign-born population - Mexico (%)
Place of birth for the foreign-born population - Nicaragua (%)
Place of birth for the foreign-born population - Panama (%)
Place of birth for the foreign-born population - Other Central America (%)
Place of birth for the foreign-born population - Argentina (%)
Place of birth for the foreign-born population - Bolivia (%)
Place of birth for the foreign-born population - Brazil (%)
Place of birth for the foreign-born population - Chile (%)
Place of birth for the foreign-born population - Colombia (%)
Place of birth for the foreign-born population - Ecuador (%)
Place of birth for the foreign-born population - Guyana (%)
Place of birth for the foreign-born population - Peru (%)
Place of birth for the foreign-born population - Uruguay (%)
Place of birth for the foreign-born population - Venezuela (%)
Place of birth for the foreign-born population - Other South America (%)
Place of birth for the foreign-born population - Canada (%)
Place of birth for the foreign-born population - Other Northern America (%)
Place of birth for the foreign-born population - Other (%)
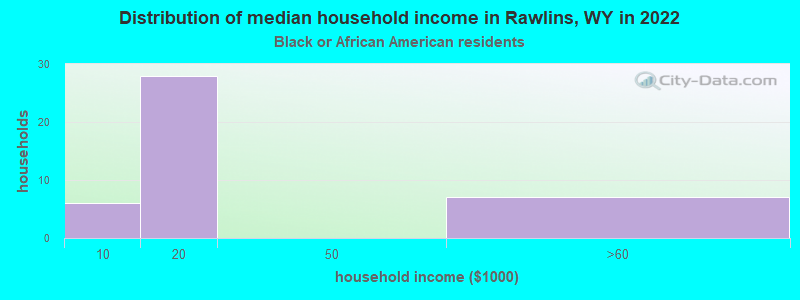
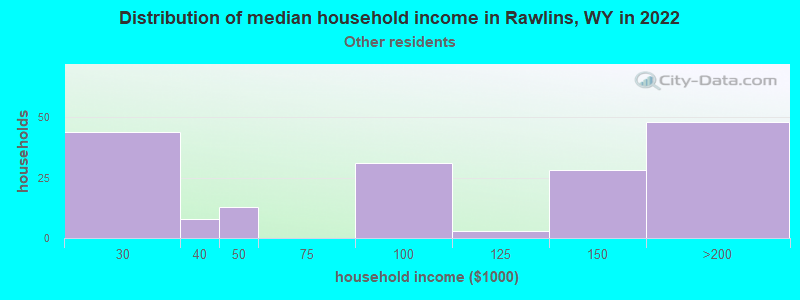
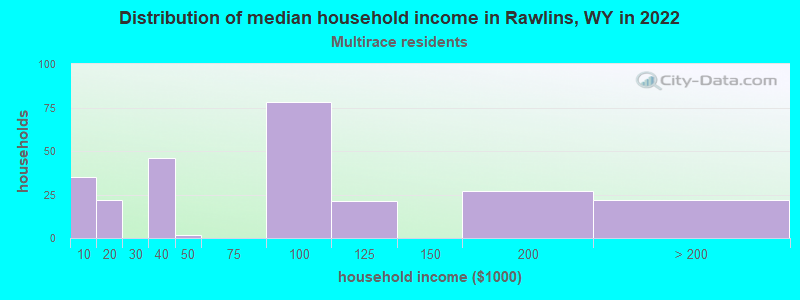
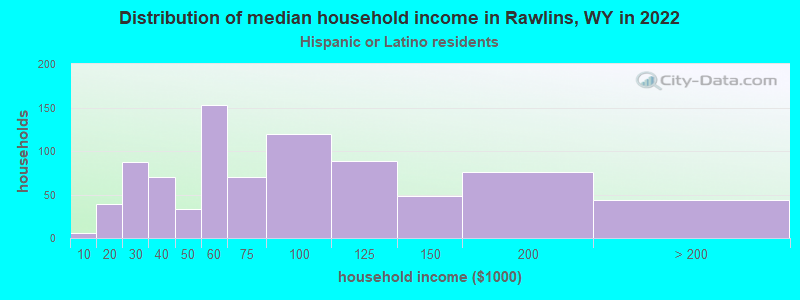
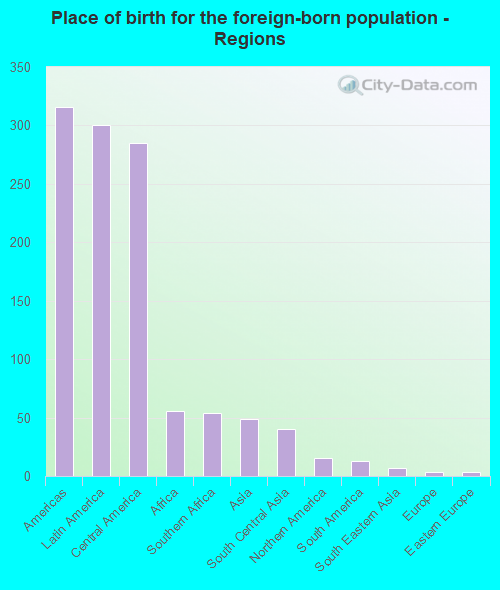
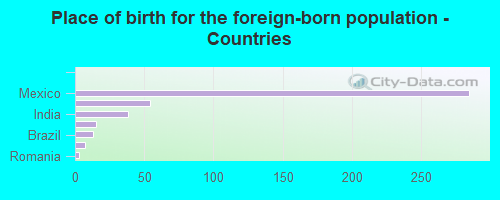
According to 2022 data, the most numerous races in Rawlins, WY are White alone (5,633 residents), Hispanic (2,173 residents), and Two or more races (147 residents). 86.8% of Rawlins residents speak English at home. 5.1% of Rawlins, WY residents are foreign-born (3.6% born in Latin America, 0.7% born in Africa, 0.6% born in Asia), which is 41.2% greater than the foreign-born rate of 3.0% across the entire state of Wyoming.
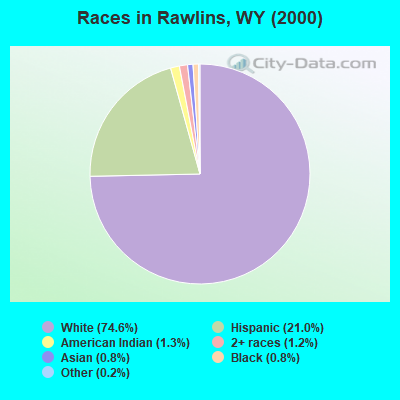
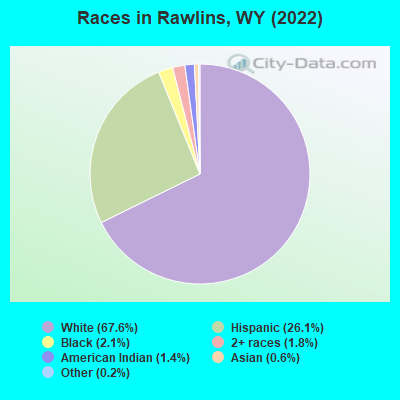
Race distribution in Rawlins
2000 2022
438,799 88.9% White alone 31,669 6.4% Hispanic 10,238 2.1% American Indian alone 6,164 1.2% Two or more races 3,504 0.7% Black alone 2,670 0.5% Asian alone 474 0.10% Other race alone 264 0.05% Native Hawaiian and Other
473,220 81.4% White alone 62,803 10.8% Hispanic 22,911 3.9% Two or more races 9,589 1.6% American Indian alone 4,997 0.9% Other race alone 3,990 0.7% Black alone 3,577 0.6% Asian alone 294 0.05% Native Hawaiian and Other
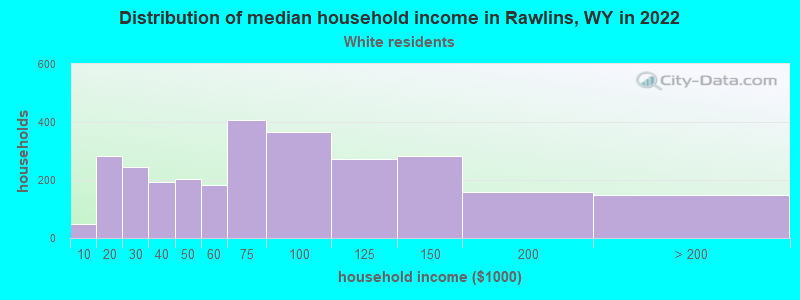
Income and house value in Rawlins Median household income in 2022 $69,218 White non-Hispanic householders$16,300 Black householders$64,114 Hispanic or Latino race householdersMedian 2022 house value $248,830 White Non-Hispanic householders$81,083 Black or African American householders $506,196 Asian householders$244,234 Some other race householders$209,109 Two or more races householders$217,316 Hispanic or Latino householders
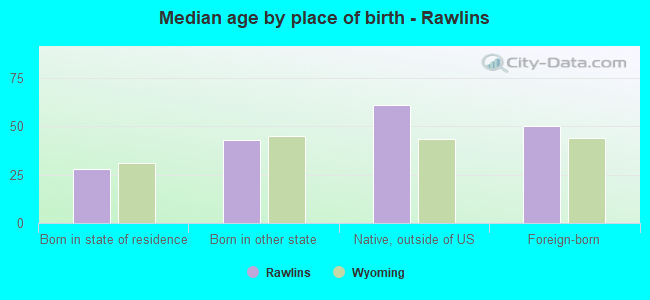
Median age by race in Rawlins
36.9 Median age for White residents34.3 41.0 13.2 Median age for Black or African American residents23.9 8.7 32.8 Median age for American Indian / Alaska Native residents30.1 30.7 54.1 Median age for Asian residents-684,684,684.0 61.8 -594,708,994.1 Median age for Native Hawaiian / Pacific Islander residents-652,729,383.8 -865,828,091.4 34.4 Median age for Other race residents52.9 16.9 58.2 Median age for Two or more races residents56.2 62.3 37.6 Median age for White alone residents36.6 40.5 36.0 Median age for Hispanic or Latino residents33.4 48.8
Owner/renter occupied households by race in Rawlins
House owners and renters - White residents 1,926 69.6% Owner occupied842 30.4% Renter occupiedHouse owners and renters - Black or African American residents 39 100.0% Renter occupiedHouse owners and renters - American Indian / Alaska Native residents 11 100.0% Owner occupiedHouse owners and renters - Asian residents 23 100.0% Renter occupiedHouse owners and renters - Other race residents 95 54.6% Owner occupied79 45.4% Renter occupiedHouse owners and renters - Two or more races residents 314 89.8% Owner occupied36 10.2% Renter occupiedHouse owners and renters - White alone residents 1,670 71.0% Owner occupied682 29.0% Renter occupiedHouse owners and renters - Hispanic or Latino residents 571 69.6% Owner occupied250 30.4% Renter occupied
Language usage in Rawlins
English speakers - Total 86.8% of residents of Rawlins speak English at home.
11.3% of residents speak Spanish at home 737 82.4% Speak English very well157 17.6% Speak English less than very well1.7% of residents speak other language at home 114 82.0% Speak English very well25 18.0% Speak English less than very well
English speakers - Born in the United States 91.7% of residents of Rawlins speak English at home.
7.2% of residents speak Spanish at home 277 95.2% Speak English very well14 4.8% Speak English less than very well1.0% of residents speak other language at home 40 100.0% Speak English very well
English speakers - Native, born elsewhere 54.5% of residents of Rawlins speak English at home.
36.4% of residents speak Spanish at home 8 100.0% Speak English very well
English speakers - Foreign-born 2.4% of residents of Rawlins speak English at home.
71.7% of residents speak Spanish at home 147 54.6% Speak English very well122 45.4% Speak English less than very well26.4% of residents speak other language at home 70 70.7% Speak English very well29 29.3% Speak English less than very well
White (Caucasian) - Speak only English Native:
95.1% (6,065)Foreign-born:
6.4% (6)
White (Caucasian) - Speak another language Native:
3.6% (232)Foreign-born:
83.2% (79)
Asian - Speak another language Native:
100.0% (1)Foreign-born:
82.9% (49)
Other race - Speak only English Native:
62.1% (224)Foreign-born:
1.5% (2)
Other race - Speak another language Native:
37.5% (135)Foreign-born:
99.9% (123)
Two or more races - Speak another language Native:
44.8% (265)Foreign-born:
100.0% (121)
White alone - Speak only English Native:
98.8% (5,252)Foreign-born:
13.6% (7)
White alone - Speak another language Native:
1.2% (65)Foreign-born:
88.4% (45)
Hispanic or Latino - Speak only English Native:
67.3% (1,234)Foreign-born:
0.8% (2)
Hispanic or Latino - Speak another language Native:
32.7% (600)Foreign-born:
100.0% (262)
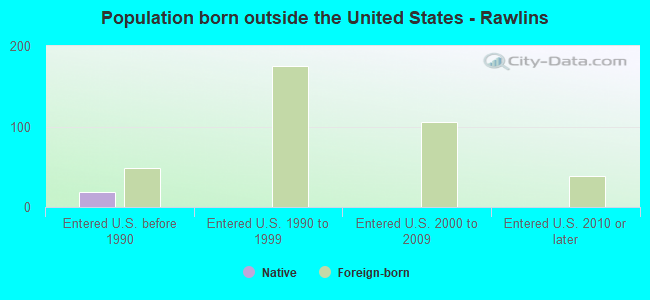
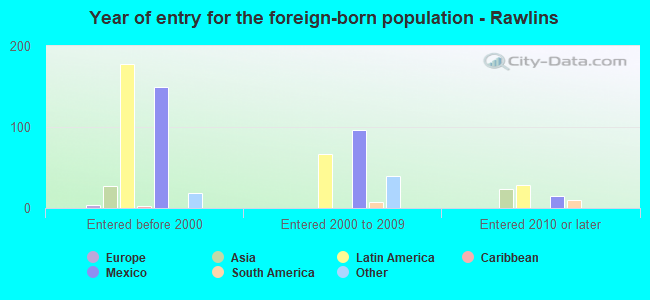
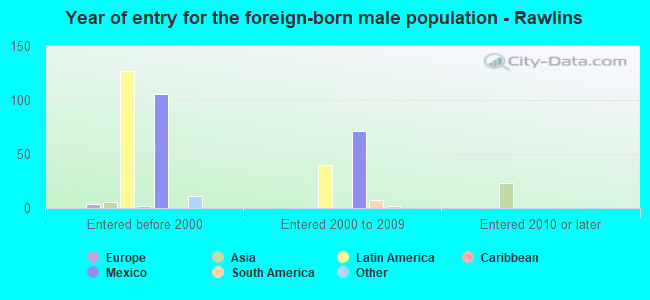
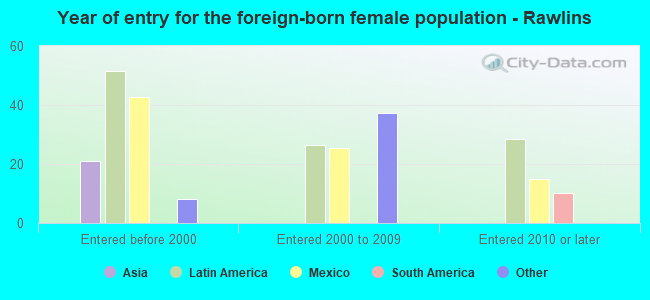
Foreign-born residents in Rawlins 425 residents are foreign born (3.6% Latin America , 0.7% Africa , 0.6% Asia ).
This city:
5.1%Wyoming:
3.4%
Marital status for residents in Rawlins Marital status - White (Caucasian) population 15 years and over
Males 41.2% Never married41.7% Now married3.0% Separated0.3% Widowed13.9% DivorcedFemales 36.1% Never married47.4% Now married1.3% Separated5.2% Widowed10.0% DivorcedWomen who gave birth in the past 12 months Now married:
34.6% (35)Unmarried:
65.4% (66)
Women who did not give birth in the past 12 months Now married:
41.2% (581)Unmarried:
58.8% (830)
Marital status - Black or African American population 15 years and over
Males 56.5% Never married26.1% Now married0.0% Separated0.0% Widowed17.4% DivorcedFemales 23.4% Never married14.9% Now married53.2% Separated0.0% Widowed8.5% DivorcedWomen who gave birth in the past 12 months Now married:
100.0% (7)Unmarried:
0.0% (0)
Women who did not give birth in the past 12 months Now married:
80.6% (24)Unmarried:
19.4% (6)
Marital status - American Indian / Alaska Native population 15 years and over
Males 89.6% Never married0.0% Now married2.6% Separated0.0% Widowed7.8% DivorcedFemales 0.0% Never married32.4% Now married0.0% Separated21.6% Widowed45.9% DivorcedWomen who did not give birth in the past 12 months Now married:
41.4% (11)Unmarried:
58.6% (16)
Marital status - Asian population 15 years and over
Males 0.0% Never married90.5% Now married0.0% Separated9.5% Widowed0.0% DivorcedFemales 0.0% Never married100.0% Now married0.0% Separated0.0% Widowed0.0% DivorcedWomen who did not give birth in the past 12 months Now married:
100.0% (19)Unmarried:
0.0% (0)
Marital status - Other race population 15 years and over
Males 27.6% Never married58.8% Now married0.0% Separated0.0% Widowed13.5% DivorcedFemales 21.6% Never married78.4% Now married0.0% Separated0.0% Widowed0.0% DivorcedWomen who gave birth in the past 12 months Now married:
100.0% (12)Unmarried:
0.0% (0)
Women who did not give birth in the past 12 months Now married:
67.2% (54)Unmarried:
32.8% (26)
Marital status - Two or more races population 15 years and over
Males 14.5% Never married57.5% Now married1.4% Separated0.0% Widowed26.6% DivorcedFemales 9.5% Never married81.1% Now married0.0% Separated0.0% Widowed9.5% DivorcedWomen who did not give birth in the past 12 months Now married:
70.2% (88)Unmarried:
29.8% (37)
Marital status - White alone, not Hispanic / Latino population 15 years and over
Males 35.0% Never married47.0% Now married2.5% Separated0.3% Widowed15.2% DivorcedFemales 31.7% Never married52.3% Now married1.6% Separated5.8% Widowed8.5% DivorcedWomen who gave birth in the past 12 months Now married:
38.3% (35)Unmarried:
61.7% (57)
Women who did not give birth in the past 12 months Now married:
50.3% (578)Unmarried:
49.7% (571)
Marital status - Hispanic or Latino population 15 years and over
Males 51.2% Never married34.6% Now married3.5% Separated0.0% Widowed10.7% DivorcedFemales 41.4% Never married44.0% Now married0.0% Separated1.4% Widowed13.2% DivorcedWomen who gave birth in the past 12 months Now married:
50.0% (10)Unmarried:
50.0% (10)
Women who did not give birth in the past 12 months Now married:
22.6% (94)Unmarried:
77.4% (321)
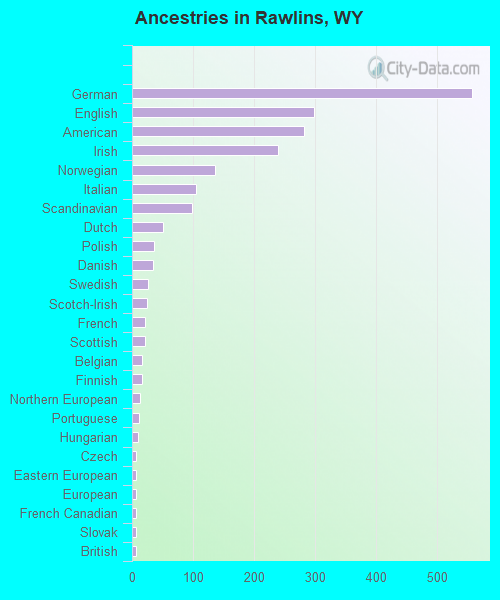
Ancestries in Rawlins
557 16.0% German298 8.6% English281 8.1% American240 6.9% Irish136 3.9% Norwegian105 3.0% Italian98 2.8% Scandinavian50 1.4% Dutch36 1.0% Polish35 1.0% Danish27 0.8% Swedish24 0.7% Scotch-Irish22 0.6% French22 0.6% Scottish16 0.5% Belgian16 0.5% Finnish13 0.4% Northern European11 0.3% Portuguese10 0.3% Hungarian7 0.2% Czech7 0.2% Eastern European7 0.2% European7 0.2% French Canadian7 0.2% Slovak6 0.2% British6 0.2% Czechoslovakian3 0.09% Romanian2 0.06% Icelander1 0.03% Yugoslavian
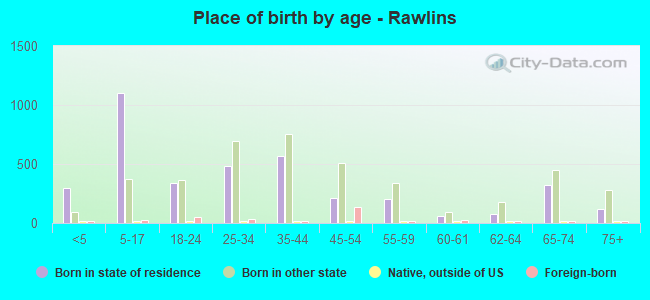
Children Nativity (place of birth) in Rawlins
Children under 6 years - Living with two parents Both parents native 246 100.0% NativeOne native, one foreign-born parent 28 100.0% NativeChildren under 6 years - Living with one parent Native parent 240 100.0% NativeForeign-born parent 5 100.0% NativeChildren 6 to 17 years - Living with two parents Both parents native 508 98.8% Native6 1.2% Foreign-bornBoth parents foreign-born 16 50.0% Native16 50.0% Foreign-bornOne native, one foreign-born parent 144 100.0% NativeChildren 6 to 17 years - Living with one parent Native parent 643 100.0% Native
Grandparents responsible for own grandchildren in Rawlins
Grandparents (30 to 59 years) White / Caucasian 27 20.5% Responsible for grandchildren103 79.5% Not responsible for grandchildrenAmerican Indian / Alaska Native 8 100.0% Not responsible for grandchildrenOther race 11 100.0% Responsible for grandchildrenWhite alone, not Hispanic / Latino 35 24.7% Responsible for grandchildren106 75.3% Not responsible for grandchildrenHispanic or Latino 9 100.0% Responsible for grandchildren
Grandparents (60 years and over) White / Caucasian 2 100.0% Not responsible for grandchildrenWhite alone, not Hispanic / Latino 2 100.0% Not responsible for grandchildrenHispanic or Latino 61 100.0% Responsible for grandchildren