Races in Raritan, New Jersey (NJ) Detailed Stats
Data:
Races - White alone (%)
Races - White alone (% change since 2000)
Races - Black alone (%)
Races - Black alone (% change since 2000)
Races - American Indian alone (%)
Races - American Indian alone (% change since 2000)
Races - Asian alone (%)
Races - Asian alone (% change since 2000)
Races - Hispanic (%)
Races - Hispanic (% change since 2000)
Races - Native Hawaiian and Other Pacific Islander alone (%)
Races - Native Hawaiian and Other Pacific Islander alone (% change since 2000)
Races - Two or more races(%)
Races - Two or more races(% change since 2000)
Races - Other race alone (%)
Races - Other race alone (% change since 2000)
Racial diversity
Place of birth - Born in state of residence (%)
Place of birth - Born in state of residence (%) - White
Place of birth - Born in state of residence (%) - Black or African American
Place of birth - Born in state of residence (%) - Asian
Place of birth - Born in state of residence (%) - Hispanic or Latino
Place of birth - Born in state of residence (%) - American Indian and Alaska Native
Place of birth - Born in state of residence (%) - Multirace
Place of birth - Born in state of residence (%) - Other Race
Place of birth - Born in other state (%)
Place of birth - Born in other state (%) - White
Place of birth - Born in other state (%) - Black or African American
Place of birth - Born in other state (%) - Asian
Place of birth - Born in other state (%) - Hispanic or Latino
Place of birth - Born in other state (%) - American Indian and Alaska Native
Place of birth - Born in other state (%) - Multirace
Place of birth - Born in other state (%) - Other Race
Place of birth - Native, outside of US (%)
Place of birth - Native, outside of US (%) - White
Place of birth - Native, outside of US (%) - Black or African American
Place of birth - Native, outside of US (%) - Asian
Place of birth - Native, outside of US (%) - Hispanic or Latino
Place of birth - Native, outside of US (%) - American Indian and Alaska Native
Place of birth - Native, outside of US (%) - Multirace
Place of birth - Native, outside of US (%) - Other Race
Place of birth - Foreign born (%)
Place of birth - Foreign born (%) - White
Place of birth - Foreign born (%) - Black or African American
Place of birth - Foreign born (%) - Asian
Place of birth - Foreign born (%) - Hispanic or Latino
Place of birth - Foreign born (%) - American Indian and Alaska Native
Place of birth - Foreign born (%) - Multirace
Place of birth - Foreign born (%) - Other Race
Residents speaking English at home (%)
Residents speaking English at home - Born in the United States (%)
Residents speaking English at home - Native, born elsewhere (%)
Residents speaking English at home - Foreign born (%)
Residents speaking Spanish at home (%)
Residents speaking Spanish at home - Born in the United States (%)
Residents speaking Spanish at home - Native, born elsewhere (%)
Residents speaking Spanish at home - Foreign born (%)
Residents speaking other language at home (%)
Residents speaking other language at home - Born in the United States (%)
Residents speaking other language at home - Native, born elsewhere (%)
Residents speaking other language at home - Foreign born (%)
Marital status - Never married (%)
Marital status - Now married (%)
Marital status - Separated (%)
Marital status - Widowed (%)
Marital status - Divorced (%)
Ancestries Reported - Arab (%)
Ancestries Reported - Czech (%)
Ancestries Reported - Danish (%)
Ancestries Reported - Dutch (%)
Ancestries Reported - English (%)
Ancestries Reported - French (%)
Ancestries Reported - French Canadian (%)
Ancestries Reported - German (%)
Ancestries Reported - Greek (%)
Ancestries Reported - Hungarian (%)
Ancestries Reported - Irish (%)
Ancestries Reported - Italian (%)
Ancestries Reported - Lithuanian (%)
Ancestries Reported - Norwegian (%)
Ancestries Reported - Polish (%)
Ancestries Reported - Portuguese (%)
Ancestries Reported - Russian (%)
Ancestries Reported - Scotch-Irish (%)
Ancestries Reported - Scottish (%)
Ancestries Reported - Slovak (%)
Ancestries Reported - Subsaharan African (%)
Ancestries Reported - Swedish (%)
Ancestries Reported - Swiss (%)
Ancestries Reported - Ukrainian (%)
Ancestries Reported - United States (%)
Ancestries Reported - Welsh (%)
Ancestries Reported - West Indian (%)
Ancestries Reported - Other (%)
Geographical mobility - Same house 1 year ago (%)
Geographical mobility - Same house 1 year ago (%) - White
Geographical mobility - Same house 1 year ago (%) - Black or African American
Geographical mobility - Same house 1 year ago (%) - Asian
Geographical mobility - Same house 1 year ago (%) - Hispanic or Latino
Geographical mobility - Same house 1 year ago (%) - American Indian and Alaska Native
Geographical mobility - Same house 1 year ago (%) - Multirace
Geographical mobility - Same house 1 year ago (%) - Other Race
Geographical mobility - Moved within same county (%)
Geographical mobility - Moved within same county (%) - White
Geographical mobility - Moved within same county (%) - Black or African American
Geographical mobility - Moved within same county (%) - Asian
Geographical mobility - Moved within same county (%) - Hispanic or Latino
Geographical mobility - Moved within same county (%) - American Indian and Alaska Native
Geographical mobility - Moved within same county (%) - Multirace
Geographical mobility - Moved within same county (%) - Other Race
Geographical mobility - Moved from different county within same state (%)
Geographical mobility - Moved from different county within same state (%) - White
Geographical mobility - Moved from different county within same state (%) - Black or African American
Geographical mobility - Moved from different county within same state (%) - Asian
Geographical mobility - Moved from different county within same state (%) - Hispanic or Latino
Geographical mobility - Moved from different county within same state (%) - American Indian and Alaska Native
Geographical mobility - Moved from different county within same state (%) - Multirace
Geographical mobility - Moved from different county within same state (%) - Other Race
Geographical mobility - Moved from different state (%)
Geographical mobility - Moved from different state (%) - White
Geographical mobility - Moved from different state (%) - Black or African American
Geographical mobility - Moved from different state (%) - Asian
Geographical mobility - Moved from different state (%) - Hispanic or Latino
Geographical mobility - Moved from different state (%) - American Indian and Alaska Native
Geographical mobility - Moved from different state (%) - Multirace
Geographical mobility - Moved from different state (%) - Other Race
Geographical mobility - Moved from abroad (%)
Geographical mobility - Moved from abroad (%) - White
Geographical mobility - Moved from abroad (%) - Black or African American
Geographical mobility - Moved from abroad (%) - Asian
Geographical mobility - Moved from abroad (%) - Hispanic or Latino
Geographical mobility - Moved from abroad (%) - American Indian and Alaska Native
Geographical mobility - Moved from abroad (%) - Multirace
Geographical mobility - Moved from abroad (%) - Other Race
Place of birth for the foreign-born population - Ireland (%)
Place of birth for the foreign-born population - Denmark (%)
Place of birth for the foreign-born population - Norway (%)
Place of birth for the foreign-born population - Sweden (%)
Place of birth for the foreign-born population - United Kingdom (%)
Place of birth for the foreign-born population - England (%)
Place of birth for the foreign-born population - Scotland (%)
Place of birth for the foreign-born population - Other Northern Europe (%)
Place of birth for the foreign-born population - Austria (%)
Place of birth for the foreign-born population - Belgium (%)
Place of birth for the foreign-born population - France (%)
Place of birth for the foreign-born population - Germany (%)
Place of birth for the foreign-born population - Netherlands (%)
Place of birth for the foreign-born population - Switzerland (%)
Place of birth for the foreign-born population - Other Western Europe (%)
Place of birth for the foreign-born population - Greece (%)
Place of birth for the foreign-born population - Italy (%)
Place of birth for the foreign-born population - Portugal (%)
Place of birth for the foreign-born population - Spain (%)
Place of birth for the foreign-born population - Other Southern Europe (%)
Place of birth for the foreign-born population - Albania (%)
Place of birth for the foreign-born population - Belarus (%)
Place of birth for the foreign-born population - Bosnia and Herzegovina (%)
Place of birth for the foreign-born population - Bulgaria (%)
Place of birth for the foreign-born population - Croatia (%)
Place of birth for the foreign-born population - Czechoslovakia (%)
Place of birth for the foreign-born population - Hungary (%)
Place of birth for the foreign-born population - Latvia (%)
Place of birth for the foreign-born population - Lithuania (%)
Place of birth for the foreign-born population - North Macedonia (Macedonia) (%)
Place of birth for the foreign-born population - Moldova (%)
Place of birth for the foreign-born population - Poland (%)
Place of birth for the foreign-born population - Romania (%)
Place of birth for the foreign-born population - Russia (%)
Place of birth for the foreign-born population - Serbia (%)
Place of birth for the foreign-born population - Ukraine (%)
Place of birth for the foreign-born population - Other Eastern Europe (%)
Place of birth for the foreign-born population - China (%)
Place of birth for the foreign-born population - Hong Kong (%)
Place of birth for the foreign-born population - Taiwan (%)
Place of birth for the foreign-born population - Japan (%)
Place of birth for the foreign-born population - Korea (%)
Place of birth for the foreign-born population - Other Eastern Asia (%)
Place of birth for the foreign-born population - Afghanistan (%)
Place of birth for the foreign-born population - Bangladesh (%)
Place of birth for the foreign-born population - India (%)
Place of birth for the foreign-born population - Iran (%)
Place of birth for the foreign-born population - Kazakhstan (%)
Place of birth for the foreign-born population - Nepal (%)
Place of birth for the foreign-born population - Pakistan (%)
Place of birth for the foreign-born population - Sri Lanka (%)
Place of birth for the foreign-born population - Uzbekistan (%)
Place of birth for the foreign-born population - Other South Central Asia (%)
Place of birth for the foreign-born population - Burma (%)
Place of birth for the foreign-born population - Cambodia (%)
Place of birth for the foreign-born population - Indonesia (%)
Place of birth for the foreign-born population - Laos (%)
Place of birth for the foreign-born population - Malaysia (%)
Place of birth for the foreign-born population - Philippines (%)
Place of birth for the foreign-born population - Singapore (%)
Place of birth for the foreign-born population - Thailand (%)
Place of birth for the foreign-born population - Vietnam (%)
Place of birth for the foreign-born population - Other South Eastern Asia (%)
Place of birth for the foreign-born population - Armenia (%)
Place of birth for the foreign-born population - Iraq (%)
Place of birth for the foreign-born population - Israel (%)
Place of birth for the foreign-born population - Jordan (%)
Place of birth for the foreign-born population - Kuwait (%)
Place of birth for the foreign-born population - Lebanon (%)
Place of birth for the foreign-born population - Saudi Arabia (%)
Place of birth for the foreign-born population - Syria (%)
Place of birth for the foreign-born population - Turkey (%)
Place of birth for the foreign-born population - Yemen (%)
Place of birth for the foreign-born population - Other Western Asia (%)
Place of birth for the foreign-born population - Eritrea (%)
Place of birth for the foreign-born population - Ethiopia (%)
Place of birth for the foreign-born population - Kenya (%)
Place of birth for the foreign-born population - Somalia (%)
Place of birth for the foreign-born population - Uganda (%)
Place of birth for the foreign-born population - Zimbabwe (%)
Place of birth for the foreign-born population - Other Eastern Africa (%)
Place of birth for the foreign-born population - Cameroon (%)
Place of birth for the foreign-born population - Congo (%)
Place of birth for the foreign-born population - Democratic Republic of Congo (Zaire) (%)
Place of birth for the foreign-born population - Other Middle Africa (%)
Place of birth for the foreign-born population - Egypt (%)
Place of birth for the foreign-born population - Morocco (%)
Place of birth for the foreign-born population - Sudan (%)
Place of birth for the foreign-born population - Other Northern Africa (%)
Place of birth for the foreign-born population - South Africa (%)
Place of birth for the foreign-born population - Other Southern Africa (%)
Place of birth for the foreign-born population - Cabo Verde (%)
Place of birth for the foreign-born population - Ghana (%)
Place of birth for the foreign-born population - Liberia (%)
Place of birth for the foreign-born population - Nigeria (%)
Place of birth for the foreign-born population - Senegal (%)
Place of birth for the foreign-born population - Sierra Leone (%)
Place of birth for the foreign-born population - Other Western Africa (%)
Place of birth for the foreign-born population - Australia (%)
Place of birth for the foreign-born population - New Zealand (%)
Place of birth for the foreign-born population - Fiji (%)
Place of birth for the foreign-born population - Micronesia (%)
Place of birth for the foreign-born population - Bahamas (%)
Place of birth for the foreign-born population - Barbados (%)
Place of birth for the foreign-born population - Cuba (%)
Place of birth for the foreign-born population - Dominica (%)
Place of birth for the foreign-born population - Dominican Republic (%)
Place of birth for the foreign-born population - Grenada (%)
Place of birth for the foreign-born population - Haiti (%)
Place of birth for the foreign-born population - Jamaica (%)
Place of birth for the foreign-born population - St. Vincent and the Grenadines (%)
Place of birth for the foreign-born population - Trinidad and Tobago (%)
Place of birth for the foreign-born population - West Indies (%)
Place of birth for the foreign-born population - Other Caribbean (%)
Place of birth for the foreign-born population - Belize (%)
Place of birth for the foreign-born population - Costa Rica (%)
Place of birth for the foreign-born population - El Salvador (%)
Place of birth for the foreign-born population - Guatemala (%)
Place of birth for the foreign-born population - Honduras (%)
Place of birth for the foreign-born population - Mexico (%)
Place of birth for the foreign-born population - Nicaragua (%)
Place of birth for the foreign-born population - Panama (%)
Place of birth for the foreign-born population - Other Central America (%)
Place of birth for the foreign-born population - Argentina (%)
Place of birth for the foreign-born population - Bolivia (%)
Place of birth for the foreign-born population - Brazil (%)
Place of birth for the foreign-born population - Chile (%)
Place of birth for the foreign-born population - Colombia (%)
Place of birth for the foreign-born population - Ecuador (%)
Place of birth for the foreign-born population - Guyana (%)
Place of birth for the foreign-born population - Peru (%)
Place of birth for the foreign-born population - Uruguay (%)
Place of birth for the foreign-born population - Venezuela (%)
Place of birth for the foreign-born population - Other South America (%)
Place of birth for the foreign-born population - Canada (%)
Place of birth for the foreign-born population - Other Northern America (%)
Place of birth for the foreign-born population - Other (%)
Latest news about races in Raritan, NJ collected exclusively by city-data.com from local newspapers, TV, and radio stations
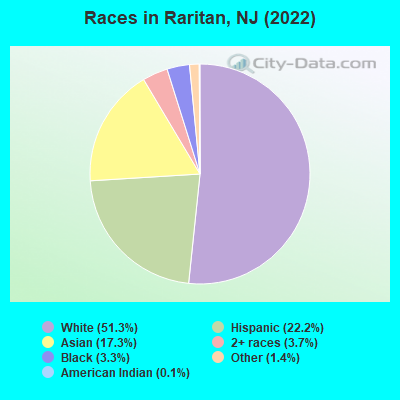
According to 2022 data, the most numerous races in Raritan, NJ are White alone (4,281 residents), Hispanic (1,849 residents), and Black alone (273 residents). 59.0% of Raritan residents speak English at home. 32.2% of Raritan, NJ residents are foreign-born (15.2% born in Asia, 13.0% born in Latin America), which is 28.5% greater than the foreign-born rate of 23.0% across the entire state of New Jersey.
Race distribution in Raritan
2000 2022
5,557,209 66.0% White alone 1,117,191 13.3% Hispanic 1,096,171 13.0% Black alone 477,012 5.7% Asian alone 133,689 1.6% Two or more races 19,565 0.2% Other race alone 11,338 0.1% American Indian alone 2,175 0.03% Native Hawaiian and Other
4,766,476 51.5% White alone 2,028,470 21.9% Hispanic 1,111,632 12.0% Black alone 923,546 10.0% Asian alone 332,237 3.6% Two or more races 89,847 1.0% Other race alone 8,557 0.09% American Indian alone 934 0.01% Native Hawaiian and Other
Income and house value in Raritan Median household income in 2022 $95,220 White non-Hispanic householders$173,944 Some other race householders$116,161 Two or more races householders$124,291 Hispanic or Latino race householdersMedian 2022 house value $435,358 White Non-Hispanic householders$334,423 Black or African American householders $645,984 Asian householders$547,238 Some other race householders$395,227 Two or more races householders$460,410 Hispanic or Latino householders
Median age by race in Raritan
48.6 Median age for White residents43.8 50.0 43.2 Median age for Black or African American residents43.5 39.1 59.3 Median age for American Indian / Alaska Native residents-643,500,642.9 -1,220,338,981.8 42.6 Median age for Asian residents48.5 41.6 -804,177,544.9 Median age for Native Hawaiian / Pacific Islander residents-666,666,666.0 -713,070,378.3 40.4 Median age for Other race residents42.5 39.4 33.9 Median age for Two or more races residents33.7 54.8 49.2 Median age for White alone residents43.8 50.3 38.1 Median age for Hispanic or Latino residents33.5 46.2
Owner/renter occupied households by race in Raritan
House owners and renters - White residents 1,400 71.7% Owner occupied553 28.3% Renter occupiedHouse owners and renters - Black or African American residents 27 18.6% Owner occupied119 81.4% Renter occupiedHouse owners and renters - Asian residents 224 41.0% Owner occupied322 59.0% Renter occupiedHouse owners and renters - Other race residents 80 34.7% Owner occupied151 65.3% Renter occupiedHouse owners and renters - Two or more races residents 243 63.2% Owner occupied142 36.8% Renter occupiedHouse owners and renters - White alone residents 1,372 70.0% Owner occupied588 30.0% Renter occupiedHouse owners and renters - Hispanic or Latino residents 271 53.8% Owner occupied233 46.2% Renter occupied
Language usage in Raritan
English speakers - Total 59.0% of residents of Raritan speak English at home.
19.9% of residents speak Spanish at home 1,066 66.4% Speak English very well540 33.6% Speak English less than very well21.1% of residents speak other language at home 1,284 75.5% Speak English very well417 24.5% Speak English less than very well
English speakers - Born in the United States 94.0% of residents of Raritan speak English at home.
2.5% of residents speak Spanish at home 27 100.0% Speak English very well3.0% of residents speak other language at home 33 100.0% Speak English very well
English speakers - Native, born elsewhere 12.5% of residents of Raritan speak English at home.
71.2% of residents speak Spanish at home 50 87.7% Speak English very well7 12.3% Speak English less than very well12.5% of residents speak other language at home 10 100.0% Speak English very well
English speakers - Foreign-born 12.2% of residents of Raritan speak English at home.
30.7% of residents speak Spanish at home 305 37.8% Speak English very well501 62.2% Speak English less than very well55.7% of residents speak other language at home 1,044 71.3% Speak English very well420 28.7% Speak English less than very well
White (Caucasian) - Speak only English Native:
92.0% (3,538)Foreign-born:
15.1% (59)
White (Caucasian) - Speak another language Native:
8.0% (310)Foreign-born:
85.5% (331)
Asian - Speak only English Native:
74.9% (190)Foreign-born:
14.4% (167)
Asian - Speak another language Native:
17.2% (44)Foreign-born:
85.5% (989)
Other race - Speak only English Native:
7.2% (15)Foreign-born:
6.3% (24)
Other race - Speak another language Native:
100.0% (212)Foreign-born:
93.2% (357)
Two or more races - Speak only English Native:
43.6% (457)Foreign-born:
6.5% (51)
Two or more races - Speak another language Native:
52.8% (554)Foreign-born:
93.3% (736)
White alone - Speak only English Native:
92.3% (3,473)Foreign-born:
18.9% (62)
White alone - Speak another language Native:
7.9% (299)Foreign-born:
82.9% (270)
Hispanic or Latino - Speak only English Native:
30.0% (267)Foreign-born:
4.8% (42)
Hispanic or Latino - Speak another language Native:
70.6% (628)Foreign-born:
94.3% (829)
Foreign-born residents in Raritan 2,686 residents are foreign born (15.2% Asia , 13.0% Latin America ).
This city:
32.2%New Jersey:
23.2%
Marital status for residents in Raritan Marital status - White (Caucasian) population 15 years and over
Males 36.6% Never married56.0% Now married1.6% Separated0.0% Widowed5.8% DivorcedFemales 22.3% Never married59.5% Now married0.0% Separated10.3% Widowed7.9% DivorcedWomen who gave birth in the past 12 months Now married:
81.0% (43)Unmarried:
19.0% (10)
Women who did not give birth in the past 12 months Now married:
51.4% (436)Unmarried:
48.6% (413)
Marital status - Black or African American population 15 years and over
Males 29.2% Never married70.8% Now married0.0% Separated0.0% Widowed0.0% DivorcedFemales 0.0% Never married63.9% Now married0.0% Separated0.0% Widowed36.1% DivorcedWomen who did not give birth in the past 12 months Now married:
100.0% (35)Unmarried:
0.0% (0)
Marital status - Asian population 15 years and over
Males 28.8% Never married67.8% Now married0.0% Separated3.5% Widowed0.0% DivorcedFemales 52.2% Never married41.5% Now married0.0% Separated5.2% Widowed1.1% DivorcedWomen who gave birth in the past 12 months Now married:
100.0% (10)Unmarried:
0.0% (0)
Women who did not give birth in the past 12 months Now married:
30.1% (159)Unmarried:
69.9% (368)
Marital status - Other race population 15 years and over
Males 63.0% Never married37.0% Now married0.0% Separated0.0% Widowed0.0% DivorcedFemales 8.6% Never married43.2% Now married0.0% Separated0.0% Widowed48.1% DivorcedWomen who did not give birth in the past 12 months Now married:
28.9% (38)Unmarried:
71.1% (93)
Marital status - Two or more races population 15 years and over
Males 39.4% Never married60.6% Now married0.0% Separated0.0% Widowed0.0% DivorcedFemales 18.5% Never married65.2% Now married3.8% Separated0.0% Widowed12.5% DivorcedWomen who did not give birth in the past 12 months Now married:
67.9% (318)Unmarried:
32.1% (150)
Marital status - White alone, not Hispanic / Latino population 15 years and over
Males 37.0% Never married55.3% Now married1.7% Separated0.0% Widowed6.0% DivorcedFemales 22.4% Never married58.5% Now married0.0% Separated11.0% Widowed8.1% DivorcedWomen who gave birth in the past 12 months Now married:
62.1% (17)Unmarried:
37.9% (10)
Women who did not give birth in the past 12 months Now married:
51.1% (424)Unmarried:
48.9% (406)
Marital status - Hispanic or Latino population 15 years and over
Males 26.4% Never married73.6% Now married0.0% Separated0.0% Widowed0.0% DivorcedFemales 16.7% Never married65.6% Now married2.0% Separated0.0% Widowed15.6% DivorcedWomen who gave birth in the past 12 months Now married:
100.0% (30)Unmarried:
0.0% (0)
Women who did not give birth in the past 12 months Now married:
66.1% (301)Unmarried:
33.9% (155)
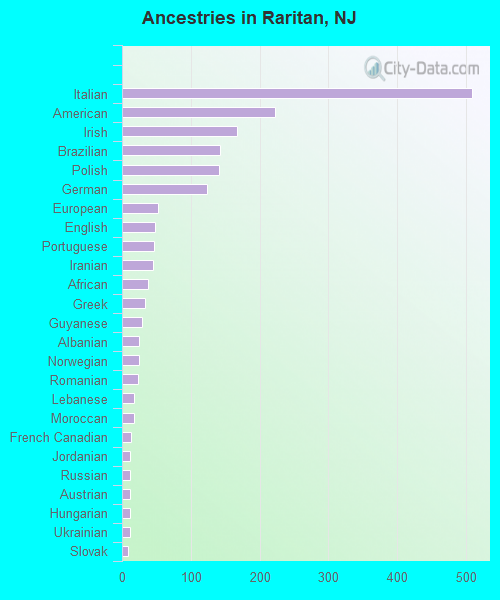
Ancestries in Raritan
508 11.1% Italian223 4.9% American167 3.6% Irish142 3.1% Brazilian141 3.1% Polish123 2.7% German53 1.2% European48 1.0% English46 1.0% Portuguese45 1.0% Iranian38 0.8% African34 0.7% Greek29 0.6% Guyanese25 0.5% Albanian24 0.5% Norwegian23 0.5% Romanian17 0.4% Lebanese17 0.4% Moroccan13 0.3% French Canadian12 0.3% Jordanian12 0.3% Russian11 0.2% Austrian11 0.2% Hungarian11 0.2% Ukrainian9 0.2% Slovak8 0.2% Eastern European8 0.2% Lithuanian
Children Nativity (place of birth) in Raritan
Children under 6 years - Living with two parents Both parents native 183 100.0% NativeBoth parents foreign-born 44 83.7% Native9 16.3% Foreign-bornOne native, one foreign-born parent 49 100.0% NativeChildren under 6 years - Living with one parent Native parent 12 100.0% NativeChildren 6 to 17 years - Living with two parents Both parents native 304 100.0% NativeBoth parents foreign-born 356 81.6% Native80 18.4% Foreign-bornOne native, one foreign-born parent 133 100.0% NativeChildren 6 to 17 years - Living with one parent Native parent 32 100.0% NativeForeign-born parent 18 61.7% Native11 38.3% Foreign-born