Races in Raleigh, North Carolina (NC) Detailed Stats
Data:
Races - White alone (%)
Races - White alone (% change since 2000)
Races - Black alone (%)
Races - Black alone (% change since 2000)
Races - American Indian alone (%)
Races - American Indian alone (% change since 2000)
Races - Asian alone (%)
Races - Asian alone (% change since 2000)
Races - Hispanic (%)
Races - Hispanic (% change since 2000)
Races - Native Hawaiian and Other Pacific Islander alone (%)
Races - Native Hawaiian and Other Pacific Islander alone (% change since 2000)
Races - Two or more races(%)
Races - Two or more races(% change since 2000)
Races - Other race alone (%)
Races - Other race alone (% change since 2000)
Racial diversity
Place of birth - Born in state of residence (%)
Place of birth - Born in state of residence (%) - White
Place of birth - Born in state of residence (%) - Black or African American
Place of birth - Born in state of residence (%) - Asian
Place of birth - Born in state of residence (%) - Hispanic or Latino
Place of birth - Born in state of residence (%) - American Indian and Alaska Native
Place of birth - Born in state of residence (%) - Multirace
Place of birth - Born in state of residence (%) - Other Race
Place of birth - Born in other state (%)
Place of birth - Born in other state (%) - White
Place of birth - Born in other state (%) - Black or African American
Place of birth - Born in other state (%) - Asian
Place of birth - Born in other state (%) - Hispanic or Latino
Place of birth - Born in other state (%) - American Indian and Alaska Native
Place of birth - Born in other state (%) - Multirace
Place of birth - Born in other state (%) - Other Race
Place of birth - Native, outside of US (%)
Place of birth - Native, outside of US (%) - White
Place of birth - Native, outside of US (%) - Black or African American
Place of birth - Native, outside of US (%) - Asian
Place of birth - Native, outside of US (%) - Hispanic or Latino
Place of birth - Native, outside of US (%) - American Indian and Alaska Native
Place of birth - Native, outside of US (%) - Multirace
Place of birth - Native, outside of US (%) - Other Race
Place of birth - Foreign born (%)
Place of birth - Foreign born (%) - White
Place of birth - Foreign born (%) - Black or African American
Place of birth - Foreign born (%) - Asian
Place of birth - Foreign born (%) - Hispanic or Latino
Place of birth - Foreign born (%) - American Indian and Alaska Native
Place of birth - Foreign born (%) - Multirace
Place of birth - Foreign born (%) - Other Race
Residents speaking English at home (%)
Residents speaking English at home - Born in the United States (%)
Residents speaking English at home - Native, born elsewhere (%)
Residents speaking English at home - Foreign born (%)
Residents speaking Spanish at home (%)
Residents speaking Spanish at home - Born in the United States (%)
Residents speaking Spanish at home - Native, born elsewhere (%)
Residents speaking Spanish at home - Foreign born (%)
Residents speaking other language at home (%)
Residents speaking other language at home - Born in the United States (%)
Residents speaking other language at home - Native, born elsewhere (%)
Residents speaking other language at home - Foreign born (%)
Marital status - Never married (%)
Marital status - Now married (%)
Marital status - Separated (%)
Marital status - Widowed (%)
Marital status - Divorced (%)
Ancestries Reported - Arab (%)
Ancestries Reported - Czech (%)
Ancestries Reported - Danish (%)
Ancestries Reported - Dutch (%)
Ancestries Reported - English (%)
Ancestries Reported - French (%)
Ancestries Reported - French Canadian (%)
Ancestries Reported - German (%)
Ancestries Reported - Greek (%)
Ancestries Reported - Hungarian (%)
Ancestries Reported - Irish (%)
Ancestries Reported - Italian (%)
Ancestries Reported - Lithuanian (%)
Ancestries Reported - Norwegian (%)
Ancestries Reported - Polish (%)
Ancestries Reported - Portuguese (%)
Ancestries Reported - Russian (%)
Ancestries Reported - Scotch-Irish (%)
Ancestries Reported - Scottish (%)
Ancestries Reported - Slovak (%)
Ancestries Reported - Subsaharan African (%)
Ancestries Reported - Swedish (%)
Ancestries Reported - Swiss (%)
Ancestries Reported - Ukrainian (%)
Ancestries Reported - United States (%)
Ancestries Reported - Welsh (%)
Ancestries Reported - West Indian (%)
Ancestries Reported - Other (%)
Geographical mobility - Same house 1 year ago (%)
Geographical mobility - Same house 1 year ago (%) - White
Geographical mobility - Same house 1 year ago (%) - Black or African American
Geographical mobility - Same house 1 year ago (%) - Asian
Geographical mobility - Same house 1 year ago (%) - Hispanic or Latino
Geographical mobility - Same house 1 year ago (%) - American Indian and Alaska Native
Geographical mobility - Same house 1 year ago (%) - Multirace
Geographical mobility - Same house 1 year ago (%) - Other Race
Geographical mobility - Moved within same county (%)
Geographical mobility - Moved within same county (%) - White
Geographical mobility - Moved within same county (%) - Black or African American
Geographical mobility - Moved within same county (%) - Asian
Geographical mobility - Moved within same county (%) - Hispanic or Latino
Geographical mobility - Moved within same county (%) - American Indian and Alaska Native
Geographical mobility - Moved within same county (%) - Multirace
Geographical mobility - Moved within same county (%) - Other Race
Geographical mobility - Moved from different county within same state (%)
Geographical mobility - Moved from different county within same state (%) - White
Geographical mobility - Moved from different county within same state (%) - Black or African American
Geographical mobility - Moved from different county within same state (%) - Asian
Geographical mobility - Moved from different county within same state (%) - Hispanic or Latino
Geographical mobility - Moved from different county within same state (%) - American Indian and Alaska Native
Geographical mobility - Moved from different county within same state (%) - Multirace
Geographical mobility - Moved from different county within same state (%) - Other Race
Geographical mobility - Moved from different state (%)
Geographical mobility - Moved from different state (%) - White
Geographical mobility - Moved from different state (%) - Black or African American
Geographical mobility - Moved from different state (%) - Asian
Geographical mobility - Moved from different state (%) - Hispanic or Latino
Geographical mobility - Moved from different state (%) - American Indian and Alaska Native
Geographical mobility - Moved from different state (%) - Multirace
Geographical mobility - Moved from different state (%) - Other Race
Geographical mobility - Moved from abroad (%)
Geographical mobility - Moved from abroad (%) - White
Geographical mobility - Moved from abroad (%) - Black or African American
Geographical mobility - Moved from abroad (%) - Asian
Geographical mobility - Moved from abroad (%) - Hispanic or Latino
Geographical mobility - Moved from abroad (%) - American Indian and Alaska Native
Geographical mobility - Moved from abroad (%) - Multirace
Geographical mobility - Moved from abroad (%) - Other Race
Place of birth for the foreign-born population - Ireland (%)
Place of birth for the foreign-born population - Denmark (%)
Place of birth for the foreign-born population - Norway (%)
Place of birth for the foreign-born population - Sweden (%)
Place of birth for the foreign-born population - United Kingdom (%)
Place of birth for the foreign-born population - England (%)
Place of birth for the foreign-born population - Scotland (%)
Place of birth for the foreign-born population - Other Northern Europe (%)
Place of birth for the foreign-born population - Austria (%)
Place of birth for the foreign-born population - Belgium (%)
Place of birth for the foreign-born population - France (%)
Place of birth for the foreign-born population - Germany (%)
Place of birth for the foreign-born population - Netherlands (%)
Place of birth for the foreign-born population - Switzerland (%)
Place of birth for the foreign-born population - Other Western Europe (%)
Place of birth for the foreign-born population - Greece (%)
Place of birth for the foreign-born population - Italy (%)
Place of birth for the foreign-born population - Portugal (%)
Place of birth for the foreign-born population - Spain (%)
Place of birth for the foreign-born population - Other Southern Europe (%)
Place of birth for the foreign-born population - Albania (%)
Place of birth for the foreign-born population - Belarus (%)
Place of birth for the foreign-born population - Bosnia and Herzegovina (%)
Place of birth for the foreign-born population - Bulgaria (%)
Place of birth for the foreign-born population - Croatia (%)
Place of birth for the foreign-born population - Czechoslovakia (%)
Place of birth for the foreign-born population - Hungary (%)
Place of birth for the foreign-born population - Latvia (%)
Place of birth for the foreign-born population - Lithuania (%)
Place of birth for the foreign-born population - North Macedonia (Macedonia) (%)
Place of birth for the foreign-born population - Moldova (%)
Place of birth for the foreign-born population - Poland (%)
Place of birth for the foreign-born population - Romania (%)
Place of birth for the foreign-born population - Russia (%)
Place of birth for the foreign-born population - Serbia (%)
Place of birth for the foreign-born population - Ukraine (%)
Place of birth for the foreign-born population - Other Eastern Europe (%)
Place of birth for the foreign-born population - China (%)
Place of birth for the foreign-born population - Hong Kong (%)
Place of birth for the foreign-born population - Taiwan (%)
Place of birth for the foreign-born population - Japan (%)
Place of birth for the foreign-born population - Korea (%)
Place of birth for the foreign-born population - Other Eastern Asia (%)
Place of birth for the foreign-born population - Afghanistan (%)
Place of birth for the foreign-born population - Bangladesh (%)
Place of birth for the foreign-born population - India (%)
Place of birth for the foreign-born population - Iran (%)
Place of birth for the foreign-born population - Kazakhstan (%)
Place of birth for the foreign-born population - Nepal (%)
Place of birth for the foreign-born population - Pakistan (%)
Place of birth for the foreign-born population - Sri Lanka (%)
Place of birth for the foreign-born population - Uzbekistan (%)
Place of birth for the foreign-born population - Other South Central Asia (%)
Place of birth for the foreign-born population - Burma (%)
Place of birth for the foreign-born population - Cambodia (%)
Place of birth for the foreign-born population - Indonesia (%)
Place of birth for the foreign-born population - Laos (%)
Place of birth for the foreign-born population - Malaysia (%)
Place of birth for the foreign-born population - Philippines (%)
Place of birth for the foreign-born population - Singapore (%)
Place of birth for the foreign-born population - Thailand (%)
Place of birth for the foreign-born population - Vietnam (%)
Place of birth for the foreign-born population - Other South Eastern Asia (%)
Place of birth for the foreign-born population - Armenia (%)
Place of birth for the foreign-born population - Iraq (%)
Place of birth for the foreign-born population - Israel (%)
Place of birth for the foreign-born population - Jordan (%)
Place of birth for the foreign-born population - Kuwait (%)
Place of birth for the foreign-born population - Lebanon (%)
Place of birth for the foreign-born population - Saudi Arabia (%)
Place of birth for the foreign-born population - Syria (%)
Place of birth for the foreign-born population - Turkey (%)
Place of birth for the foreign-born population - Yemen (%)
Place of birth for the foreign-born population - Other Western Asia (%)
Place of birth for the foreign-born population - Eritrea (%)
Place of birth for the foreign-born population - Ethiopia (%)
Place of birth for the foreign-born population - Kenya (%)
Place of birth for the foreign-born population - Somalia (%)
Place of birth for the foreign-born population - Uganda (%)
Place of birth for the foreign-born population - Zimbabwe (%)
Place of birth for the foreign-born population - Other Eastern Africa (%)
Place of birth for the foreign-born population - Cameroon (%)
Place of birth for the foreign-born population - Congo (%)
Place of birth for the foreign-born population - Democratic Republic of Congo (Zaire) (%)
Place of birth for the foreign-born population - Other Middle Africa (%)
Place of birth for the foreign-born population - Egypt (%)
Place of birth for the foreign-born population - Morocco (%)
Place of birth for the foreign-born population - Sudan (%)
Place of birth for the foreign-born population - Other Northern Africa (%)
Place of birth for the foreign-born population - South Africa (%)
Place of birth for the foreign-born population - Other Southern Africa (%)
Place of birth for the foreign-born population - Cabo Verde (%)
Place of birth for the foreign-born population - Ghana (%)
Place of birth for the foreign-born population - Liberia (%)
Place of birth for the foreign-born population - Nigeria (%)
Place of birth for the foreign-born population - Senegal (%)
Place of birth for the foreign-born population - Sierra Leone (%)
Place of birth for the foreign-born population - Other Western Africa (%)
Place of birth for the foreign-born population - Australia (%)
Place of birth for the foreign-born population - New Zealand (%)
Place of birth for the foreign-born population - Fiji (%)
Place of birth for the foreign-born population - Micronesia (%)
Place of birth for the foreign-born population - Bahamas (%)
Place of birth for the foreign-born population - Barbados (%)
Place of birth for the foreign-born population - Cuba (%)
Place of birth for the foreign-born population - Dominica (%)
Place of birth for the foreign-born population - Dominican Republic (%)
Place of birth for the foreign-born population - Grenada (%)
Place of birth for the foreign-born population - Haiti (%)
Place of birth for the foreign-born population - Jamaica (%)
Place of birth for the foreign-born population - St. Vincent and the Grenadines (%)
Place of birth for the foreign-born population - Trinidad and Tobago (%)
Place of birth for the foreign-born population - West Indies (%)
Place of birth for the foreign-born population - Other Caribbean (%)
Place of birth for the foreign-born population - Belize (%)
Place of birth for the foreign-born population - Costa Rica (%)
Place of birth for the foreign-born population - El Salvador (%)
Place of birth for the foreign-born population - Guatemala (%)
Place of birth for the foreign-born population - Honduras (%)
Place of birth for the foreign-born population - Mexico (%)
Place of birth for the foreign-born population - Nicaragua (%)
Place of birth for the foreign-born population - Panama (%)
Place of birth for the foreign-born population - Other Central America (%)
Place of birth for the foreign-born population - Argentina (%)
Place of birth for the foreign-born population - Bolivia (%)
Place of birth for the foreign-born population - Brazil (%)
Place of birth for the foreign-born population - Chile (%)
Place of birth for the foreign-born population - Colombia (%)
Place of birth for the foreign-born population - Ecuador (%)
Place of birth for the foreign-born population - Guyana (%)
Place of birth for the foreign-born population - Peru (%)
Place of birth for the foreign-born population - Uruguay (%)
Place of birth for the foreign-born population - Venezuela (%)
Place of birth for the foreign-born population - Other South America (%)
Place of birth for the foreign-born population - Canada (%)
Place of birth for the foreign-born population - Other Northern America (%)
Place of birth for the foreign-born population - Other (%)
Latest news about races in Raleigh, NC collected exclusively by city-data.com from local newspapers, TV, and radio stations
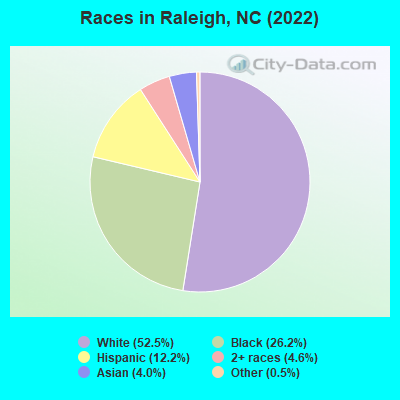
According to 2022 data, the most numerous races in Raleigh, NC are White alone (250,690 residents), Black alone (124,965 residents), and Hispanic (58,091 residents). 81.5% of Raleigh residents speak English at home. 13.2% of Raleigh, NC residents are foreign-born (5.3% born in Latin America, 3.8% born in Asia, 2.3% born in Africa), which is 39.4% greater than the foreign-born rate of 8.0% across the entire state of North Carolina.
Race distribution in Raleigh
2000 2022
166,386 60.3% White alone 75,931 27.5% Black alone 19,308 7.0% Hispanic 9,282 3.4% Asian alone 3,914 1.4% Two or more races 795 0.3% American Indian alone 377 0.1% Other race alone 100 0.04% Native Hawaiian and Other
250,690 52.5% White alone 124,965 26.2% Black alone 58,091 12.2% Hispanic 21,756 4.6% Two or more races 19,060 4.0% Asian alone 2,240 0.5% Other race alone 282 0.06% American Indian alone
2000 2022
5,647,155 70.2% White alone 1,723,301 21.4% Black alone 378,963 4.7% Hispanic 112,416 1.4% Asian alone 95,333 1.2% American Indian alone 79,965 1.0% Two or more races 9,015 0.1% Other race alone 3,165 0.04% Native Hawaiian and Other
6,497,519 60.7% White alone 2,155,650 20.1% Black alone 1,114,799 10.4% Hispanic 438,061 4.1% Two or more races 341,052 3.2% Asian alone 91,758 0.9% American Indian alone 50,180 0.5% Other race alone 9,954 0.09% Native Hawaiian and Other
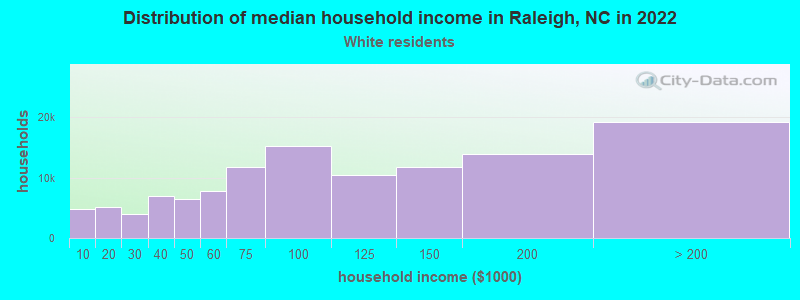
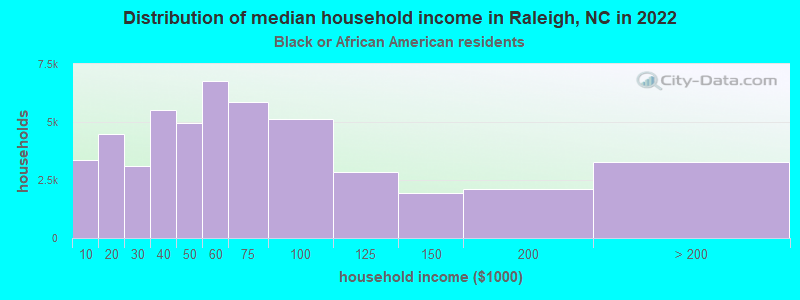
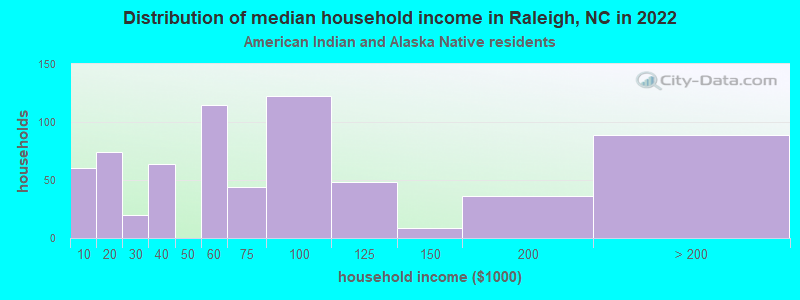
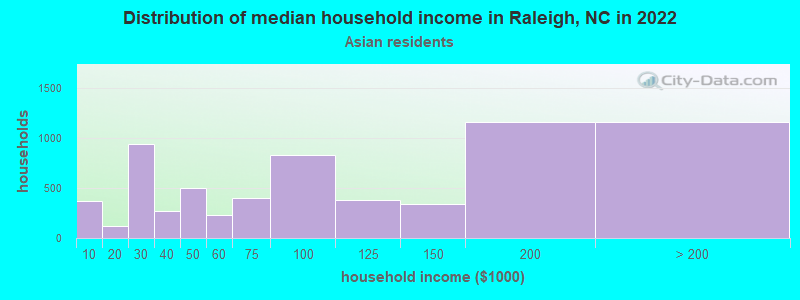
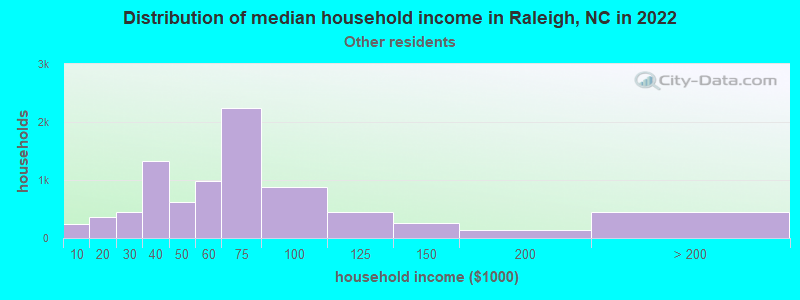
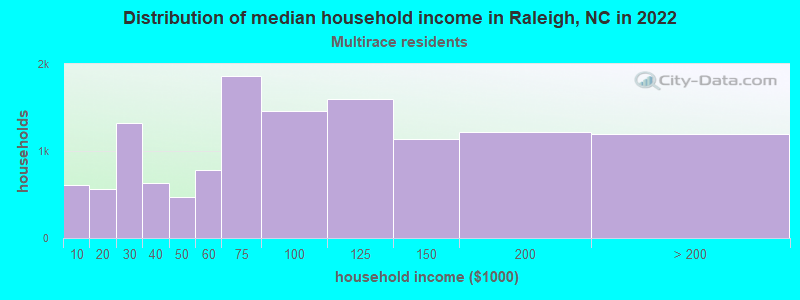
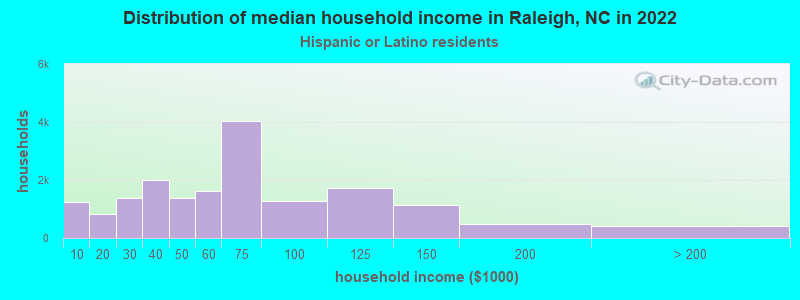
Income and house value in Raleigh Median household income in 2022 $95,492 White non-Hispanic householders$53,881 Black householders$88,536 American Indian and Alaska Native householders$80,107 Asian householders$62,582 Some other race householders$76,923 Two or more races householders$61,798 Hispanic or Latino race householdersMedian 2022 house value $478,067 White Non-Hispanic householders$311,648 Black or African American householders$309,105 American Indian or Alaska Native householders $434,273 Asian householdersover $1,000,000 Native Hawaiian and other Pacific Islander householders$354,877 Some other race householders$406,018 Two or more races householders$375,220 Hispanic or Latino householders
Median age by race in Raleigh
36.8 Median age for White residents35.4 38.8 34.0 Median age for Black or African American residents32.5 36.9 25.4 Median age for American Indian / Alaska Native residents51.1 24.5 34.6 Median age for Asian residents35.7 32.3 -666,666,666.0 Median age for Native Hawaiian / Pacific Islander residents-666,666,666.0 -666,666,666.0 31.4 Median age for Other race residents29.4 34.0 25.6 Median age for Two or more races residents26.4 25.4 36.9 Median age for White alone residents35.6 38.8 27.5 Median age for Hispanic or Latino residents27.3 27.7
Owner/renter occupied households by race in Raleigh
House owners and renters - White residents 69,116 58.9% Owner occupied48,244 41.1% Renter occupiedHouse owners and renters - Black or African American residents 16,776 34.0% Owner occupied32,633 66.0% Renter occupiedHouse owners and renters - American Indian / Alaska Native residents 101 17.0% Owner occupied495 83.0% Renter occupiedHouse owners and renters - Asian residents 4,244 63.2% Owner occupied2,476 36.8% Renter occupiedHouse owners and renters - Native Hawaiian / Pacific Islander residents 129 100.0% Renter occupiedHouse owners and renters - Other race residents 2,352 26.4% Owner occupied6,552 73.6% Renter occupiedHouse owners and renters - Two or more races residents 6,212 48.3% Owner occupied6,649 51.7% Renter occupiedHouse owners and renters - White alone residents 68,166 59.4% Owner occupied46,594 40.6% Renter occupiedHouse owners and renters - Hispanic or Latino residents 6,519 37.2% Owner occupied11,022 62.8% Renter occupied
Language usage in Raleigh
English speakers - Total 81.5% of residents of Raleigh speak English at home.
9.2% of residents speak Spanish at home 25,998 62.7% Speak English very well15,445 37.3% Speak English less than very well9.3% of residents speak other language at home 31,033 74.3% Speak English very well10,750 25.7% Speak English less than very well
English speakers - Born in the United States 93.0% of residents of Raleigh speak English at home.
4.1% of residents speak Spanish at home 7,000 91.4% Speak English very well661 8.6% Speak English less than very well3.0% of residents speak other language at home 4,123 74.1% Speak English very well1,441 25.9% Speak English less than very well
English speakers - Native, born elsewhere 67.2% of residents of Raleigh speak English at home.
20.0% of residents speak Spanish at home 1,297 74.6% Speak English very well442 25.4% Speak English less than very well12.8% of residents speak other language at home 922 82.5% Speak English very well195 17.5% Speak English less than very well
English speakers - Foreign-born 16.6% of residents of Raleigh speak English at home.
35.1% of residents speak Spanish at home 9,964 44.4% Speak English very well12,494 55.6% Speak English less than very well48.3% of residents speak other language at home 22,447 72.7% Speak English very well8,424 27.3% Speak English less than very well
White (Caucasian) - Speak only English Native:
95.9% (217,944)Foreign-born:
31.5% (5,287)
White (Caucasian) - Speak another language Native:
4.1% (9,212)Foreign-born:
68.5% (11,519)
Black or African American - Speak only English Native:
97.1% (103,460)Foreign-born:
14.2% (1,838)
Black or African American - Speak another language Native:
2.9% (3,096)Foreign-born:
85.8% (11,122)
American Indian / Alaska Native - Speak only English Native:
79.7% (1,007)Foreign-born:
5.7% (23)
American Indian / Alaska Native - Speak another language Native:
23.4% (296)Foreign-born:
94.7% (377)
Asian - Speak only English Native:
67.1% (3,673)Foreign-born:
17.6% (2,055)
Asian - Speak another language Native:
32.9% (1,804)Foreign-born:
82.4% (9,638)
Other race - Speak only English Native:
41.5% (4,975)Foreign-born:
7.2% (835)
Other race - Speak another language Native:
58.5% (7,002)Foreign-born:
92.8% (10,733)
Two or more races - Speak only English Native:
74.3% (24,520)Foreign-born:
5.3% (578)
Two or more races - Speak another language Native:
25.7% (8,475)Foreign-born:
94.7% (10,241)
White alone - Speak only English Native:
96.8% (216,677)Foreign-born:
34.8% (5,287)
White alone - Speak another language Native:
3.2% (7,065)Foreign-born:
65.2% (9,927)
Hispanic or Latino - Speak only English Native:
45.7% (13,601)Foreign-born:
4.4% (1,029)
Hispanic or Latino - Speak another language Native:
54.3% (16,167)Foreign-born:
95.6% (22,458)
Foreign-born residents in Raleigh 63,739 residents are foreign born (5.3% Latin America , 3.8% Asia , 2.3% Africa ).
This city:
13.2%North Carolina:
8.3%
Marital status for residents in Raleigh Marital status - White (Caucasian) population 15 years and over
Males 41.0% Never married48.7% Now married1.4% Separated2.2% Widowed6.6% DivorcedFemales 34.4% Never married47.1% Now married1.0% Separated6.0% Widowed11.5% DivorcedWomen who gave birth in the past 12 months Now married:
88.6% (3,134)Unmarried:
11.4% (402)
Women who did not give birth in the past 12 months Now married:
40.9% (26,942)Unmarried:
59.1% (38,897)
Marital status - Black or African American population 15 years and over
Males 50.3% Never married33.1% Now married3.1% Separated2.8% Widowed10.6% DivorcedFemales 53.1% Never married25.1% Now married4.6% Separated5.4% Widowed11.7% DivorcedWomen who gave birth in the past 12 months Now married:
58.5% (1,066)Unmarried:
41.5% (757)
Women who did not give birth in the past 12 months Now married:
26.0% (8,902)Unmarried:
74.0% (25,387)
Marital status - American Indian / Alaska Native population 15 years and over
Males 64.5% Never married16.6% Now married0.0% Separated3.7% Widowed15.1% DivorcedFemales 53.6% Never married21.1% Now married15.7% Separated1.9% Widowed7.6% DivorcedWomen who gave birth in the past 12 months Now married:
100.0% (41)Unmarried:
0.0% (0)
Women who did not give birth in the past 12 months Now married:
12.3% (60)Unmarried:
87.7% (429)
Marital status - Asian population 15 years and over
Males 42.7% Never married53.7% Now married0.2% Separated0.4% Widowed3.0% DivorcedFemales 34.2% Never married51.7% Now married1.1% Separated4.4% Widowed8.6% DivorcedWomen who gave birth in the past 12 months Now married:
100.0% (291)Unmarried:
0.0% (0)
Women who did not give birth in the past 12 months Now married:
65.4% (3,432)Unmarried:
34.6% (1,818)
Marital status - Native Hawaiian / Pacific Islander population 15 years and over
Males 0.0% Never married100.0% Now married0.0% Separated0.0% Widowed0.0% DivorcedFemales 0.0% Never married100.0% Now married0.0% Separated0.0% Widowed0.0% DivorcedWomen who did not give birth in the past 12 months Now married:
100.0% (119)Unmarried:
0.0% (0)
Marital status - Other race population 15 years and over
Males 58.7% Never married33.7% Now married1.2% Separated0.0% Widowed6.3% DivorcedFemales 48.6% Never married39.0% Now married2.0% Separated0.4% Widowed10.0% DivorcedWomen who gave birth in the past 12 months Now married:
89.2% (196)Unmarried:
10.8% (24)
Women who did not give birth in the past 12 months Now married:
38.7% (2,842)Unmarried:
61.3% (4,504)
Marital status - Two or more races population 15 years and over
Males 57.5% Never married37.0% Now married0.8% Separated0.0% Widowed4.7% DivorcedFemales 58.7% Never married27.8% Now married2.1% Separated5.1% Widowed6.3% DivorcedWomen who gave birth in the past 12 months Now married:
20.5% (266)Unmarried:
79.5% (1,034)
Women who did not give birth in the past 12 months Now married:
28.6% (4,136)Unmarried:
71.4% (10,342)
Marital status - White alone, not Hispanic / Latino population 15 years and over
Males 40.8% Never married48.7% Now married1.5% Separated2.3% Widowed6.8% DivorcedFemales 34.6% Never married47.4% Now married1.0% Separated5.7% Widowed11.3% DivorcedWomen who gave birth in the past 12 months Now married:
91.9% (3,134)Unmarried:
8.1% (278)
Women who did not give birth in the past 12 months Now married:
40.8% (26,159)Unmarried:
59.2% (37,934)
Marital status - Hispanic or Latino population 15 years and over
Males 60.5% Never married35.8% Now married0.5% Separated0.0% Widowed3.1% DivorcedFemales 55.0% Never married33.5% Now married0.0% Separated3.6% Widowed7.9% DivorcedWomen who gave birth in the past 12 months Now married:
40.7% (306)Unmarried:
59.3% (446)
Women who did not give birth in the past 12 months Now married:
32.4% (5,520)Unmarried:
67.6% (11,523)
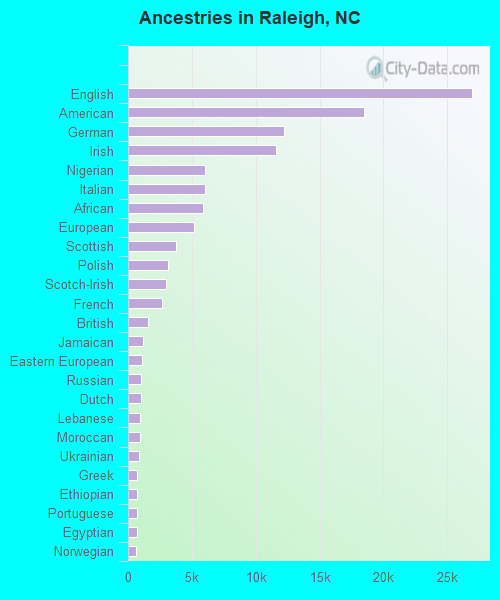
Ancestries in Raleigh
26,922 9.7% English18,497 6.7% American12,189 4.4% German11,564 4.2% Irish6,033 2.2% Nigerian6,032 2.2% Italian5,884 2.1% African5,140 1.9% European3,733 1.3% Scottish3,159 1.1% Polish2,963 1.1% Scotch-Irish2,655 1.0% French1,598 0.6% British1,164 0.4% Jamaican1,099 0.4% Eastern European1,033 0.4% Russian1,007 0.4% Dutch921 0.3% Lebanese911 0.3% Moroccan864 0.3% Ukrainian733 0.3% Greek704 0.3% Ethiopian700 0.3% Portuguese674 0.2% Egyptian648 0.2% Norwegian646 0.2% Iranian633 0.2% West Indian516 0.2% Scandinavian511 0.2% Romanian506 0.2% Palestinian460 0.2% Afghan441 0.2% Turkish437 0.2% French Canadian406 0.1% Swedish385 0.1% Canadian370 0.1% Arab361 0.1% Hungarian342 0.1% Northern European327 0.1% Welsh321 0.1% Haitian314 0.1% Kenyan307 0.1% Ghanaian276 0.10% Iraqi266 0.10% Senegalese264 0.10% Danish232 0.08% Czech205 0.07% Slovak188 0.07% Slavic175 0.06% Bulgarian171 0.06% Lithuanian163 0.06% Swiss156 0.06% Trinidadian and Tobagonian155 0.06% Cape Verdean149 0.05% Brazilian110 0.04% Slovene108 0.04% Austrian103 0.04% Croatian103 0.04% Belizean103 0.04% Bermudan102 0.04% South African87 0.03% Armenian77 0.03% Jordanian74 0.03% Finnish71 0.03% Bahamian64 0.02% Belgian62 0.02% British West Indian60 0.02% Syrian58 0.02% Liberian53 0.02% Czechoslovakian52 0.02% Sudanese48 0.02% Israeli47 0.02% Albanian44 0.02% New Zealander43 0.02% Cajun41 0.01% Basque39 0.01% Ugandan32 0.01% Serbian30 0.01% Latvian29 0.01% U.S. Virgin Islander26 0.01% Celtic24 0.01% Guyanese19 0.01% Icelander18 0.01% Sierra Leonean18 0.01% Estonian17 0.01% Australian14 0.01% Maltese
Geographical mobility in Raleigh Same house 1 year ago 211,724 83.6% White (Caucasian)104,472 83.6% Black or African American929 76.3% American Indian / Alaska Native16,294 84.4% Asian101 49.4% Native Hawaiian / Pacific Islander20,238 81.2% Other race36,800 76.7% Two or more races207,933 83.9% White alone, not Hispanic / Latino44,632 77.8% Hispanic or LatinoMoved within same county 17,734 7.0% White / Caucasian12,512 10.0% Black or African American104 8.5% American Indian / Alaska Native718 3.7% Asian41 20.1% Native Hawaiian / Pacific Islander2,342 9.4% Other race7,164 14.9% Two or more races17,092 6.9% White alone, not Hispanic / Latino8,468 14.8% Hispanic or LatinoMoved within same state 10,723 4.2% White / Caucasian4,676 3.7% Black or African American570 3.0% Asian1,249 5.0% Other race1,329 2.8% Two or more races10,622 4.3% White alone, not Hispanic / Latino1,449 2.5% Hispanic or LatinoMoved from different state 9,926 3.9% White / Caucasian3,018 2.4% Black or African American293 24.1% American Indian / Alaska Native1,203 6.2% Asian803 3.2% Other race2,327 4.9% Two or more races9,590 3.9% White alone, not Hispanic / Latino1,675 2.9% Hispanic or LatinoMoved from abroad 3,114 1.2% White245 0.2% Black or African American96 7.9% American Indian / Alaska Native515 2.7% Asian283 1.1% Other race356 0.7% Two or more races2,695 1.1% White alone, not Hispanic / Latino1,143 2.0% Hispanic or Latino
Children Nativity (place of birth) in Raleigh
Children under 6 years - Living with two parents Both parents native 17,059 100.0% NativeBoth parents foreign-born 3,781 96.0% Native156 4.0% Foreign-bornOne native, one foreign-born parent 786 100.0% NativeChildren under 6 years - Living with one parent Native parent 7,957 100.0% NativeForeign-born parent 1,590 89.8% Native180 10.2% Foreign-bornChildren 6 to 17 years - Living with two parents Both parents native 24,898 99.8% Native44 0.2% Foreign-bornBoth parents foreign-born 7,937 85.4% Native1,361 14.6% Foreign-bornOne native, one foreign-born parent 2,452 100.0% NativeChildren 6 to 17 years - Living with one parent Native parent 13,753 99.8% Native23 0.2% Foreign-bornForeign-born parent 4,927 66.8% Native2,452 33.2% Foreign-born
Place of birth for residents in Raleigh 27,113 Americas25,966 Latin America18,704 Asia16,881 Central America11,547 Africa7,353 South Central Asia6,192 South Eastern Asia6,122 Europe5,038 Caribbean4,078 Western Africa4,046 South America2,944 Eastern Asia2,898 Eastern Africa2,677 Eastern Europe2,127 Western Asia1,916 China1,882 Middle Africa1,878 Northern Africa1,565 Western Europe1,343 Northern Europe1,147 Northern America522 Southern Europe252 Oceania237 Australia and New Zealand Subregion200 Southern Africa10,612 Mexico4,722 India3,137 Vietnam3,116 El Salvador2,450 Nigeria2,284 Philippines2,074 Dominican Republic1,940 Honduras1,622 China1,367 Venezuela1,350 Kenya1,147 Canada1,142 Egypt1,035 Congo1,001 Iran909 Colombia813 Korea721 Guatemala688 Pakistan683 Democratic Republic of Congo (Zaire)660 Germany636 Morocco588 France561 Cuba558 Ethiopia558 Grenada539 Brazil531 Russia502 United Kingdom486 Peru459 England452 Trinidad and Tobago441 Iraq391 Jamaica389 Ukraine379 Poland372 Malaysia358 Dominica355 Bangladesh345 Romania340 Tanzania325 Eritrea320 Syria304 Afghanistan297 Senegal292 Haiti289 Turkey276 Ghana274 Taiwan250 Panama239 Argentina236 Yemen219 Lebanon216 Jordan215 Japan210 Spain205 Bahamas200 South Africa189 Australia189 Burma (Myanmar)183 Italy158 Zimbabwe149 Czechoslovakia143 Ecuador139 Israel137 Belgium133 Netherlands129 Nepal125 Hungary114 Belize111 Sweden109 Uruguay107 Liberia104 Croatia103 Chile102 Sierra Leone101 Nicaragua99 Ireland95 Greece87 Bolivia86 Bulgaria82 Thailand71 Georgia68 Sri Lanka67 Laos62 United Arab Emirates61 Belarus58 Saudi Arabia58 Uganda58 Guyana55 Kazakhstan54 West Indies52 Scotland48 New Zealand46 Austria44 St. Lucia44 Serbia42 Sudan42 Denmark39 Kuwait38 Indonesia38 Norway34 Latvia33 Algeria33 Portugal33 Moldova26 Uzbekistan25 Costa Rica23 St. Vincent and the Grenadines21 Singapore19 Hong Kong16 Bosnia and Herzegovina14 Fiji12 Togo11 Azerbaijan11 Lithuania5 Albania
Grandparents responsible for own grandchildren in Raleigh
Grandparents (30 to 59 years) White / Caucasian 242 50.2% Responsible for grandchildren240 49.8% Not responsible for grandchildrenBlack or African American 182 11.7% Responsible for grandchildren1,378 88.3% Not responsible for grandchildrenAmerican Indian / Alaska Native 5 100.0% Not responsible for grandchildrenAsian 19 100.0% Not responsible for grandchildrenOther race 107 47.1% Responsible for grandchildren120 52.9% Not responsible for grandchildrenTwo or more races 99 51.9% Responsible for grandchildren91 48.1% Not responsible for grandchildrenWhite alone, not Hispanic / Latino 252 62.7% Responsible for grandchildren150 37.3% Not responsible for grandchildrenHispanic or Latino 84 16.7% Responsible for grandchildren418 83.3% Not responsible for grandchildrenGrandparents (60 years and over) White / Caucasian 383 34.3% Responsible for grandchildren735 65.7% Not responsible for grandchildrenBlack or African American 568 35.3% Responsible for grandchildren1,043 64.7% Not responsible for grandchildrenAmerican Indian / Alaska Native 17 100.0% Not responsible for grandchildrenAsian 63 15.7% Responsible for grandchildren336 84.3% Not responsible for grandchildrenOther race 35 45.9% Responsible for grandchildren41 54.1% Not responsible for grandchildrenTwo or more races 58 52.5% Responsible for grandchildren52 47.5% Not responsible for grandchildrenWhite alone, not Hispanic / Latino 362 34.3% Responsible for grandchildren695 65.7% Not responsible for grandchildrenHispanic or Latino 29 14.1% Responsible for grandchildren176 85.9% Not responsible for grandchildren