Races in Quincy, Illinois (IL) Detailed Stats
Data:
Races - White alone (%)
Races - White alone (% change since 2000)
Races - Black alone (%)
Races - Black alone (% change since 2000)
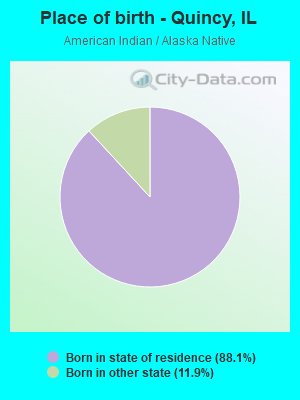
Races - American Indian alone (%)
Races - American Indian alone (% change since 2000)
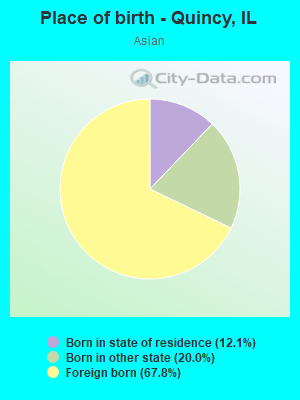
Races - Asian alone (%)
Races - Asian alone (% change since 2000)
Races - Hispanic (%)
Races - Hispanic (% change since 2000)
Races - Native Hawaiian and Other Pacific Islander alone (%)
Races - Native Hawaiian and Other Pacific Islander alone (% change since 2000)
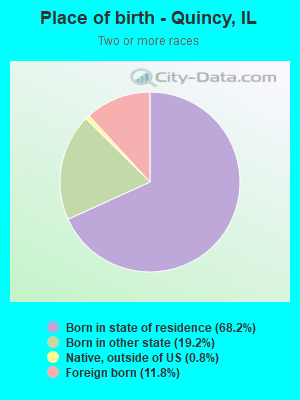
Races - Two or more races(%)
Races - Two or more races(% change since 2000)
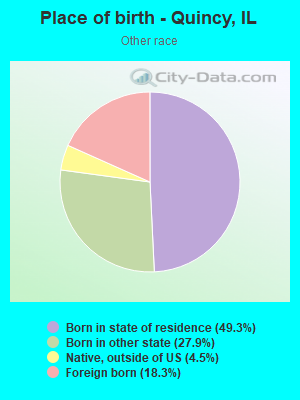
Races - Other race alone (%)
Races - Other race alone (% change since 2000)
Racial diversity
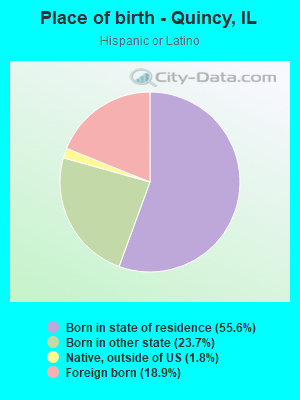
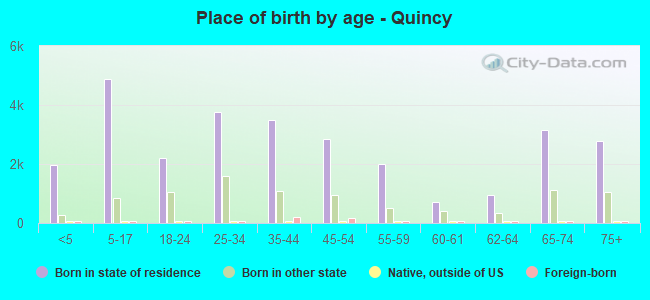
Place of birth - Born in state of residence (%)
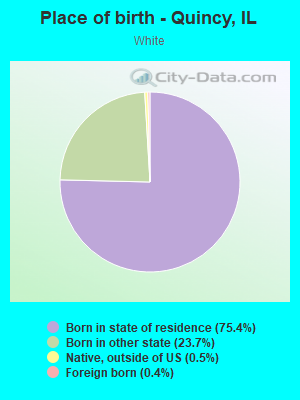
Place of birth - Born in state of residence (%) - White
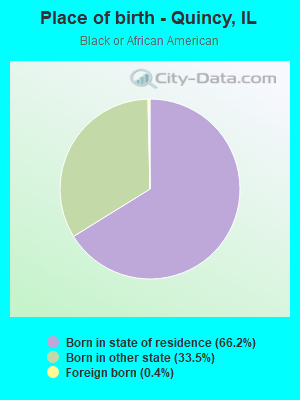
Place of birth - Born in state of residence (%) - Black or African American
Place of birth - Born in state of residence (%) - Asian
Place of birth - Born in state of residence (%) - Hispanic or Latino
Place of birth - Born in state of residence (%) - American Indian and Alaska Native
Place of birth - Born in state of residence (%) - Multirace
Place of birth - Born in state of residence (%) - Other Race
Place of birth - Born in other state (%)
Place of birth - Born in other state (%) - White
Place of birth - Born in other state (%) - Black or African American
Place of birth - Born in other state (%) - Asian
Place of birth - Born in other state (%) - Hispanic or Latino
Place of birth - Born in other state (%) - American Indian and Alaska Native
Place of birth - Born in other state (%) - Multirace
Place of birth - Born in other state (%) - Other Race
Place of birth - Native, outside of US (%)
Place of birth - Native, outside of US (%) - White
Place of birth - Native, outside of US (%) - Black or African American
Place of birth - Native, outside of US (%) - Asian
Place of birth - Native, outside of US (%) - Hispanic or Latino
Place of birth - Native, outside of US (%) - American Indian and Alaska Native
Place of birth - Native, outside of US (%) - Multirace
Place of birth - Native, outside of US (%) - Other Race
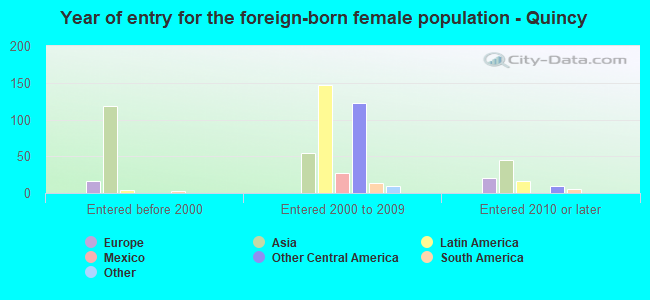
Place of birth - Foreign born (%)
Place of birth - Foreign born (%) - White
Place of birth - Foreign born (%) - Black or African American
Place of birth - Foreign born (%) - Asian
Place of birth - Foreign born (%) - Hispanic or Latino
Place of birth - Foreign born (%) - American Indian and Alaska Native
Place of birth - Foreign born (%) - Multirace
Place of birth - Foreign born (%) - Other Race
Residents speaking English at home (%)
Residents speaking English at home - Born in the United States (%)
Residents speaking English at home - Native, born elsewhere (%)
Residents speaking English at home - Foreign born (%)
Residents speaking Spanish at home (%)
Residents speaking Spanish at home - Born in the United States (%)
Residents speaking Spanish at home - Native, born elsewhere (%)
Residents speaking Spanish at home - Foreign born (%)
Residents speaking other language at home (%)
Residents speaking other language at home - Born in the United States (%)
Residents speaking other language at home - Native, born elsewhere (%)
Residents speaking other language at home - Foreign born (%)
Marital status - Never married (%)
Marital status - Now married (%)
Marital status - Separated (%)
Marital status - Widowed (%)
Marital status - Divorced (%)
Ancestries Reported - Arab (%)
Ancestries Reported - Czech (%)
Ancestries Reported - Danish (%)
Ancestries Reported - Dutch (%)
Ancestries Reported - English (%)
Ancestries Reported - French (%)
Ancestries Reported - French Canadian (%)
Ancestries Reported - German (%)
Ancestries Reported - Greek (%)
Ancestries Reported - Hungarian (%)
Ancestries Reported - Irish (%)
Ancestries Reported - Italian (%)
Ancestries Reported - Lithuanian (%)
Ancestries Reported - Norwegian (%)
Ancestries Reported - Polish (%)
Ancestries Reported - Portuguese (%)
Ancestries Reported - Russian (%)
Ancestries Reported - Scotch-Irish (%)
Ancestries Reported - Scottish (%)
Ancestries Reported - Slovak (%)
Ancestries Reported - Subsaharan African (%)
Ancestries Reported - Swedish (%)
Ancestries Reported - Swiss (%)
Ancestries Reported - Ukrainian (%)
Ancestries Reported - United States (%)
Ancestries Reported - Welsh (%)
Ancestries Reported - West Indian (%)
Ancestries Reported - Other (%)
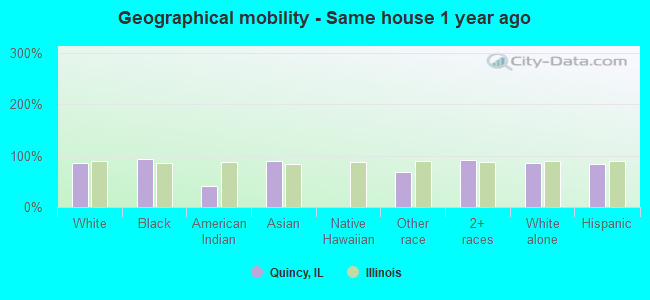
Geographical mobility - Same house 1 year ago (%)
Geographical mobility - Same house 1 year ago (%) - White
Geographical mobility - Same house 1 year ago (%) - Black or African American
Geographical mobility - Same house 1 year ago (%) - Asian
Geographical mobility - Same house 1 year ago (%) - Hispanic or Latino
Geographical mobility - Same house 1 year ago (%) - American Indian and Alaska Native
Geographical mobility - Same house 1 year ago (%) - Multirace
Geographical mobility - Same house 1 year ago (%) - Other Race
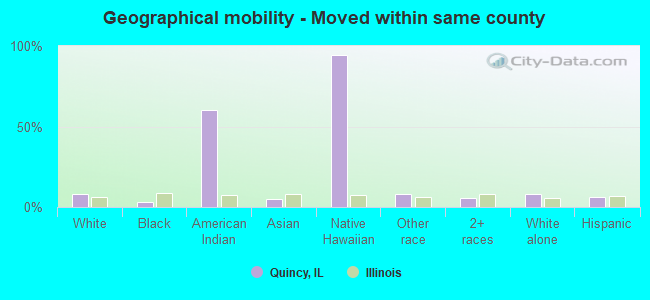
Geographical mobility - Moved within same county (%)
Geographical mobility - Moved within same county (%) - White
Geographical mobility - Moved within same county (%) - Black or African American
Geographical mobility - Moved within same county (%) - Asian
Geographical mobility - Moved within same county (%) - Hispanic or Latino
Geographical mobility - Moved within same county (%) - American Indian and Alaska Native
Geographical mobility - Moved within same county (%) - Multirace
Geographical mobility - Moved within same county (%) - Other Race
Geographical mobility - Moved from different county within same state (%)
Geographical mobility - Moved from different county within same state (%) - White
Geographical mobility - Moved from different county within same state (%) - Black or African American
Geographical mobility - Moved from different county within same state (%) - Asian
Geographical mobility - Moved from different county within same state (%) - Hispanic or Latino
Geographical mobility - Moved from different county within same state (%) - American Indian and Alaska Native
Geographical mobility - Moved from different county within same state (%) - Multirace
Geographical mobility - Moved from different county within same state (%) - Other Race
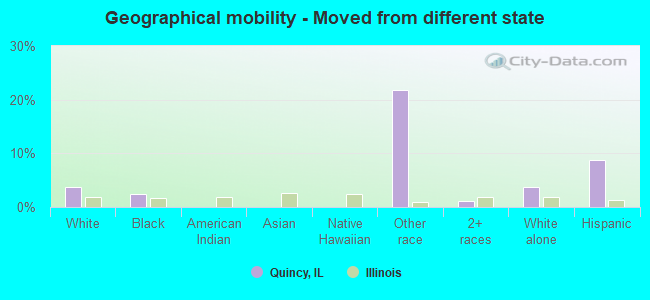
Geographical mobility - Moved from different state (%)
Geographical mobility - Moved from different state (%) - White
Geographical mobility - Moved from different state (%) - Black or African American
Geographical mobility - Moved from different state (%) - Asian
Geographical mobility - Moved from different state (%) - Hispanic or Latino
Geographical mobility - Moved from different state (%) - American Indian and Alaska Native
Geographical mobility - Moved from different state (%) - Multirace
Geographical mobility - Moved from different state (%) - Other Race
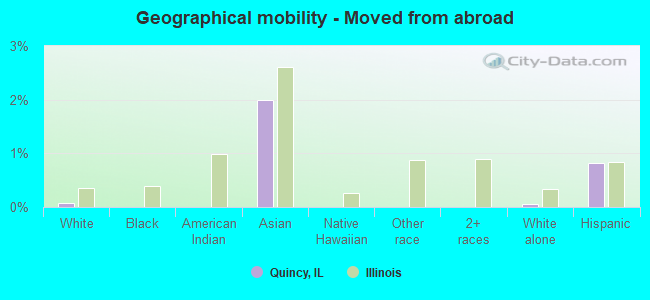
Geographical mobility - Moved from abroad (%)
Geographical mobility - Moved from abroad (%) - White
Geographical mobility - Moved from abroad (%) - Black or African American
Geographical mobility - Moved from abroad (%) - Asian
Geographical mobility - Moved from abroad (%) - Hispanic or Latino
Geographical mobility - Moved from abroad (%) - American Indian and Alaska Native
Geographical mobility - Moved from abroad (%) - Multirace
Geographical mobility - Moved from abroad (%) - Other Race
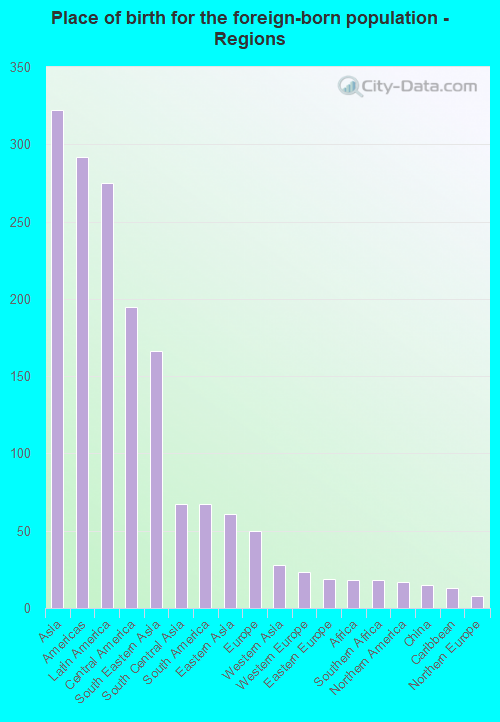
Place of birth for the foreign-born population - Ireland (%)
Place of birth for the foreign-born population - Denmark (%)
Place of birth for the foreign-born population - Norway (%)
Place of birth for the foreign-born population - Sweden (%)
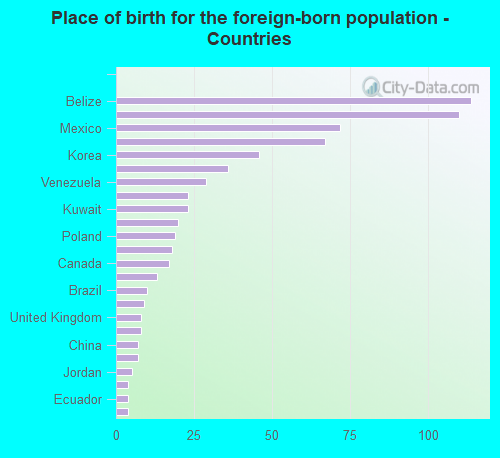
Place of birth for the foreign-born population - United Kingdom (%)
Place of birth for the foreign-born population - England (%)
Place of birth for the foreign-born population - Scotland (%)
Place of birth for the foreign-born population - Other Northern Europe (%)
Place of birth for the foreign-born population - Austria (%)
Place of birth for the foreign-born population - Belgium (%)
Place of birth for the foreign-born population - France (%)
Place of birth for the foreign-born population - Germany (%)
Place of birth for the foreign-born population - Netherlands (%)
Place of birth for the foreign-born population - Switzerland (%)
Place of birth for the foreign-born population - Other Western Europe (%)
Place of birth for the foreign-born population - Greece (%)
Place of birth for the foreign-born population - Italy (%)
Place of birth for the foreign-born population - Portugal (%)
Place of birth for the foreign-born population - Spain (%)
Place of birth for the foreign-born population - Other Southern Europe (%)
Place of birth for the foreign-born population - Albania (%)
Place of birth for the foreign-born population - Belarus (%)
Place of birth for the foreign-born population - Bosnia and Herzegovina (%)
Place of birth for the foreign-born population - Bulgaria (%)
Place of birth for the foreign-born population - Croatia (%)
Place of birth for the foreign-born population - Czechoslovakia (%)
Place of birth for the foreign-born population - Hungary (%)
Place of birth for the foreign-born population - Latvia (%)
Place of birth for the foreign-born population - Lithuania (%)
Place of birth for the foreign-born population - North Macedonia (Macedonia) (%)
Place of birth for the foreign-born population - Moldova (%)
Place of birth for the foreign-born population - Poland (%)
Place of birth for the foreign-born population - Romania (%)
Place of birth for the foreign-born population - Russia (%)
Place of birth for the foreign-born population - Serbia (%)
Place of birth for the foreign-born population - Ukraine (%)
Place of birth for the foreign-born population - Other Eastern Europe (%)
Place of birth for the foreign-born population - China (%)
Place of birth for the foreign-born population - Hong Kong (%)
Place of birth for the foreign-born population - Taiwan (%)
Place of birth for the foreign-born population - Japan (%)
Place of birth for the foreign-born population - Korea (%)
Place of birth for the foreign-born population - Other Eastern Asia (%)
Place of birth for the foreign-born population - Afghanistan (%)
Place of birth for the foreign-born population - Bangladesh (%)
Place of birth for the foreign-born population - India (%)
Place of birth for the foreign-born population - Iran (%)
Place of birth for the foreign-born population - Kazakhstan (%)
Place of birth for the foreign-born population - Nepal (%)
Place of birth for the foreign-born population - Pakistan (%)
Place of birth for the foreign-born population - Sri Lanka (%)
Place of birth for the foreign-born population - Uzbekistan (%)
Place of birth for the foreign-born population - Other South Central Asia (%)
Place of birth for the foreign-born population - Burma (%)
Place of birth for the foreign-born population - Cambodia (%)
Place of birth for the foreign-born population - Indonesia (%)
Place of birth for the foreign-born population - Laos (%)
Place of birth for the foreign-born population - Malaysia (%)
Place of birth for the foreign-born population - Philippines (%)
Place of birth for the foreign-born population - Singapore (%)
Place of birth for the foreign-born population - Thailand (%)
Place of birth for the foreign-born population - Vietnam (%)
Place of birth for the foreign-born population - Other South Eastern Asia (%)
Place of birth for the foreign-born population - Armenia (%)
Place of birth for the foreign-born population - Iraq (%)
Place of birth for the foreign-born population - Israel (%)
Place of birth for the foreign-born population - Jordan (%)
Place of birth for the foreign-born population - Kuwait (%)
Place of birth for the foreign-born population - Lebanon (%)
Place of birth for the foreign-born population - Saudi Arabia (%)
Place of birth for the foreign-born population - Syria (%)
Place of birth for the foreign-born population - Turkey (%)
Place of birth for the foreign-born population - Yemen (%)
Place of birth for the foreign-born population - Other Western Asia (%)
Place of birth for the foreign-born population - Eritrea (%)
Place of birth for the foreign-born population - Ethiopia (%)
Place of birth for the foreign-born population - Kenya (%)
Place of birth for the foreign-born population - Somalia (%)
Place of birth for the foreign-born population - Uganda (%)
Place of birth for the foreign-born population - Zimbabwe (%)
Place of birth for the foreign-born population - Other Eastern Africa (%)
Place of birth for the foreign-born population - Cameroon (%)
Place of birth for the foreign-born population - Congo (%)
Place of birth for the foreign-born population - Democratic Republic of Congo (Zaire) (%)
Place of birth for the foreign-born population - Other Middle Africa (%)
Place of birth for the foreign-born population - Egypt (%)
Place of birth for the foreign-born population - Morocco (%)
Place of birth for the foreign-born population - Sudan (%)
Place of birth for the foreign-born population - Other Northern Africa (%)
Place of birth for the foreign-born population - South Africa (%)
Place of birth for the foreign-born population - Other Southern Africa (%)
Place of birth for the foreign-born population - Cabo Verde (%)
Place of birth for the foreign-born population - Ghana (%)
Place of birth for the foreign-born population - Liberia (%)
Place of birth for the foreign-born population - Nigeria (%)
Place of birth for the foreign-born population - Senegal (%)
Place of birth for the foreign-born population - Sierra Leone (%)
Place of birth for the foreign-born population - Other Western Africa (%)
Place of birth for the foreign-born population - Australia (%)
Place of birth for the foreign-born population - New Zealand (%)
Place of birth for the foreign-born population - Fiji (%)
Place of birth for the foreign-born population - Micronesia (%)
Place of birth for the foreign-born population - Bahamas (%)
Place of birth for the foreign-born population - Barbados (%)
Place of birth for the foreign-born population - Cuba (%)
Place of birth for the foreign-born population - Dominica (%)
Place of birth for the foreign-born population - Dominican Republic (%)
Place of birth for the foreign-born population - Grenada (%)
Place of birth for the foreign-born population - Haiti (%)
Place of birth for the foreign-born population - Jamaica (%)
Place of birth for the foreign-born population - St. Vincent and the Grenadines (%)
Place of birth for the foreign-born population - Trinidad and Tobago (%)
Place of birth for the foreign-born population - West Indies (%)
Place of birth for the foreign-born population - Other Caribbean (%)
Place of birth for the foreign-born population - Belize (%)
Place of birth for the foreign-born population - Costa Rica (%)
Place of birth for the foreign-born population - El Salvador (%)
Place of birth for the foreign-born population - Guatemala (%)
Place of birth for the foreign-born population - Honduras (%)
Place of birth for the foreign-born population - Mexico (%)
Place of birth for the foreign-born population - Nicaragua (%)
Place of birth for the foreign-born population - Panama (%)
Place of birth for the foreign-born population - Other Central America (%)
Place of birth for the foreign-born population - Argentina (%)
Place of birth for the foreign-born population - Bolivia (%)
Place of birth for the foreign-born population - Brazil (%)
Place of birth for the foreign-born population - Chile (%)
Place of birth for the foreign-born population - Colombia (%)
Place of birth for the foreign-born population - Ecuador (%)
Place of birth for the foreign-born population - Guyana (%)
Place of birth for the foreign-born population - Peru (%)
Place of birth for the foreign-born population - Uruguay (%)
Place of birth for the foreign-born population - Venezuela (%)
Place of birth for the foreign-born population - Other South America (%)
Place of birth for the foreign-born population - Canada (%)
Place of birth for the foreign-born population - Other Northern America (%)
Place of birth for the foreign-born population - Other (%)
Latest news about races in Quincy, IL collected exclusively by city-data.com from local newspapers, TV, and radio stations
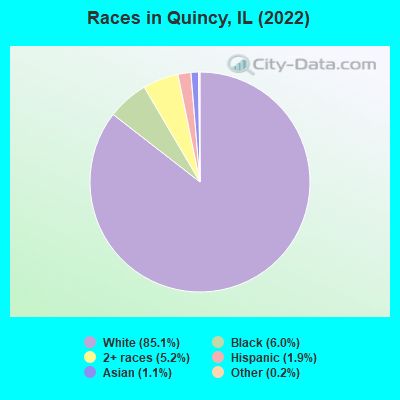
According to 2022 data, the most numerous races in Quincy, IL are White alone (33,109 residents), Hispanic (757 residents), and Black alone (2,318 residents). 96.1% of Quincy residents speak English at home. 1.8% of Quincy, IL residents are foreign-born , which is 696.2% less than the foreign-born rate of 14.0% across the entire state of Illinois.
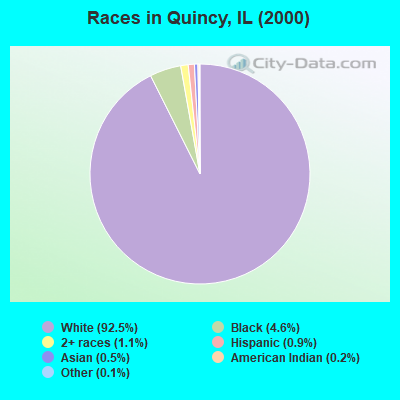
Race distribution in Quincy
2000 2022
8,424,140 67.8% White alone 1,856,152 14.9% Black alone 1,530,262 12.3% Hispanic 419,916 3.4% Asian alone 153,996 1.2% Two or more races 13,479 0.1% Other race alone 18,232 0.1% American Indian alone 3,116 0.03% Native Hawaiian and Other
7,356,301 58.5% White alone 2,299,726 18.3% Hispanic 1,660,423 13.2% Black alone 747,296 5.9% Asian alone 458,599 3.6% Two or more races 45,386 0.4% Other race alone 10,405 0.08% American Indian alone 3,896 0.03% Native Hawaiian and Other
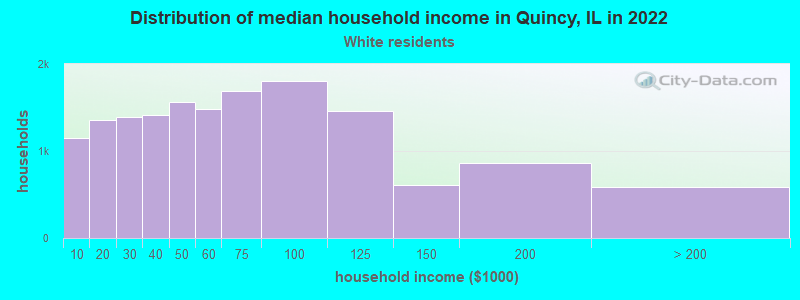
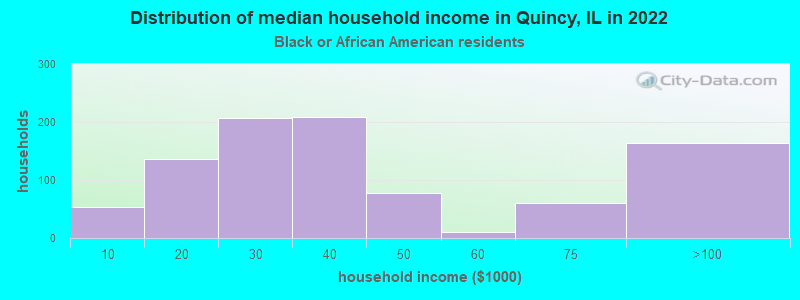
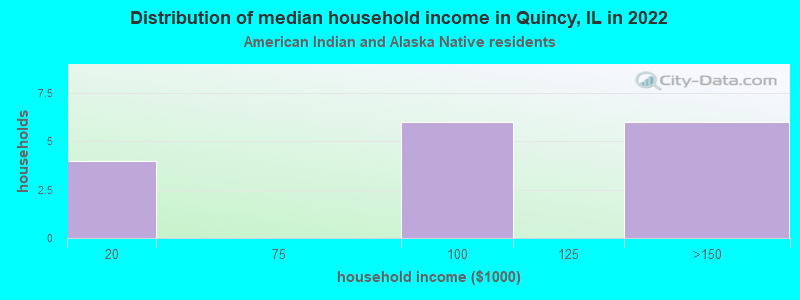
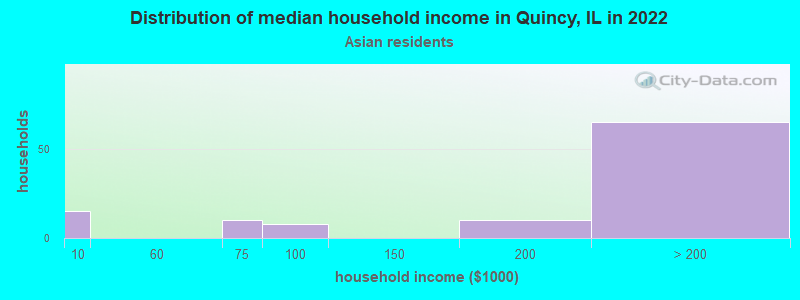
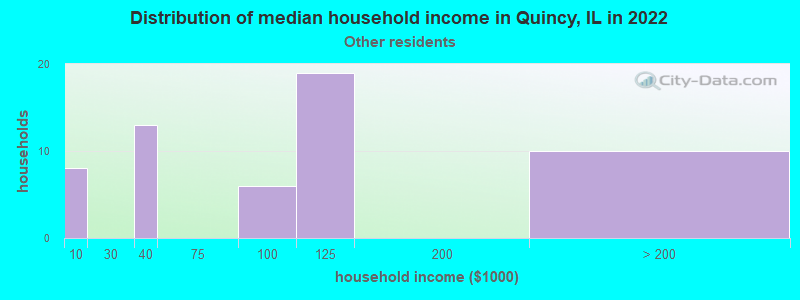
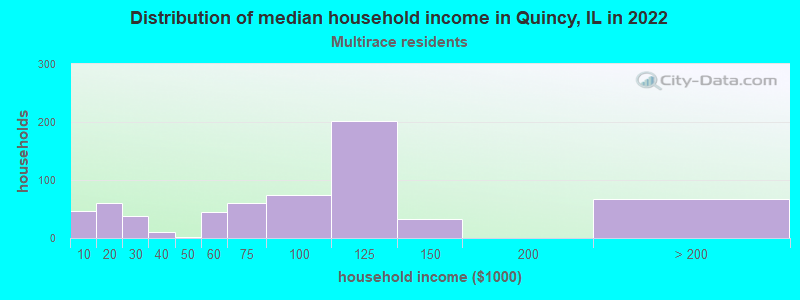
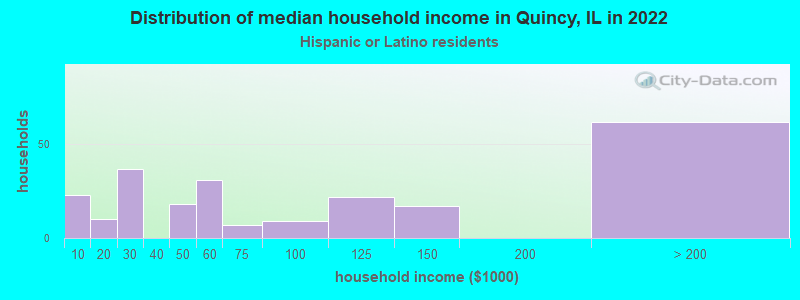
Income and house value in Quincy Median household income in 2022 $53,222 White non-Hispanic householders$29,648 Black householdersover $200,000 Asian householders$91,733 Two or more races householders$61,124 Hispanic or Latino race householdersMedian 2022 house value $153,110 White Non-Hispanic householders$112,784 Black or African American householders$242,604 American Indian or Alaska Native householders $224,705 Asian householders$296,516 Some other race householders$118,606 Two or more races householders$331,020 Hispanic or Latino householders
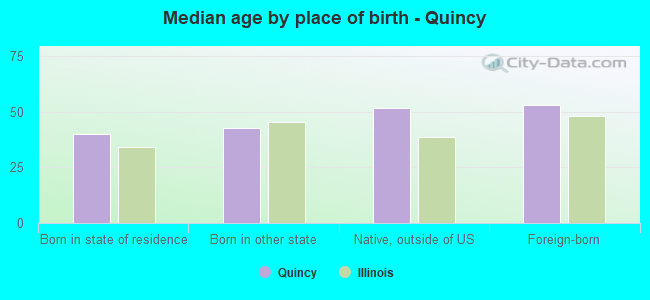
Median age by race in Quincy
43.1 Median age for White residents41.8 45.1 32.2 Median age for Black or African American residents33.8 28.5 51.3 Median age for American Indian / Alaska Native residents52.2 -688,956,432.9 42.4 Median age for Asian residents22.5 43.1 -593,236,714.4 Median age for Native Hawaiian / Pacific Islander residents-658,536,584.7 -576,015,108.0 27.7 Median age for Other race residents28.0 19.2 16.9 Median age for Two or more races residents13.6 20.8 42.4 Median age for White alone residents41.2 44.3 33.2 Median age for Hispanic or Latino residents34.1 24.7
Owner/renter occupied households by race in Quincy
House owners and renters - White residents 10,328 67.9% Owner occupied4,885 32.1% Renter occupiedHouse owners and renters - Black or African American residents 307 33.5% Owner occupied609 66.5% Renter occupiedHouse owners and renters - American Indian / Alaska Native residents 5 35.8% Owner occupied9 64.2% Renter occupiedHouse owners and renters - Asian residents 95 86.2% Owner occupied15 13.8% Renter occupiedHouse owners and renters - Other race residents 42 72.9% Owner occupied16 27.1% Renter occupiedHouse owners and renters - Two or more races residents 339 53.2% Owner occupied297 46.8% Renter occupiedHouse owners and renters - White alone residents 10,556 67.2% Owner occupied5,144 32.8% Renter occupiedHouse owners and renters - Hispanic or Latino residents 142 58.7% Owner occupied100 41.3% Renter occupied
Language usage in Quincy
English speakers - Total 96.1% of residents of Quincy speak English at home.
1.4% of residents speak Spanish at home 404 81.0% Speak English very well95 19.0% Speak English less than very well2.0% of residents speak other language at home 626 85.1% Speak English very well110 14.9% Speak English less than very well
English speakers - Born in the United States 96.8% of residents of Quincy speak English at home.
2.0% of residents speak Spanish at home 161 92.5% Speak English very well13 7.5% Speak English less than very well0.9% of residents speak other language at home 75 92.6% Speak English very well6 7.4% Speak English less than very well
All residents speak only English at home
English speakers - Foreign-born 28.1% of residents of Quincy speak English at home.
17.1% of residents speak Spanish at home 84 71.8% Speak English very well33 28.2% Speak English less than very well53.2% of residents speak other language at home 300 82.4% Speak English very well64 17.6% Speak English less than very well
White (Caucasian) - Speak only English Native:
100.0% (30,456)Foreign-born:
24.3% (29)
White (Caucasian) - Speak another language Native:
1.3% (396)Foreign-born:
76.5% (93)
Black or African American - Speak another language Native:
1.2% (26)Foreign-born:
95.1% (8)
Asian - Speak only English Native:
59.0% (67)Foreign-born:
10.5% (30)
Asian - Speak another language Native:
40.8% (46)Foreign-born:
89.6% (256)
Other race - Speak another language Native:
41.7% (78)Foreign-born:
99.9% (41)
Two or more races - Speak only English Native:
96.6% (1,705)Foreign-born:
66.0% (191)
Two or more races - Speak another language Native:
1.2% (21)Foreign-born:
30.9% (89)
White alone - Speak only English Native:
98.2% (30,757)Foreign-born:
33.0% (25)
White alone - Speak another language Native:
1.8% (549)Foreign-born:
65.7% (50)
Hispanic or Latino - Speak only English Native:
80.2% (411)Foreign-born:
16.5% (24)
Hispanic or Latino - Speak another language Native:
22.0% (113)Foreign-born:
83.2% (120)
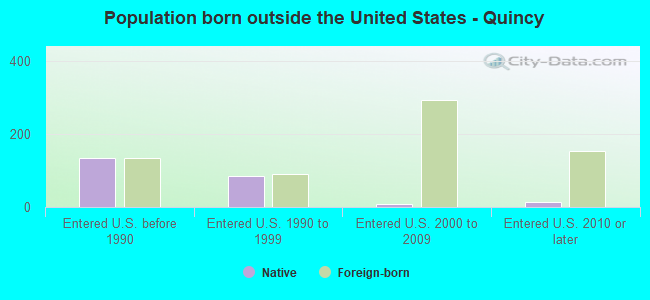
Foreign-born residents in Quincy 684 residents are foreign born
This city:
1.8%Illinois:
14.1%
Marital status for residents in Quincy Marital status - White (Caucasian) population 15 years and over
Males 34.1% Never married48.9% Now married1.8% Separated4.0% Widowed11.1% DivorcedFemales 26.2% Never married43.5% Now married1.6% Separated11.5% Widowed17.3% DivorcedWomen who gave birth in the past 12 months Now married:
68.4% (265)Unmarried:
31.6% (123)
Women who did not give birth in the past 12 months Now married:
41.0% (2,601)Unmarried:
59.0% (3,744)
Marital status - Black or African American population 15 years and over
Males 49.3% Never married35.4% Now married0.0% Separated0.0% Widowed15.3% DivorcedFemales 45.8% Never married13.9% Now married17.2% Separated4.7% Widowed18.3% DivorcedWomen who gave birth in the past 12 months Now married:
0.0% (0)Unmarried:
100.0% (69)
Women who did not give birth in the past 12 months Now married:
27.8% (117)Unmarried:
72.2% (305)
Marital status - American Indian / Alaska Native population 15 years and over
Males 0.0% Never married58.3% Now married0.0% Separated0.0% Widowed41.7% DivorcedFemales 0.0% Never married60.0% Now married0.0% Separated40.0% Widowed0.0% DivorcedMarital status - Asian population 15 years and over
Males 41.9% Never married58.1% Now married0.0% Separated0.0% Widowed0.0% DivorcedFemales 5.0% Never married74.1% Now married9.1% Separated8.6% Widowed3.2% DivorcedWomen who gave birth in the past 12 months Now married:
100.0% (7)Unmarried:
0.0% (0)
Women who did not give birth in the past 12 months Now married:
82.4% (85)Unmarried:
17.6% (18)
Marital status - Other race population 15 years and over
Males 47.4% Never married33.3% Now married0.0% Separated5.3% Widowed14.0% DivorcedFemales 39.6% Never married60.4% Now married0.0% Separated0.0% Widowed0.0% DivorcedWomen who did not give birth in the past 12 months Now married:
34.5% (12)Unmarried:
65.5% (22)
Marital status - Two or more races population 15 years and over
Males 63.1% Never married20.9% Now married0.8% Separated7.4% Widowed7.7% DivorcedFemales 44.7% Never married41.2% Now married0.0% Separated8.0% Widowed6.0% DivorcedWomen who did not give birth in the past 12 months Now married:
22.7% (100)Unmarried:
77.3% (341)
Marital status - White alone, not Hispanic / Latino population 15 years and over
Males 33.9% Never married49.0% Now married1.8% Separated4.1% Widowed11.2% DivorcedFemales 26.1% Never married43.4% Now married1.6% Separated11.5% Widowed17.4% DivorcedWomen who gave birth in the past 12 months Now married:
67.5% (272)Unmarried:
32.5% (131)
Women who did not give birth in the past 12 months Now married:
40.9% (2,744)Unmarried:
59.1% (3,957)
Marital status - Hispanic or Latino population 15 years and over
Males 51.5% Never married33.0% Now married2.3% Separated6.5% Widowed6.8% DivorcedFemales 33.3% Never married56.1% Now married2.1% Separated3.8% Widowed4.6% DivorcedWomen who gave birth in the past 12 months Now married:
100.0% (11)Unmarried:
0.0% (0)
Women who did not give birth in the past 12 months Now married:
52.3% (80)Unmarried:
47.7% (73)
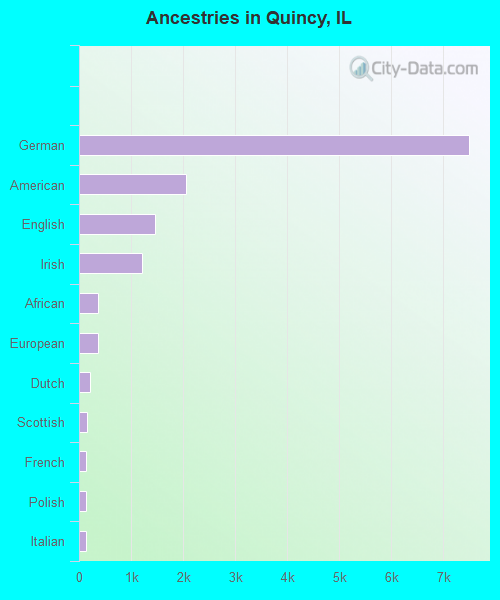
Ancestries in Quincy
7,499 42.2% German2,054 11.6% American1,469 8.3% English1,219 6.9% Irish371 2.1% African361 2.0% European211 1.2% Dutch162 0.9% Scottish142 0.8% French129 0.7% Polish126 0.7% Italian68 0.4% Swedish63 0.4% Norwegian55 0.3% Scotch-Irish42 0.2% Sudanese39 0.2% Scandinavian37 0.2% French Canadian37 0.2% Hungarian34 0.2% British24 0.1% Eastern European24 0.1% Danish24 0.1% Lebanese24 0.1% Welsh23 0.1% Swiss18 0.1% Pennsylvania German14 0.08% Greek14 0.08% Czech14 0.08% Belgian10 0.06% Brazilian7 0.04% British West Indian6 0.03% Finnish6 0.03% Northern European6 0.03% Slovak5 0.03% Jordanian3 0.02% Russian
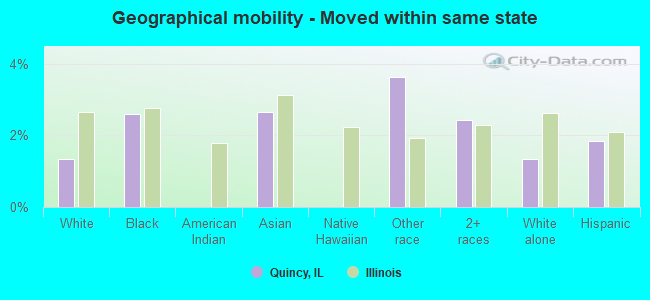
Geographical mobility in Quincy Same house 1 year ago 27,229 86.7% White (Caucasian)2,171 93.0% Black or African American11 41.1% American Indian / Alaska Native376 90.1% Asian154 67.8% Other race2,180 90.7% Two or more races28,436 86.7% White alone, not Hispanic / Latino594 83.5% Hispanic or LatinoMoved within same county 2,553 8.1% White / Caucasian69 2.9% Black or African American16 60.0% American Indian / Alaska Native21 5.1% Asian2 94.6% Native Hawaiian / Pacific Islander19 8.4% Other race128 5.3% Two or more races2,692 8.2% White alone, not Hispanic / Latino46 6.5% Hispanic or LatinoMoved within same state 425 1.4% White / Caucasian61 2.6% Black or African American11 2.7% Asian8 3.6% Other race58 2.4% Two or more races436 1.3% White alone, not Hispanic / Latino13 1.9% Hispanic or LatinoMoved from different state 1,172 3.7% White / Caucasian56 2.4% Black or African American50 21.8% Other race29 1.2% Two or more races1,194 3.6% White alone, not Hispanic / Latino63 8.8% Hispanic or LatinoMoved from abroad 21 0.1% White8 2.0% Asian19 0.1% White alone, not Hispanic / Latino6 0.8% Hispanic or Latino
Children Nativity (place of birth) in Quincy
Children under 6 years - Living with two parents Both parents native 1,491 100.0% NativeBoth parents foreign-born 26 100.0% NativeOne native, one foreign-born parent 6 100.0% NativeChildren under 6 years - Living with one parent Native parent 991 100.0% NativeForeign-born parent 11 100.0% NativeChildren 6 to 17 years - Living with two parents Both parents native 2,824 99.4% Native16 0.6% Foreign-bornBoth parents foreign-born 39 100.0% NativeOne native, one foreign-born parent 47 100.0% NativeChildren 6 to 17 years - Living with one parent Native parent 2,071 100.0% NativeForeign-born parent 15 49.8% Native15 50.2% Foreign-born
Grandparents responsible for own grandchildren in Quincy
Grandparents (30 to 59 years) White / Caucasian 234 74.5% Responsible for grandchildren80 25.5% Not responsible for grandchildrenAmerican Indian / Alaska Native 3 100.0% Not responsible for grandchildrenTwo or more races 10 100.0% Responsible for grandchildrenWhite alone, not Hispanic / Latino 259 72.7% Responsible for grandchildren97 27.3% Not responsible for grandchildrenHispanic or Latino 3 100.0% Not responsible for grandchildrenGrandparents (60 years and over) White / Caucasian 176 50.4% Responsible for grandchildren174 49.6% Not responsible for grandchildrenWhite alone, not Hispanic / Latino 191 49.8% Responsible for grandchildren192 50.2% Not responsible for grandchildrenHispanic or Latino 4 100.0% Not responsible for grandchildren