Races in Putnam District, Connecticut (CT) Detailed Stats
Ancestries, Foreign-born residents, place of birth

Discuss Putnam District, Connecticut races on our local forum with over 2,400,000 registered users
2.4% of Putnam District, CT residents are foreign-born (1.6% born in Europe, 0.6% born in North America), which is 520.8% less than the foreign-born rate of 15.0% across the entire state of Connecticut.
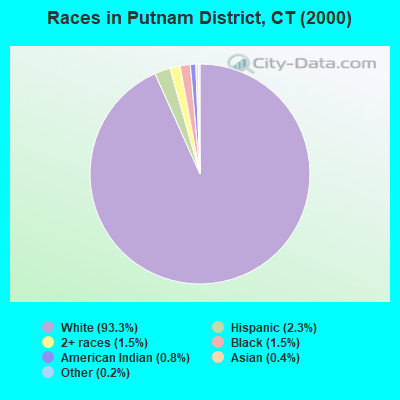
Race distribution in Putnam District

- 6,29393.3%White alone
- 1552.3%Hispanic
- 981.5%Black alone
- 1011.5%Two or more races
- 570.8%American Indian alone
- 270.4%Asian alone
- 110.2%Other race alone
- 40.06%Native Hawaiian and Other
Pacific Islander alone
2000
2022
-
- 2,638,84577.5%White alone
- 320,3239.4%Hispanic
- 295,5718.7%Black alone
- 81,5642.4%Asian alone
- 52,8961.6%Two or more races
- 8,1410.2%Other race alone
- 7,2670.2%American Indian alone
- 9580.03%Native Hawaiian and Other
Pacific Islander alone

-
- 2,246,91362.0%White alone
- 658,97818.2%Hispanic
- 353,9739.8%Black alone
- 172,9294.8%Asian alone
- 159,6314.4%Two or more races
- 29,7610.8%Other race alone
- 3,4280.09%American Indian alone
- 5920.02%Native Hawaiian and Other
Pacific Islander alone

Income and house value in Putnam District
- Median household income in 2022
- $65,556White non-Hispanic householders
- $34,004Black householders
- $37,385Asian householders
- $60,873Two or more races householders
- $96,401Hispanic or Latino race householders
- Median 2022 house value
- $212,297White Non-Hispanic householders
- $183,760Two or more races householders
- $351,307Hispanic or Latino householders
Household income for White non-Hispanic householders

Household income for Black householders

Household income for Asian householders

Household income for Two or more races householders

Household income for Hispanic or Latino race householders

Foreign-born residents in Putnam District
163 residents are foreign born (1.6% Europe, 0.6% North America).
| This city: | 2.4% |
| Connecticut: | 10.9% |
Ancestries in Putnam District

- 1,63419.6%French
- 1,36016.3%French Canadian
- 94011.3%Irish
- 86210.3%Other
- 8189.8%English
- 7098.5%Polish
- 5426.5%Italian
- 4255.1%German
- 2593.1%United States
- 1742.1%Scottish
- 1461.7%Swedish
- 871.0%Scotch-Irish
- 630.8%Dutch
- 560.7%Portuguese
- 520.6%Russian
- 440.5%Lithuanian
- 430.5%Arab
- 300.4%Norwegian
- 240.3%Subsaharan African
- 220.3%Ukrainian
- 160.2%Danish
- 160.2%Slovak
- 90.1%Greek
- 90.1%Hungarian
- 80.10%Welsh

Zip codes: 06260.