Races in Punta Gorda, Florida (FL) Detailed Stats
Ancestries, Foreign-born residents, place of birth
Settings
X


Recent posts about races in Punta Gorda, Florida on our local forum with over 2,400,000 registered users:
 | Cost of building a new house in PG (10 replies) |
| North Port, Punta Gorda, Port Charlotte, or Cape Coral areas? (62 replies) |
| My Lottery Dream Home - Punta Gorda (8 replies) |
| House hunting (5 replies) |
| Florida water toxins FEAR about closing on a house... (13 replies) |
| Pros and Cons of Punta Gorda vs. Port Charlotte (18 replies) |
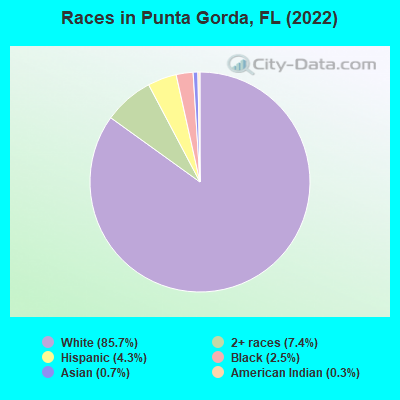
According to 2022 data, the most numerous races in Punta Gorda, FL are White alone (17,931 residents), Hispanic (902 residents), and Black alone (525 residents). 93.0% of Punta Gorda residents speak English at home. 8.1% of Punta Gorda, FL residents are foreign-born (3.0% born in Europe, 1.8% born in North America, 1.6% born in Latin America, 1.4% born in Asia), which is 159.8% less than the foreign-born rate of 21.0% across the entire state of Florida.
Race distribution in Punta Gorda
2000
2022

- 13,37393.2%White alone
- 4473.1%Black alone
- 2852.0%Hispanic
- 1120.8%Asian alone
- 860.6%Two or more races
- 230.2%American Indian alone
- 150.1%Other race alone
- 30.02%Native Hawaiian and Other
Pacific Islander alone

-
- 17,93185.7%White alone
- 1,5567.4%Two or more races
- 9024.3%Hispanic
- 5252.5%Black alone
- 1470.7%Asian alone
- 560.3%American Indian alone
- 140.07%Native Hawaiian and Other
Pacific Islander alone - 110.05%Other race alone
2000
2022
-
- 10,458,50965.4%White alone
- 2,682,71516.8%Hispanic
- 2,264,26814.2%Black alone
- 261,6931.6%Asian alone
- 236,9541.5%Two or more races
- 42,3580.3%American Indian alone
- 28,9940.2%Other race alone
- 6,8870.04%Native Hawaiian and Other
Pacific Islander alone

-
- 11,309,40350.8%White alone
- 6,025,03927.1%Hispanic
- 3,241,01514.6%Black alone
- 861,6303.9%Two or more races
- 623,6922.8%Asian alone
- 152,0540.7%Other race alone
- 22,5040.1%American Indian alone
- 9,4860.04%Native Hawaiian and Other
Pacific Islander alone

Income and house value in Punta Gorda
- Median household income in 2022
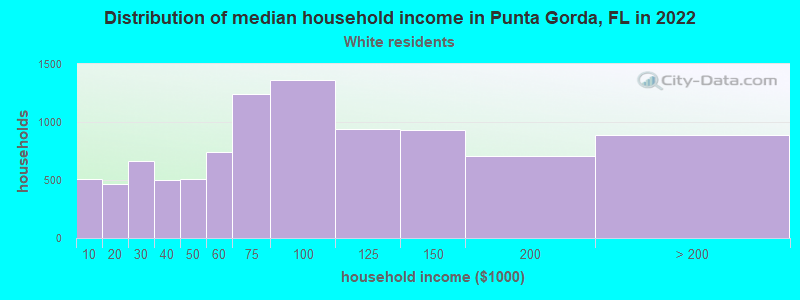
- $80,642White non-Hispanic householders
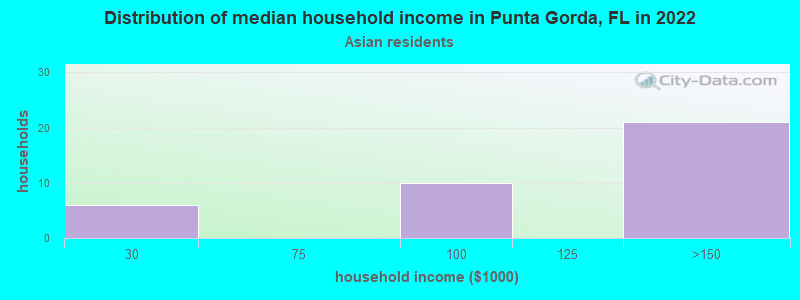
- $128,754Asian householders
- $89,649Two or more races householders
- $69,485Hispanic or Latino race householders
- Median 2022 house value
- $639,830White Non-Hispanic householders
- $185,606Black or African American householders
- $427,486American Indian or Alaska Native householders
- $854,972Asian householders
- $767,921Two or more races householders
- $386,447Hispanic or Latino householders
Household income for White non-Hispanic householders
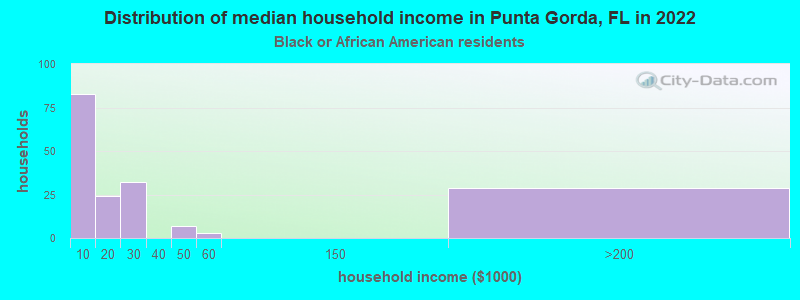
Household income for Black householders
Household income for Asian householders
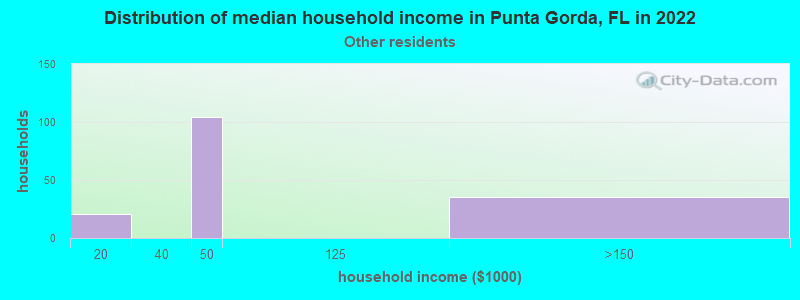
Household income for Some other race householders
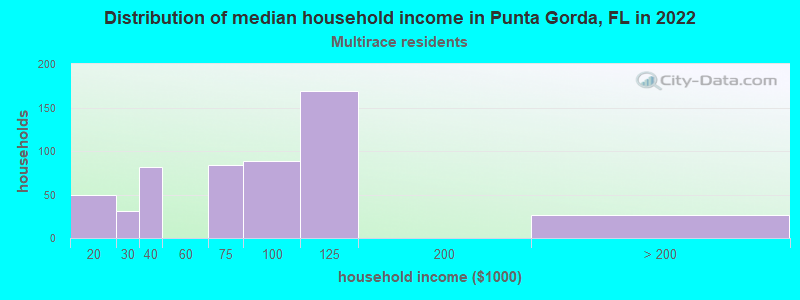
Household income for Two or more races householders
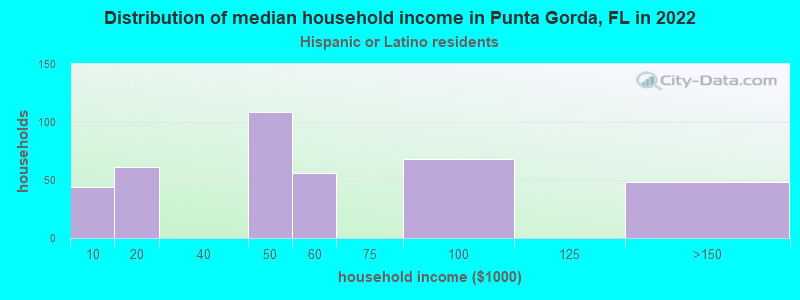
Household income for Hispanic or Latino race householders
Median age by race in Punta Gorda
- 68.6Median age for White residents
- 68.8Males
- 68.1Females
- 32.4Median age for Black or African American residents
- 34.7Males
- 17.2Females
- 45.8Median age for American Indian / Alaska Native residents
- -611,418,047.3Males
- 61.4Females
- 77.3Median age for Asian residents
- -730,696,797.8Males
- 77.8Females
- -679,849,340.2Median age for Native Hawaiian / Pacific Islander residents
- -666,666,666.0Males
- -443,298,968.6Females
- 70.7Median age for Other race residents
- 69.0Males
- -670,289,854.4Females
- 47.5Median age for Two or more races residents
- 36.2Males
- 48.4Females
- 68.5Median age for White alone residents
- 69.2Males
- 67.9Females
- 59.1Median age for Hispanic or Latino residents
- 59.7Males
- 61.2Females
Owner/renter occupied households by race in Punta Gorda
- House owners and renters - White residents
- 8,13185.0%Owner occupied
- 1,43115.0%Renter occupied
- House owners and renters - Black or African American residents
- 1814.6%Owner occupied
- 10485.4%Renter occupied
- House owners and renters - Asian residents
- 2256.4%Owner occupied
- 1743.6%Renter occupied
- House owners and renters - Native Hawaiian / Pacific Islander residents
- 17100.0%Owner occupied
- House owners and renters - Other race residents
- 11668.8%Owner occupied
- 5331.2%Renter occupied
- House owners and renters - Two or more races residents
- 44681.7%Owner occupied
- 10018.3%Renter occupied
- House owners and renters - White alone residents
- 8,14985.9%Owner occupied
- 1,34214.1%Renter occupied
- House owners and renters - Hispanic or Latino residents
- 22866.6%Owner occupied
- 11433.4%Renter occupied
Language usage in Punta Gorda
- English speakers - Total
- 93.0% of residents of Punta Gorda speak English at home.
- 2.7% of residents speak Spanish at home
- 44078.7%Speak English very well
- 11921.3%Speak English less than very well
- 4.2% of residents speak other language at home
- 65977.0%Speak English very well
- 19723.0%Speak English less than very well
- English speakers - Born in the United States
- 97.2% of residents of Punta Gorda speak English at home.
- 1.9% of residents speak Spanish at home
- 22574.8%Speak English very well
- 7625.2%Speak English less than very well
- 0.7% of residents speak other language at home
- 106100.0%Speak English very well
- English speakers - Native, born elsewhere
- 39.6% of residents of Punta Gorda speak English at home.
- 58.1% of residents speak Spanish at home
- 10075.8%Speak English very well
- 3224.2%Speak English less than very well
- 3.5% of residents speak other language at home
- 8100.0%Speak English less than very well
- English speakers - Foreign-born
- 60.0% of residents of Punta Gorda speak English at home.
- 7.0% of residents speak Spanish at home
- 10381.1%Speak English very well
- 2418.9%Speak English less than very well
- 37.8% of residents speak other language at home
- 51775.0%Speak English very well
- 17225.0%Speak English less than very well
White (Caucasian) - Speak only English
| Native: | 98.1% (16,093) |
| Foreign-born: | 58.9% (818) |
White (Caucasian) - Speak another language
| Native: | 1.9% (318) |
| Foreign-born: | 40.6% (564) |
Black or African American - Speak only English
| Native: | 99.8% (467) |
| Foreign-born: | 97.0% (15) |
American Indian / Alaska Native - Speak only English
| Native: | 77.0% (52) |
| Foreign-born: | 61.4% (18) |
Other race - Speak only English
| Native: | 43.4% (16) |
| Foreign-born: | 71.5% (107) |
Other race - Speak another language
| Native: | 57.0% (20) |
| Foreign-born: | 27.4% (41) |
Two or more races - Speak only English
| Native: | 79.6% (1,606) |
| Foreign-born: | 19.4% (19) |
Two or more races - Speak another language
| Native: | 14.5% (292) |
| Foreign-born: | 67.1% (65) |
White alone - Speak only English
| Native: | 98.7% (15,984) |
| Foreign-born: | 53.8% (800) |
White alone - Speak another language
| Native: | 1.4% (220) |
| Foreign-born: | 44.4% (660) |
Hispanic or Latino - Speak only English
| Native: | 36.9% (241) |
| Foreign-born: | 81.2% (205) |
Hispanic or Latino - Speak another language
| Native: | 64.2% (419) |
| Foreign-born: | 41.4% (105) |
Foreign-born residents in Punta Gorda
1,691 residents are foreign born (3.0% Europe, 1.8% North America, 1.6% Latin America, 1.4% Asia).
| This city: | 8.1% |
| Florida: | 21.1% |


Marital status for residents in Punta Gorda
Marital status - White (Caucasian) population 15 years and over
- Males
- 13.4%Never married
- 70.4%Now married
- 0.1%Separated
- 6.4%Widowed
- 9.7%Divorced
- Females
- 9.1%Never married
- 63.4%Now married
- 0.4%Separated
- 14.0%Widowed
- 13.1%Divorced
Women who gave birth in the past 12 months
| Now married: | 84.6% (22) |
| Unmarried: | 15.4% (4) |
Women who did not give birth in the past 12 months
| Now married: | 36.3% (470) |
| Unmarried: | 63.7% (825) |
Marital status - Black or African American population 15 years and over
- Males
- 70.5%Never married
- 26.3%Now married
- 0.0%Separated
- 3.2%Widowed
- 0.0%Divorced
- Females
- 41.7%Never married
- 25.8%Now married
- 2.3%Separated
- 25.0%Widowed
- 5.3%Divorced
Women who did not give birth in the past 12 months
| Now married: | 0.0% (0) |
| Unmarried: | 100.0% (54) |
Marital status - American Indian / Alaska Native population 15 years and over
- Males
- 0.0%Never married
- 100.0%Now married
- 0.0%Separated
- 0.0%Widowed
- 0.0%Divorced
- Females
- 0.0%Never married
- 56.2%Now married
- 0.0%Separated
- 0.0%Widowed
- 43.8%Divorced
Marital status - Asian population 15 years and over
- Males
- 0.0%Never married
- 100.0%Now married
- 0.0%Separated
- 0.0%Widowed
- 0.0%Divorced
- Females
- 0.0%Never married
- 53.1%Now married
- 0.0%Separated
- 46.9%Widowed
- 0.0%Divorced
Women who did not give birth in the past 12 months
| Now married: | 100.0% (46) |
| Unmarried: | 0.0% (0) |
Marital status - Other race population 15 years and over
- Males
- 0.0%Never married
- 7.1%Now married
- 15.2%Separated
- 0.0%Widowed
- 77.8%Divorced
- Females
- 0.0%Never married
- 100.0%Now married
- 0.0%Separated
- 0.0%Widowed
- 0.0%Divorced
Marital status - Two or more races population 15 years and over
- Males
- 29.9%Never married
- 61.1%Now married
- 1.9%Separated
- 0.0%Widowed
- 7.0%Divorced
- Females
- 29.1%Never married
- 62.0%Now married
- 4.6%Separated
- 1.8%Widowed
- 2.4%Divorced
Women who did not give birth in the past 12 months
| Now married: | 49.2% (199) |
| Unmarried: | 50.8% (205) |
Marital status - White alone, not Hispanic / Latino population 15 years and over
- Males
- 12.3%Never married
- 71.1%Now married
- 0.1%Separated
- 6.6%Widowed
- 9.9%Divorced
- Females
- 8.6%Never married
- 63.8%Now married
- 0.2%Separated
- 14.4%Widowed
- 12.9%Divorced
Women who gave birth in the past 12 months
| Now married: | 84.6% (23) |
| Unmarried: | 15.4% (4) |
Women who did not give birth in the past 12 months
| Now married: | 37.9% (479) |
| Unmarried: | 62.1% (785) |
Marital status - Hispanic or Latino population 15 years and over
- Males
- 40.5%Never married
- 27.5%Now married
- 7.6%Separated
- 0.0%Widowed
- 24.4%Divorced
- Females
- 14.5%Never married
- 68.2%Now married
- 4.3%Separated
- 1.9%Widowed
- 11.2%Divorced
Women who did not give birth in the past 12 months
| Now married: | 42.5% (63) |
| Unmarried: | 57.5% (85) |
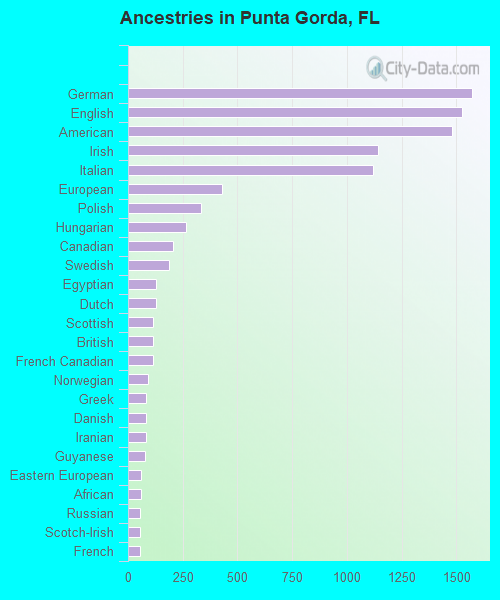
Ancestries in Punta Gorda

- 1,57013.7%German
- 1,52413.3%English
- 1,48012.9%American
- 1,1419.9%Irish
- 1,1219.8%Italian
- 4303.7%European
- 3322.9%Polish
- 2672.3%Hungarian
- 2061.8%Canadian
- 1851.6%Swedish
- 1291.1%Egyptian
- 1291.1%Dutch
- 1161.0%Scottish
- 1141.0%British
- 1121.0%French Canadian
- 920.8%Norwegian
- 840.7%Greek
- 830.7%Danish
- 810.7%Iranian
- 760.7%Guyanese
- 600.5%Eastern European
- 600.5%African
- 550.5%Russian
- 550.5%Scotch-Irish
- 540.5%French
- 530.5%Ukrainian
- 410.4%Scandinavian
- 400.3%Portuguese
- 310.3%Northern European
- 310.3%Czech
- 290.3%Australian
- 280.2%Brazilian
- 200.2%South African
- 190.2%Israeli
- 160.1%Bulgarian
- 140.1%Jamaican
- 110.10%Slovak
- 90.08%Icelander
- 90.08%Lithuanian
- 90.08%Swiss
- 80.07%Lebanese
- 80.07%New Zealander
- 80.07%Welsh
Geographical mobility in Punta Gorda

- Same house 1 year ago
- 15,43886.0%White (Caucasian)
- 545100.0%Black or African American
- 8482.9%American Indian / Alaska Native
- 4429.9%Asian
- 14100.0%Native Hawaiian / Pacific Islander
- 14578.5%Other race
- 1,96392.1%Two or more races
- 15,42286.6%White alone, not Hispanic / Latino
- 71177.8%Hispanic or Latino

-
- Moved within same county
- 6243.5%White / Caucasian
- 4832.7%Asian
- 5563.1%White alone, not Hispanic / Latino
- 465.0%Hispanic or Latino

-
- Moved within same state
- 6033.4%White / Caucasian
- 1716.9%American Indian / Alaska Native
- 53.4%Asian
- 95.0%Other race
- 1296.0%Two or more races
- 5623.2%White alone, not Hispanic / Latino
- 768.3%Hispanic or Latino

-
- Moved from different state
- 1,0295.7%White / Caucasian
- 20.4%Black or African American
- 3720.2%Other race
- 482.2%Two or more races
- 1,0145.7%White alone, not Hispanic / Latino
- 606.5%Hispanic or Latino

-
- Moved from abroad
- 2371.3%White
- 4430.0%Asian
- 2511.4%White alone, not Hispanic / Latino

Children Nativity (place of birth) in Punta Gorda
Place of birth for residents in Punta Gorda
![Place of birth for the foreign-born population - Regions]()
- 701Americas
- 626Europe
- 369Northern America
- 331Latin America
- 291Northern Europe
- 286Asia
- 165Western Europe
- 163South America
- 116Caribbean
- 97South Eastern Asia
- 90Eastern Europe
- 78Southern Europe
- 76Eastern Asia
- 73South Central Asia
- 51Central America
- 41Africa
- 35Oceania
- 35Australia and New Zealand Subregion
- 29Northern Africa
- 20Western Asia
- 11Southern Africa

![Place of birth for the foreign-born population - Countries]()
- 369Canada
- 128Germany
- 113United Kingdom
- 88Guyana
- 73Iran
- 70Cuba
- 65England
- 60Ireland
- 56Philippines
- 55Japan
- 53Italy
- 52Sweden
- 41Thailand
- 38Guatemala
- 30Dominican Republic
- 29Egypt
- 27Chile
- 27Ecuador
- 26Australia
- 25Greece
- 21Korea
- 20Netherlands
- 20Israel
- 20Brazil
- 17Bosnia and Herzegovina
- 17Russia
- 15Jamaica
- 14Bulgaria
- 12Belize
- 11Poland
- 11South Africa
- 10Czechoslovakia
- 9Hungary
- 9New Zealand
- 8France
- 8Switzerland
- 8Ukraine

Grandparents responsible for own grandchildren in Punta Gorda
Zip codes: 33950.