Races in Pullman, Washington (WA) Detailed Stats
Data:
Races - White alone (%)
Races - White alone (% change since 2000)
Races - Black alone (%)
Races - Black alone (% change since 2000)
Races - American Indian alone (%)
Races - American Indian alone (% change since 2000)
Races - Asian alone (%)
Races - Asian alone (% change since 2000)
Races - Hispanic (%)
Races - Hispanic (% change since 2000)
Races - Native Hawaiian and Other Pacific Islander alone (%)
Races - Native Hawaiian and Other Pacific Islander alone (% change since 2000)
Races - Two or more races(%)
Races - Two or more races(% change since 2000)
Races - Other race alone (%)
Races - Other race alone (% change since 2000)
Racial diversity
Place of birth - Born in state of residence (%)
Place of birth - Born in state of residence (%) - White
Place of birth - Born in state of residence (%) - Black or African American
Place of birth - Born in state of residence (%) - Asian
Place of birth - Born in state of residence (%) - Hispanic or Latino
Place of birth - Born in state of residence (%) - American Indian and Alaska Native
Place of birth - Born in state of residence (%) - Multirace
Place of birth - Born in state of residence (%) - Other Race
Place of birth - Born in other state (%)
Place of birth - Born in other state (%) - White
Place of birth - Born in other state (%) - Black or African American
Place of birth - Born in other state (%) - Asian
Place of birth - Born in other state (%) - Hispanic or Latino
Place of birth - Born in other state (%) - American Indian and Alaska Native
Place of birth - Born in other state (%) - Multirace
Place of birth - Born in other state (%) - Other Race
Place of birth - Native, outside of US (%)
Place of birth - Native, outside of US (%) - White
Place of birth - Native, outside of US (%) - Black or African American
Place of birth - Native, outside of US (%) - Asian
Place of birth - Native, outside of US (%) - Hispanic or Latino
Place of birth - Native, outside of US (%) - American Indian and Alaska Native
Place of birth - Native, outside of US (%) - Multirace
Place of birth - Native, outside of US (%) - Other Race
Place of birth - Foreign born (%)
Place of birth - Foreign born (%) - White
Place of birth - Foreign born (%) - Black or African American
Place of birth - Foreign born (%) - Asian
Place of birth - Foreign born (%) - Hispanic or Latino
Place of birth - Foreign born (%) - American Indian and Alaska Native
Place of birth - Foreign born (%) - Multirace
Place of birth - Foreign born (%) - Other Race
Residents speaking English at home (%)
Residents speaking English at home - Born in the United States (%)
Residents speaking English at home - Native, born elsewhere (%)
Residents speaking English at home - Foreign born (%)
Residents speaking Spanish at home (%)
Residents speaking Spanish at home - Born in the United States (%)
Residents speaking Spanish at home - Native, born elsewhere (%)
Residents speaking Spanish at home - Foreign born (%)
Residents speaking other language at home (%)
Residents speaking other language at home - Born in the United States (%)
Residents speaking other language at home - Native, born elsewhere (%)
Residents speaking other language at home - Foreign born (%)
Marital status - Never married (%)
Marital status - Now married (%)
Marital status - Separated (%)
Marital status - Widowed (%)
Marital status - Divorced (%)
Ancestries Reported - Arab (%)
Ancestries Reported - Czech (%)
Ancestries Reported - Danish (%)
Ancestries Reported - Dutch (%)
Ancestries Reported - English (%)
Ancestries Reported - French (%)
Ancestries Reported - French Canadian (%)
Ancestries Reported - German (%)
Ancestries Reported - Greek (%)
Ancestries Reported - Hungarian (%)
Ancestries Reported - Irish (%)
Ancestries Reported - Italian (%)
Ancestries Reported - Lithuanian (%)
Ancestries Reported - Norwegian (%)
Ancestries Reported - Polish (%)
Ancestries Reported - Portuguese (%)
Ancestries Reported - Russian (%)
Ancestries Reported - Scotch-Irish (%)
Ancestries Reported - Scottish (%)
Ancestries Reported - Slovak (%)
Ancestries Reported - Subsaharan African (%)
Ancestries Reported - Swedish (%)
Ancestries Reported - Swiss (%)
Ancestries Reported - Ukrainian (%)
Ancestries Reported - United States (%)
Ancestries Reported - Welsh (%)
Ancestries Reported - West Indian (%)
Ancestries Reported - Other (%)
Geographical mobility - Same house 1 year ago (%)
Geographical mobility - Same house 1 year ago (%) - White
Geographical mobility - Same house 1 year ago (%) - Black or African American
Geographical mobility - Same house 1 year ago (%) - Asian
Geographical mobility - Same house 1 year ago (%) - Hispanic or Latino
Geographical mobility - Same house 1 year ago (%) - American Indian and Alaska Native
Geographical mobility - Same house 1 year ago (%) - Multirace
Geographical mobility - Same house 1 year ago (%) - Other Race
Geographical mobility - Moved within same county (%)
Geographical mobility - Moved within same county (%) - White
Geographical mobility - Moved within same county (%) - Black or African American
Geographical mobility - Moved within same county (%) - Asian
Geographical mobility - Moved within same county (%) - Hispanic or Latino
Geographical mobility - Moved within same county (%) - American Indian and Alaska Native
Geographical mobility - Moved within same county (%) - Multirace
Geographical mobility - Moved within same county (%) - Other Race
Geographical mobility - Moved from different county within same state (%)
Geographical mobility - Moved from different county within same state (%) - White
Geographical mobility - Moved from different county within same state (%) - Black or African American
Geographical mobility - Moved from different county within same state (%) - Asian
Geographical mobility - Moved from different county within same state (%) - Hispanic or Latino
Geographical mobility - Moved from different county within same state (%) - American Indian and Alaska Native
Geographical mobility - Moved from different county within same state (%) - Multirace
Geographical mobility - Moved from different county within same state (%) - Other Race
Geographical mobility - Moved from different state (%)
Geographical mobility - Moved from different state (%) - White
Geographical mobility - Moved from different state (%) - Black or African American
Geographical mobility - Moved from different state (%) - Asian
Geographical mobility - Moved from different state (%) - Hispanic or Latino
Geographical mobility - Moved from different state (%) - American Indian and Alaska Native
Geographical mobility - Moved from different state (%) - Multirace
Geographical mobility - Moved from different state (%) - Other Race
Geographical mobility - Moved from abroad (%)
Geographical mobility - Moved from abroad (%) - White
Geographical mobility - Moved from abroad (%) - Black or African American
Geographical mobility - Moved from abroad (%) - Asian
Geographical mobility - Moved from abroad (%) - Hispanic or Latino
Geographical mobility - Moved from abroad (%) - American Indian and Alaska Native
Geographical mobility - Moved from abroad (%) - Multirace
Geographical mobility - Moved from abroad (%) - Other Race
Place of birth for the foreign-born population - Ireland (%)
Place of birth for the foreign-born population - Denmark (%)
Place of birth for the foreign-born population - Norway (%)
Place of birth for the foreign-born population - Sweden (%)
Place of birth for the foreign-born population - United Kingdom (%)
Place of birth for the foreign-born population - England (%)
Place of birth for the foreign-born population - Scotland (%)
Place of birth for the foreign-born population - Other Northern Europe (%)
Place of birth for the foreign-born population - Austria (%)
Place of birth for the foreign-born population - Belgium (%)
Place of birth for the foreign-born population - France (%)
Place of birth for the foreign-born population - Germany (%)
Place of birth for the foreign-born population - Netherlands (%)
Place of birth for the foreign-born population - Switzerland (%)
Place of birth for the foreign-born population - Other Western Europe (%)
Place of birth for the foreign-born population - Greece (%)
Place of birth for the foreign-born population - Italy (%)
Place of birth for the foreign-born population - Portugal (%)
Place of birth for the foreign-born population - Spain (%)
Place of birth for the foreign-born population - Other Southern Europe (%)
Place of birth for the foreign-born population - Albania (%)
Place of birth for the foreign-born population - Belarus (%)
Place of birth for the foreign-born population - Bosnia and Herzegovina (%)
Place of birth for the foreign-born population - Bulgaria (%)
Place of birth for the foreign-born population - Croatia (%)
Place of birth for the foreign-born population - Czechoslovakia (%)
Place of birth for the foreign-born population - Hungary (%)
Place of birth for the foreign-born population - Latvia (%)
Place of birth for the foreign-born population - Lithuania (%)
Place of birth for the foreign-born population - North Macedonia (Macedonia) (%)
Place of birth for the foreign-born population - Moldova (%)
Place of birth for the foreign-born population - Poland (%)
Place of birth for the foreign-born population - Romania (%)
Place of birth for the foreign-born population - Russia (%)
Place of birth for the foreign-born population - Serbia (%)
Place of birth for the foreign-born population - Ukraine (%)
Place of birth for the foreign-born population - Other Eastern Europe (%)
Place of birth for the foreign-born population - China (%)
Place of birth for the foreign-born population - Hong Kong (%)
Place of birth for the foreign-born population - Taiwan (%)
Place of birth for the foreign-born population - Japan (%)
Place of birth for the foreign-born population - Korea (%)
Place of birth for the foreign-born population - Other Eastern Asia (%)
Place of birth for the foreign-born population - Afghanistan (%)
Place of birth for the foreign-born population - Bangladesh (%)
Place of birth for the foreign-born population - India (%)
Place of birth for the foreign-born population - Iran (%)
Place of birth for the foreign-born population - Kazakhstan (%)
Place of birth for the foreign-born population - Nepal (%)
Place of birth for the foreign-born population - Pakistan (%)
Place of birth for the foreign-born population - Sri Lanka (%)
Place of birth for the foreign-born population - Uzbekistan (%)
Place of birth for the foreign-born population - Other South Central Asia (%)
Place of birth for the foreign-born population - Burma (%)
Place of birth for the foreign-born population - Cambodia (%)
Place of birth for the foreign-born population - Indonesia (%)
Place of birth for the foreign-born population - Laos (%)
Place of birth for the foreign-born population - Malaysia (%)
Place of birth for the foreign-born population - Philippines (%)
Place of birth for the foreign-born population - Singapore (%)
Place of birth for the foreign-born population - Thailand (%)
Place of birth for the foreign-born population - Vietnam (%)
Place of birth for the foreign-born population - Other South Eastern Asia (%)
Place of birth for the foreign-born population - Armenia (%)
Place of birth for the foreign-born population - Iraq (%)
Place of birth for the foreign-born population - Israel (%)
Place of birth for the foreign-born population - Jordan (%)
Place of birth for the foreign-born population - Kuwait (%)
Place of birth for the foreign-born population - Lebanon (%)
Place of birth for the foreign-born population - Saudi Arabia (%)
Place of birth for the foreign-born population - Syria (%)
Place of birth for the foreign-born population - Turkey (%)
Place of birth for the foreign-born population - Yemen (%)
Place of birth for the foreign-born population - Other Western Asia (%)
Place of birth for the foreign-born population - Eritrea (%)
Place of birth for the foreign-born population - Ethiopia (%)
Place of birth for the foreign-born population - Kenya (%)
Place of birth for the foreign-born population - Somalia (%)
Place of birth for the foreign-born population - Uganda (%)
Place of birth for the foreign-born population - Zimbabwe (%)
Place of birth for the foreign-born population - Other Eastern Africa (%)
Place of birth for the foreign-born population - Cameroon (%)
Place of birth for the foreign-born population - Congo (%)
Place of birth for the foreign-born population - Democratic Republic of Congo (Zaire) (%)
Place of birth for the foreign-born population - Other Middle Africa (%)
Place of birth for the foreign-born population - Egypt (%)
Place of birth for the foreign-born population - Morocco (%)
Place of birth for the foreign-born population - Sudan (%)
Place of birth for the foreign-born population - Other Northern Africa (%)
Place of birth for the foreign-born population - South Africa (%)
Place of birth for the foreign-born population - Other Southern Africa (%)
Place of birth for the foreign-born population - Cabo Verde (%)
Place of birth for the foreign-born population - Ghana (%)
Place of birth for the foreign-born population - Liberia (%)
Place of birth for the foreign-born population - Nigeria (%)
Place of birth for the foreign-born population - Senegal (%)
Place of birth for the foreign-born population - Sierra Leone (%)
Place of birth for the foreign-born population - Other Western Africa (%)
Place of birth for the foreign-born population - Australia (%)
Place of birth for the foreign-born population - New Zealand (%)
Place of birth for the foreign-born population - Fiji (%)
Place of birth for the foreign-born population - Micronesia (%)
Place of birth for the foreign-born population - Bahamas (%)
Place of birth for the foreign-born population - Barbados (%)
Place of birth for the foreign-born population - Cuba (%)
Place of birth for the foreign-born population - Dominica (%)
Place of birth for the foreign-born population - Dominican Republic (%)
Place of birth for the foreign-born population - Grenada (%)
Place of birth for the foreign-born population - Haiti (%)
Place of birth for the foreign-born population - Jamaica (%)
Place of birth for the foreign-born population - St. Vincent and the Grenadines (%)
Place of birth for the foreign-born population - Trinidad and Tobago (%)
Place of birth for the foreign-born population - West Indies (%)
Place of birth for the foreign-born population - Other Caribbean (%)
Place of birth for the foreign-born population - Belize (%)
Place of birth for the foreign-born population - Costa Rica (%)
Place of birth for the foreign-born population - El Salvador (%)
Place of birth for the foreign-born population - Guatemala (%)
Place of birth for the foreign-born population - Honduras (%)
Place of birth for the foreign-born population - Mexico (%)
Place of birth for the foreign-born population - Nicaragua (%)
Place of birth for the foreign-born population - Panama (%)
Place of birth for the foreign-born population - Other Central America (%)
Place of birth for the foreign-born population - Argentina (%)
Place of birth for the foreign-born population - Bolivia (%)
Place of birth for the foreign-born population - Brazil (%)
Place of birth for the foreign-born population - Chile (%)
Place of birth for the foreign-born population - Colombia (%)
Place of birth for the foreign-born population - Ecuador (%)
Place of birth for the foreign-born population - Guyana (%)
Place of birth for the foreign-born population - Peru (%)
Place of birth for the foreign-born population - Uruguay (%)
Place of birth for the foreign-born population - Venezuela (%)
Place of birth for the foreign-born population - Other South America (%)
Place of birth for the foreign-born population - Canada (%)
Place of birth for the foreign-born population - Other Northern America (%)
Place of birth for the foreign-born population - Other (%)
Latest news about races in Pullman, WA collected exclusively by city-data.com from local newspapers, TV, and radio stations
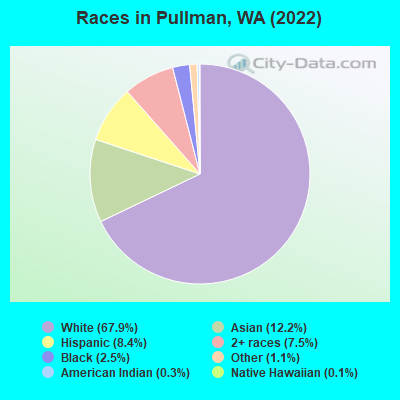
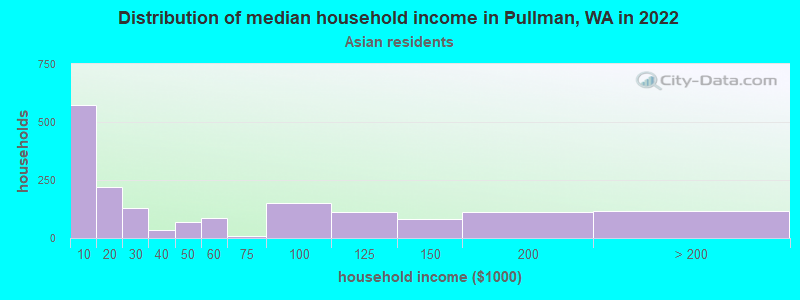
According to 2022 data, the most numerous races in Pullman, WA are White alone (21,973 residents), Hispanic (2,712 residents), and Asian alone (3,939 residents). 82.4% of Pullman residents speak English at home. 13.3% of Pullman, WA residents are foreign-born (8.1% born in Asia, 1.9% born in Europe, 1.5% born in Latin America), which is 13.0% less than the foreign-born rate of 15.0% across the entire state of Washington.
Race distribution in Pullman
2000 2022
4,652,490 78.9% White alone 441,509 7.5% Hispanic 319,401 5.4% Asian alone 184,631 3.1% Black alone 175,926 3.0% Two or more races 85,396 1.4% American Indian alone 22,779 0.4% Native Hawaiian and Other 11,989 0.2% Other race alone
4,941,456 63.5% White alone 1,093,313 14.0% Hispanic 755,832 9.7% Asian alone 523,448 6.7% Two or more races 299,537 3.8% Black alone 69,024 0.9% American Indian alone 52,231 0.7% Native Hawaiian and Other 50,945 0.7% Other race alone
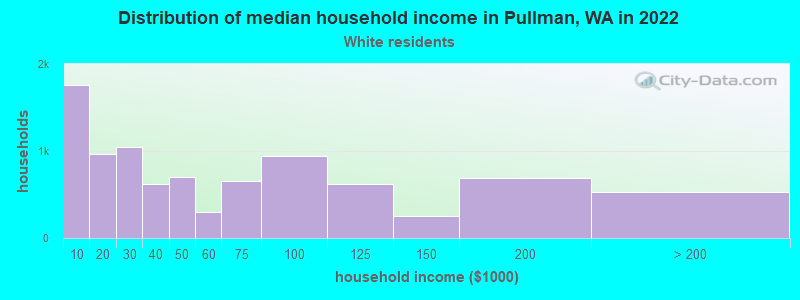
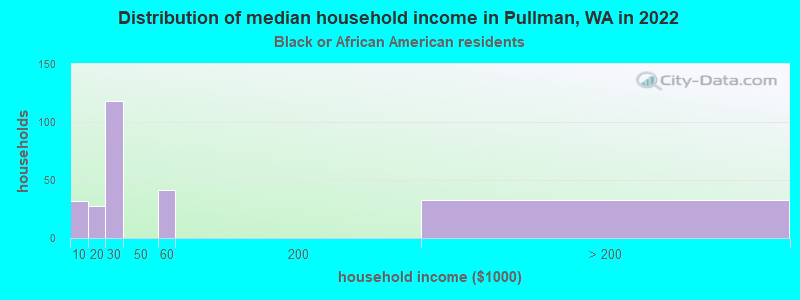
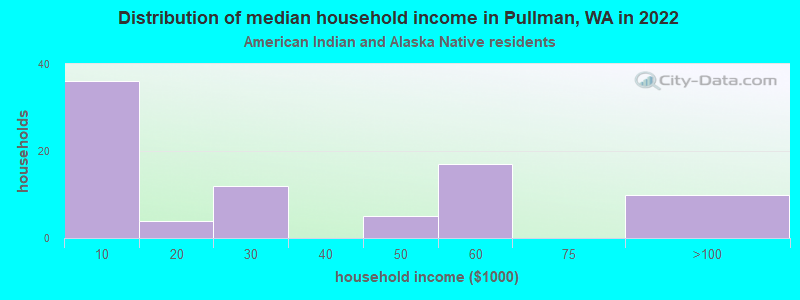
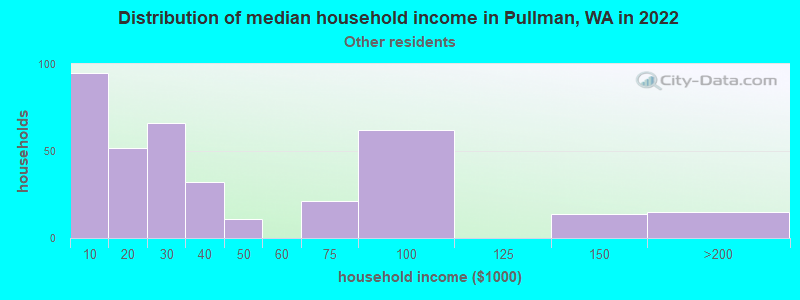
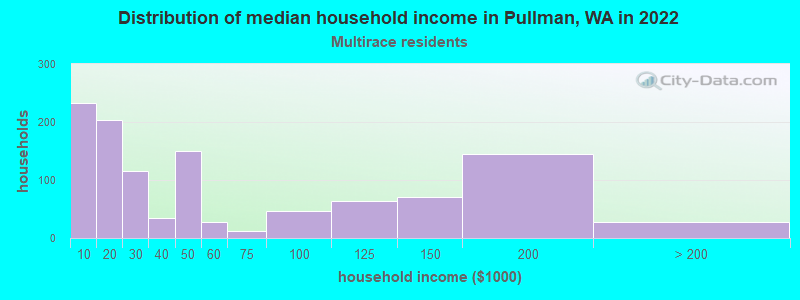
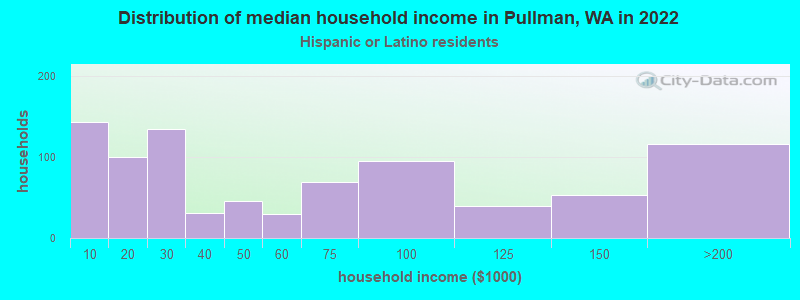
Income and house value in Pullman Median household income in 2022 $43,763 White non-Hispanic householders$24,869 Black householders$22,198 Asian householders$28,498 Some other race householders$44,770 Two or more races householders$51,902 Hispanic or Latino race householdersMedian 2022 house value $476,090 White Non-Hispanic householders$991,167 Black or African American householders $524,657 Asian householders$371,687 Some other race householders$475,099 Two or more races householders$516,398 Hispanic or Latino householders
Median age by race in Pullman
23.3 Median age for White residents23.4 23.1 23.4 Median age for Black or African American residents23.1 24.1 19.7 Median age for American Indian / Alaska Native residents20.6 18.1 25.0 Median age for Asian residents25.1 25.4 -681,388,011.9 Median age for Native Hawaiian / Pacific Islander residents-696,774,192.9 -666,666,666.0 26.8 Median age for Other race residents25.9 29.0 22.9 Median age for Two or more races residents22.6 23.2 23.1 Median age for White alone residents23.3 22.9 22.4 Median age for Hispanic or Latino residents22.3 22.6
Owner/renter occupied households by race in Pullman
House owners and renters - White residents 2,865 32.6% Owner occupied5,916 67.4% Renter occupiedHouse owners and renters - Black or African American residents 235 100.0% Renter occupiedHouse owners and renters - American Indian / Alaska Native residents 4 4.1% Owner occupied93 95.9% Renter occupiedHouse owners and renters - Asian residents 397 23.5% Owner occupied1,292 76.5% Renter occupiedHouse owners and renters - Other race residents 101 29.0% Owner occupied248 71.0% Renter occupiedHouse owners and renters - Two or more races residents 267 24.2% Owner occupied835 75.8% Renter occupiedHouse owners and renters - White alone residents 2,844 32.6% Owner occupied5,888 67.4% Renter occupiedHouse owners and renters - Hispanic or Latino residents 107 13.0% Owner occupied716 87.0% Renter occupied
Language usage in Pullman
English speakers - Total 82.4% of residents of Pullman speak English at home.
4.0% of residents speak Spanish at home 1,050 83.6% Speak English very well206 16.4% Speak English less than very well13.5% of residents speak other language at home 2,691 63.8% Speak English very well1,529 36.2% Speak English less than very well
English speakers - Born in the United States 93.3% of residents of Pullman speak English at home.
2.9% of residents speak Spanish at home 343 93.7% Speak English very well23 6.3% Speak English less than very well3.7% of residents speak other language at home 432 91.3% Speak English very well41 8.7% Speak English less than very well
English speakers - Native, born elsewhere 78.3% of residents of Pullman speak English at home.
3.2% of residents speak Spanish at home 23 100.0% Speak English very well17.9% of residents speak other language at home 128 100.0% Speak English very well
English speakers - Foreign-born 20.5% of residents of Pullman speak English at home.
9.9% of residents speak Spanish at home 340 81.1% Speak English very well79 18.9% Speak English less than very well70.0% of residents speak other language at home 1,672 56.3% Speak English very well1,296 43.7% Speak English less than very well
White (Caucasian) - Speak only English Native:
96.3% (20,211)Foreign-born:
26.1% (219)
White (Caucasian) - Speak another language Native:
3.7% (771)Foreign-born:
72.9% (612)
Black or African American - Speak only English Native:
87.9% (443)Foreign-born:
33.3% (102)
Black or African American - Speak another language Native:
11.4% (57)Foreign-born:
68.2% (209)
American Indian / Alaska Native - Speak another language Native:
15.9% (29)Foreign-born:
100.0% (8)
Asian - Speak only English Native:
52.6% (666)Foreign-born:
21.2% (544)
Asian - Speak another language Native:
47.6% (603)Foreign-born:
79.1% (2,025)
Other race - Speak another language Native:
25.5% (159)Foreign-born:
100.0% (168)
Two or more races - Speak only English Native:
87.2% (2,806)Foreign-born:
14.2% (46)
Two or more races - Speak another language Native:
11.0% (354)Foreign-born:
85.3% (274)
White alone - Speak only English Native:
96.8% (19,727)Foreign-born:
23.8% (216)
White alone - Speak another language Native:
3.2% (657)Foreign-born:
77.6% (706)
Hispanic or Latino - Speak only English Native:
70.2% (1,526)Foreign-born:
2.4% (10)
Hispanic or Latino - Speak another language Native:
31.1% (676)Foreign-born:
97.7% (395)
Foreign-born residents in Pullman 4,297 residents are foreign born (8.1% Asia , 1.9% Europe , 1.5% Latin America ).
This city:
13.3%Washington:
14.9%
Marital status for residents in Pullman Marital status - White (Caucasian) population 15 years and over
Males 64.6% Never married27.4% Now married2.8% Separated0.8% Widowed4.4% DivorcedFemales 61.0% Never married29.2% Now married0.3% Separated2.3% Widowed7.2% DivorcedWomen who gave birth in the past 12 months Now married:
93.8% (170)Unmarried:
6.2% (11)
Women who did not give birth in the past 12 months Now married:
22.6% (1,849)Unmarried:
77.4% (6,334)
Marital status - Black or African American population 15 years and over
Males 78.6% Never married14.2% Now married0.0% Separated0.0% Widowed7.2% DivorcedFemales 61.5% Never married22.1% Now married0.0% Separated16.4% Widowed0.0% DivorcedWomen who did not give birth in the past 12 months Now married:
22.1% (54)Unmarried:
77.9% (190)
Marital status - American Indian / Alaska Native population 15 years and over
Males 61.4% Never married38.6% Now married0.0% Separated0.0% Widowed0.0% DivorcedFemales 100.0% Never married0.0% Now married0.0% Separated0.0% Widowed0.0% DivorcedWomen who did not give birth in the past 12 months Now married:
0.0% (0)Unmarried:
100.0% (53)
Marital status - Asian population 15 years and over
Males 64.6% Never married32.1% Now married0.0% Separated0.7% Widowed2.6% DivorcedFemales 52.8% Never married37.7% Now married0.7% Separated1.3% Widowed7.6% DivorcedWomen who gave birth in the past 12 months Now married:
100.0% (26)Unmarried:
0.0% (0)
Women who did not give birth in the past 12 months Now married:
34.7% (502)Unmarried:
65.3% (944)
Marital status - Native Hawaiian / Pacific Islander population 15 years and over
Males 100.0% Never married0.0% Now married0.0% Separated0.0% Widowed0.0% DivorcedFemales 100.0% Never married0.0% Now married0.0% Separated0.0% Widowed0.0% DivorcedWomen who did not give birth in the past 12 months Now married:
0.0% (0)Unmarried:
100.0% (39)
Marital status - Other race population 15 years and over
Males 62.5% Never married28.0% Now married9.5% Separated0.0% Widowed0.0% DivorcedFemales 50.7% Never married31.2% Now married0.0% Separated0.0% Widowed18.1% DivorcedWomen who did not give birth in the past 12 months Now married:
41.0% (109)Unmarried:
59.0% (157)
Marital status - Two or more races population 15 years and over
Males 58.1% Never married33.5% Now married0.0% Separated0.0% Widowed8.4% DivorcedFemales 77.3% Never married18.8% Now married0.0% Separated0.0% Widowed3.9% DivorcedWomen who gave birth in the past 12 months Now married:
40.0% (18)Unmarried:
60.0% (26)
Women who did not give birth in the past 12 months Now married:
16.6% (227)Unmarried:
83.4% (1,139)
Marital status - White alone, not Hispanic / Latino population 15 years and over
Males 63.7% Never married28.4% Now married2.9% Separated0.8% Widowed4.3% DivorcedFemales 60.5% Never married29.7% Now married0.4% Separated2.4% Widowed7.0% DivorcedWomen who gave birth in the past 12 months Now married:
93.8% (176)Unmarried:
6.2% (12)
Women who did not give birth in the past 12 months Now married:
22.9% (1,822)Unmarried:
77.1% (6,141)
Marital status - Hispanic or Latino population 15 years and over
Males 71.6% Never married16.0% Now married3.5% Separated0.9% Widowed8.0% DivorcedFemales 72.7% Never married17.1% Now married0.0% Separated0.6% Widowed9.5% DivorcedWomen who gave birth in the past 12 months Now married:
0.0% (0)Unmarried:
100.0% (22)
Women who did not give birth in the past 12 months Now married:
16.9% (176)Unmarried:
83.1% (867)
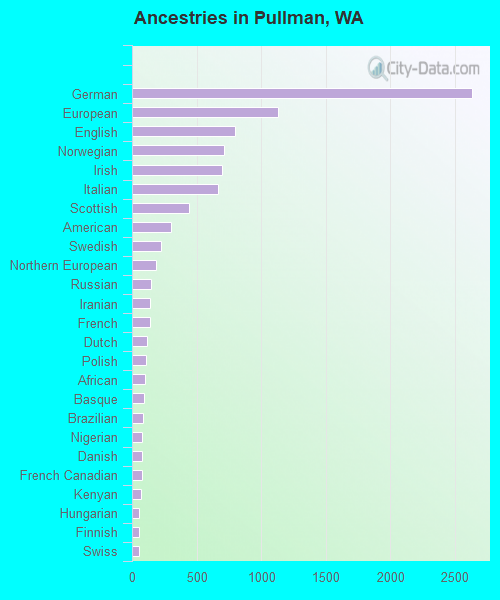
Ancestries in Pullman
2,635 16.1% German1,129 6.9% European801 4.9% English713 4.3% Norwegian699 4.3% Irish666 4.1% Italian442 2.7% Scottish304 1.9% American221 1.3% Swedish187 1.1% Northern European145 0.9% Russian138 0.8% Iranian137 0.8% French116 0.7% Dutch106 0.6% Polish103 0.6% African91 0.6% Basque84 0.5% Brazilian81 0.5% Nigerian78 0.5% Danish77 0.5% French Canadian69 0.4% Kenyan58 0.4% Hungarian56 0.3% Finnish55 0.3% Swiss55 0.3% Ukrainian43 0.3% British41 0.2% Canadian36 0.2% Palestinian35 0.2% Scotch-Irish29 0.2% Portuguese27 0.2% Yugoslavian24 0.1% Turkish23 0.1% Scandinavian21 0.1% Egyptian20 0.1% Eastern European19 0.1% Welsh18 0.1% Somali15 0.09% Greek11 0.07% Guyanese11 0.07% Ethiopian10 0.06% Haitian9 0.05% Serbian9 0.05% Slovene8 0.05% Czechoslovakian7 0.04% Czech7 0.04% Lithuanian7 0.04% West Indian6 0.04% Pennsylvania German
Geographical mobility in Pullman Same house 1 year ago 14,148 63.3% White (Caucasian)445 53.6% Black or African American142 64.8% American Indian / Alaska Native2,540 64.4% Asian38 100.0% Native Hawaiian / Pacific Islander627 76.3% Other race2,334 60.8% Two or more races13,931 63.7% White alone, not Hispanic / Latino1,554 57.8% Hispanic or LatinoMoved within same county 2,666 11.9% White / Caucasian227 27.4% Black or African American39 17.9% American Indian / Alaska Native630 16.0% Asian85 10.3% Other race519 13.5% Two or more races2,626 12.0% White alone, not Hispanic / Latino294 10.9% Hispanic or LatinoMoved within same state 3,411 15.3% White / Caucasian10 1.2% Black or African American11 5.0% American Indian / Alaska Native121 3.1% Asian1 3.5% Native Hawaiian / Pacific Islander87 10.6% Other race449 11.7% Two or more races3,254 14.9% White alone, not Hispanic / Latino462 17.2% Hispanic or LatinoMoved from different state 1,690 7.6% White / Caucasian58 7.0% Black or African American10 4.7% American Indian / Alaska Native290 7.4% Asian378 9.8% Two or more races1,632 7.5% White alone, not Hispanic / Latino303 11.3% Hispanic or LatinoMoved from abroad 191 0.9% White70 8.4% Black or African American428 10.9% Asian9 0.2% Two or more races208 1.0% White alone, not Hispanic / Latino
Children Nativity (place of birth) in Pullman
Children under 6 years - Living with two parents Both parents native 907 100.0% NativeBoth parents foreign-born 77 49.3% Native79 50.7% Foreign-bornOne native, one foreign-born parent 101 100.0% NativeChildren under 6 years - Living with one parent Native parent 211 100.0% NativeForeign-born parent 10 100.0% Foreign-bornChildren 6 to 17 years - Living with two parents Both parents native 1,504 99.1% Native14 0.9% Foreign-bornBoth parents foreign-born 6 3.3% Native180 96.7% Foreign-bornOne native, one foreign-born parent 74 100.0% NativeChildren 6 to 17 years - Living with one parent Native parent 213 95.0% Native11 5.0% Foreign-bornForeign-born parent 249 65.7% Native130 34.3% Foreign-born
Grandparents responsible for own grandchildren in Pullman
Grandparents (30 to 59 years) White / Caucasian 19 25.5% Responsible for grandchildren57 74.5% Not responsible for grandchildrenWhite alone, not Hispanic / Latino 19 23.4% Responsible for grandchildren63 76.6% Not responsible for grandchildren
Grandparents (60 years and over)