Races in Princeton, New Jersey (NJ) Detailed Stats
Data:
Races - White alone (%)
Races - White alone (% change since 2000)
Races - Black alone (%)
Races - Black alone (% change since 2000)
Races - American Indian alone (%)
Races - American Indian alone (% change since 2000)
Races - Asian alone (%)
Races - Asian alone (% change since 2000)
Races - Hispanic (%)
Races - Hispanic (% change since 2000)
Races - Native Hawaiian and Other Pacific Islander alone (%)
Races - Native Hawaiian and Other Pacific Islander alone (% change since 2000)
Races - Two or more races(%)
Races - Two or more races(% change since 2000)
Races - Other race alone (%)
Races - Other race alone (% change since 2000)
Racial diversity
Place of birth - Born in state of residence (%)
Place of birth - Born in state of residence (%) - White
Place of birth - Born in state of residence (%) - Black or African American
Place of birth - Born in state of residence (%) - Asian
Place of birth - Born in state of residence (%) - Hispanic or Latino
Place of birth - Born in state of residence (%) - American Indian and Alaska Native
Place of birth - Born in state of residence (%) - Multirace
Place of birth - Born in state of residence (%) - Other Race
Place of birth - Born in other state (%)
Place of birth - Born in other state (%) - White
Place of birth - Born in other state (%) - Black or African American
Place of birth - Born in other state (%) - Asian
Place of birth - Born in other state (%) - Hispanic or Latino
Place of birth - Born in other state (%) - American Indian and Alaska Native
Place of birth - Born in other state (%) - Multirace
Place of birth - Born in other state (%) - Other Race
Place of birth - Native, outside of US (%)
Place of birth - Native, outside of US (%) - White
Place of birth - Native, outside of US (%) - Black or African American
Place of birth - Native, outside of US (%) - Asian
Place of birth - Native, outside of US (%) - Hispanic or Latino
Place of birth - Native, outside of US (%) - American Indian and Alaska Native
Place of birth - Native, outside of US (%) - Multirace
Place of birth - Native, outside of US (%) - Other Race
Place of birth - Foreign born (%)
Place of birth - Foreign born (%) - White
Place of birth - Foreign born (%) - Black or African American
Place of birth - Foreign born (%) - Asian
Place of birth - Foreign born (%) - Hispanic or Latino
Place of birth - Foreign born (%) - American Indian and Alaska Native
Place of birth - Foreign born (%) - Multirace
Place of birth - Foreign born (%) - Other Race
Residents speaking English at home (%)
Residents speaking English at home - Born in the United States (%)
Residents speaking English at home - Native, born elsewhere (%)
Residents speaking English at home - Foreign born (%)
Residents speaking Spanish at home (%)
Residents speaking Spanish at home - Born in the United States (%)
Residents speaking Spanish at home - Native, born elsewhere (%)
Residents speaking Spanish at home - Foreign born (%)
Residents speaking other language at home (%)
Residents speaking other language at home - Born in the United States (%)
Residents speaking other language at home - Native, born elsewhere (%)
Residents speaking other language at home - Foreign born (%)
Marital status - Never married (%)
Marital status - Now married (%)
Marital status - Separated (%)
Marital status - Widowed (%)
Marital status - Divorced (%)
Ancestries Reported - Arab (%)
Ancestries Reported - Czech (%)
Ancestries Reported - Danish (%)
Ancestries Reported - Dutch (%)
Ancestries Reported - English (%)
Ancestries Reported - French (%)
Ancestries Reported - French Canadian (%)
Ancestries Reported - German (%)
Ancestries Reported - Greek (%)
Ancestries Reported - Hungarian (%)
Ancestries Reported - Irish (%)
Ancestries Reported - Italian (%)
Ancestries Reported - Lithuanian (%)
Ancestries Reported - Norwegian (%)
Ancestries Reported - Polish (%)
Ancestries Reported - Portuguese (%)
Ancestries Reported - Russian (%)
Ancestries Reported - Scotch-Irish (%)
Ancestries Reported - Scottish (%)
Ancestries Reported - Slovak (%)
Ancestries Reported - Subsaharan African (%)
Ancestries Reported - Swedish (%)
Ancestries Reported - Swiss (%)
Ancestries Reported - Ukrainian (%)
Ancestries Reported - United States (%)
Ancestries Reported - Welsh (%)
Ancestries Reported - West Indian (%)
Ancestries Reported - Other (%)
Geographical mobility - Same house 1 year ago (%)
Geographical mobility - Same house 1 year ago (%) - White
Geographical mobility - Same house 1 year ago (%) - Black or African American
Geographical mobility - Same house 1 year ago (%) - Asian
Geographical mobility - Same house 1 year ago (%) - Hispanic or Latino
Geographical mobility - Same house 1 year ago (%) - American Indian and Alaska Native
Geographical mobility - Same house 1 year ago (%) - Multirace
Geographical mobility - Same house 1 year ago (%) - Other Race
Geographical mobility - Moved within same county (%)
Geographical mobility - Moved within same county (%) - White
Geographical mobility - Moved within same county (%) - Black or African American
Geographical mobility - Moved within same county (%) - Asian
Geographical mobility - Moved within same county (%) - Hispanic or Latino
Geographical mobility - Moved within same county (%) - American Indian and Alaska Native
Geographical mobility - Moved within same county (%) - Multirace
Geographical mobility - Moved within same county (%) - Other Race
Geographical mobility - Moved from different county within same state (%)
Geographical mobility - Moved from different county within same state (%) - White
Geographical mobility - Moved from different county within same state (%) - Black or African American
Geographical mobility - Moved from different county within same state (%) - Asian
Geographical mobility - Moved from different county within same state (%) - Hispanic or Latino
Geographical mobility - Moved from different county within same state (%) - American Indian and Alaska Native
Geographical mobility - Moved from different county within same state (%) - Multirace
Geographical mobility - Moved from different county within same state (%) - Other Race
Geographical mobility - Moved from different state (%)
Geographical mobility - Moved from different state (%) - White
Geographical mobility - Moved from different state (%) - Black or African American
Geographical mobility - Moved from different state (%) - Asian
Geographical mobility - Moved from different state (%) - Hispanic or Latino
Geographical mobility - Moved from different state (%) - American Indian and Alaska Native
Geographical mobility - Moved from different state (%) - Multirace
Geographical mobility - Moved from different state (%) - Other Race
Geographical mobility - Moved from abroad (%)
Geographical mobility - Moved from abroad (%) - White
Geographical mobility - Moved from abroad (%) - Black or African American
Geographical mobility - Moved from abroad (%) - Asian
Geographical mobility - Moved from abroad (%) - Hispanic or Latino
Geographical mobility - Moved from abroad (%) - American Indian and Alaska Native
Geographical mobility - Moved from abroad (%) - Multirace
Geographical mobility - Moved from abroad (%) - Other Race
Place of birth for the foreign-born population - Ireland (%)
Place of birth for the foreign-born population - Denmark (%)
Place of birth for the foreign-born population - Norway (%)
Place of birth for the foreign-born population - Sweden (%)
Place of birth for the foreign-born population - United Kingdom (%)
Place of birth for the foreign-born population - England (%)
Place of birth for the foreign-born population - Scotland (%)
Place of birth for the foreign-born population - Other Northern Europe (%)
Place of birth for the foreign-born population - Austria (%)
Place of birth for the foreign-born population - Belgium (%)
Place of birth for the foreign-born population - France (%)
Place of birth for the foreign-born population - Germany (%)
Place of birth for the foreign-born population - Netherlands (%)
Place of birth for the foreign-born population - Switzerland (%)
Place of birth for the foreign-born population - Other Western Europe (%)
Place of birth for the foreign-born population - Greece (%)
Place of birth for the foreign-born population - Italy (%)
Place of birth for the foreign-born population - Portugal (%)
Place of birth for the foreign-born population - Spain (%)
Place of birth for the foreign-born population - Other Southern Europe (%)
Place of birth for the foreign-born population - Albania (%)
Place of birth for the foreign-born population - Belarus (%)
Place of birth for the foreign-born population - Bosnia and Herzegovina (%)
Place of birth for the foreign-born population - Bulgaria (%)
Place of birth for the foreign-born population - Croatia (%)
Place of birth for the foreign-born population - Czechoslovakia (%)
Place of birth for the foreign-born population - Hungary (%)
Place of birth for the foreign-born population - Latvia (%)
Place of birth for the foreign-born population - Lithuania (%)
Place of birth for the foreign-born population - North Macedonia (Macedonia) (%)
Place of birth for the foreign-born population - Moldova (%)
Place of birth for the foreign-born population - Poland (%)
Place of birth for the foreign-born population - Romania (%)
Place of birth for the foreign-born population - Russia (%)
Place of birth for the foreign-born population - Serbia (%)
Place of birth for the foreign-born population - Ukraine (%)
Place of birth for the foreign-born population - Other Eastern Europe (%)
Place of birth for the foreign-born population - China (%)
Place of birth for the foreign-born population - Hong Kong (%)
Place of birth for the foreign-born population - Taiwan (%)
Place of birth for the foreign-born population - Japan (%)
Place of birth for the foreign-born population - Korea (%)
Place of birth for the foreign-born population - Other Eastern Asia (%)
Place of birth for the foreign-born population - Afghanistan (%)
Place of birth for the foreign-born population - Bangladesh (%)
Place of birth for the foreign-born population - India (%)
Place of birth for the foreign-born population - Iran (%)
Place of birth for the foreign-born population - Kazakhstan (%)
Place of birth for the foreign-born population - Nepal (%)
Place of birth for the foreign-born population - Pakistan (%)
Place of birth for the foreign-born population - Sri Lanka (%)
Place of birth for the foreign-born population - Uzbekistan (%)
Place of birth for the foreign-born population - Other South Central Asia (%)
Place of birth for the foreign-born population - Burma (%)
Place of birth for the foreign-born population - Cambodia (%)
Place of birth for the foreign-born population - Indonesia (%)
Place of birth for the foreign-born population - Laos (%)
Place of birth for the foreign-born population - Malaysia (%)
Place of birth for the foreign-born population - Philippines (%)
Place of birth for the foreign-born population - Singapore (%)
Place of birth for the foreign-born population - Thailand (%)
Place of birth for the foreign-born population - Vietnam (%)
Place of birth for the foreign-born population - Other South Eastern Asia (%)
Place of birth for the foreign-born population - Armenia (%)
Place of birth for the foreign-born population - Iraq (%)
Place of birth for the foreign-born population - Israel (%)
Place of birth for the foreign-born population - Jordan (%)
Place of birth for the foreign-born population - Kuwait (%)
Place of birth for the foreign-born population - Lebanon (%)
Place of birth for the foreign-born population - Saudi Arabia (%)
Place of birth for the foreign-born population - Syria (%)
Place of birth for the foreign-born population - Turkey (%)
Place of birth for the foreign-born population - Yemen (%)
Place of birth for the foreign-born population - Other Western Asia (%)
Place of birth for the foreign-born population - Eritrea (%)
Place of birth for the foreign-born population - Ethiopia (%)
Place of birth for the foreign-born population - Kenya (%)
Place of birth for the foreign-born population - Somalia (%)
Place of birth for the foreign-born population - Uganda (%)
Place of birth for the foreign-born population - Zimbabwe (%)
Place of birth for the foreign-born population - Other Eastern Africa (%)
Place of birth for the foreign-born population - Cameroon (%)
Place of birth for the foreign-born population - Congo (%)
Place of birth for the foreign-born population - Democratic Republic of Congo (Zaire) (%)
Place of birth for the foreign-born population - Other Middle Africa (%)
Place of birth for the foreign-born population - Egypt (%)
Place of birth for the foreign-born population - Morocco (%)
Place of birth for the foreign-born population - Sudan (%)
Place of birth for the foreign-born population - Other Northern Africa (%)
Place of birth for the foreign-born population - South Africa (%)
Place of birth for the foreign-born population - Other Southern Africa (%)
Place of birth for the foreign-born population - Cabo Verde (%)
Place of birth for the foreign-born population - Ghana (%)
Place of birth for the foreign-born population - Liberia (%)
Place of birth for the foreign-born population - Nigeria (%)
Place of birth for the foreign-born population - Senegal (%)
Place of birth for the foreign-born population - Sierra Leone (%)
Place of birth for the foreign-born population - Other Western Africa (%)
Place of birth for the foreign-born population - Australia (%)
Place of birth for the foreign-born population - New Zealand (%)
Place of birth for the foreign-born population - Fiji (%)
Place of birth for the foreign-born population - Micronesia (%)
Place of birth for the foreign-born population - Bahamas (%)
Place of birth for the foreign-born population - Barbados (%)
Place of birth for the foreign-born population - Cuba (%)
Place of birth for the foreign-born population - Dominica (%)
Place of birth for the foreign-born population - Dominican Republic (%)
Place of birth for the foreign-born population - Grenada (%)
Place of birth for the foreign-born population - Haiti (%)
Place of birth for the foreign-born population - Jamaica (%)
Place of birth for the foreign-born population - St. Vincent and the Grenadines (%)
Place of birth for the foreign-born population - Trinidad and Tobago (%)
Place of birth for the foreign-born population - West Indies (%)
Place of birth for the foreign-born population - Other Caribbean (%)
Place of birth for the foreign-born population - Belize (%)
Place of birth for the foreign-born population - Costa Rica (%)
Place of birth for the foreign-born population - El Salvador (%)
Place of birth for the foreign-born population - Guatemala (%)
Place of birth for the foreign-born population - Honduras (%)
Place of birth for the foreign-born population - Mexico (%)
Place of birth for the foreign-born population - Nicaragua (%)
Place of birth for the foreign-born population - Panama (%)
Place of birth for the foreign-born population - Other Central America (%)
Place of birth for the foreign-born population - Argentina (%)
Place of birth for the foreign-born population - Bolivia (%)
Place of birth for the foreign-born population - Brazil (%)
Place of birth for the foreign-born population - Chile (%)
Place of birth for the foreign-born population - Colombia (%)
Place of birth for the foreign-born population - Ecuador (%)
Place of birth for the foreign-born population - Guyana (%)
Place of birth for the foreign-born population - Peru (%)
Place of birth for the foreign-born population - Uruguay (%)
Place of birth for the foreign-born population - Venezuela (%)
Place of birth for the foreign-born population - Other South America (%)
Place of birth for the foreign-born population - Canada (%)
Place of birth for the foreign-born population - Other Northern America (%)
Place of birth for the foreign-born population - Other (%)
Latest news about races in Princeton, NJ collected exclusively by city-data.com from local newspapers, TV, and radio stations
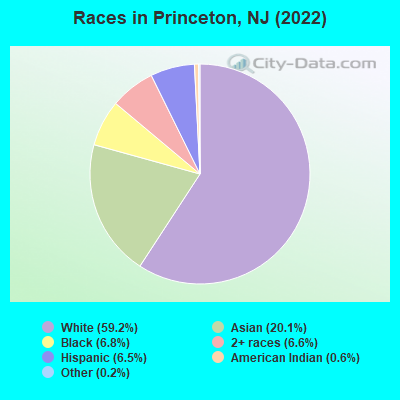
According to 2022 data, the most numerous races in Princeton, NJ are White alone (17,896 residents), Hispanic (1,976 residents), and Black alone (2,057 residents). 61.3% of Princeton residents speak English at home. 29.8% of Princeton, NJ residents are foreign-born (15.5% born in Asia, 8.0% born in Europe, 3.4% born in Latin America), which is 22.8% greater than the foreign-born rate of 23.0% across the entire state of New Jersey.
Race distribution in Princeton
2000 2022
5,557,209 66.0% White alone 1,117,191 13.3% Hispanic 1,096,171 13.0% Black alone 477,012 5.7% Asian alone 133,689 1.6% Two or more races 19,565 0.2% Other race alone 11,338 0.1% American Indian alone 2,175 0.03% Native Hawaiian and Other
4,766,476 51.5% White alone 2,028,470 21.9% Hispanic 1,111,632 12.0% Black alone 923,546 10.0% Asian alone 332,237 3.6% Two or more races 89,847 1.0% Other race alone 8,557 0.09% American Indian alone 934 0.01% Native Hawaiian and Other
Income and house value in Princeton Median household income in 2022 $178,351 White non-Hispanic householders$37,151 Black householdersover $200,000 Asian householdersover $200,000 Two or more races householdersover $200,000 Hispanic or Latino race householdersMedian 2022 house value over $1,000,000 White Non-Hispanic householders$432,823 Black or African American householders $895,308 Asian householders$681,015 Some other race householders$519,387 Two or more races householders$681,015 Hispanic or Latino householders
Median age by race in Princeton
35.2 Median age for White residents34.4 36.6 24.3 Median age for Black or African American residents21.6 35.6 40.9 Median age for American Indian / Alaska Native residents36.0 40.6 26.5 Median age for Asian residents26.8 25.6 -804,177,544.9 Median age for Native Hawaiian / Pacific Islander residents-860,335,194.7 -713,070,378.3 30.0 Median age for Other race residents28.9 38.2 24.0 Median age for Two or more races residents27.1 21.8 36.9 Median age for White alone residents35.9 40.2 21.9 Median age for Hispanic or Latino residents24.0 20.1
Owner/renter occupied households by race in Princeton
House owners and renters - White residents 4,079 66.0% Owner occupied2,105 34.0% Renter occupiedHouse owners and renters - Black or African American residents 103 20.6% Owner occupied397 79.4% Renter occupiedHouse owners and renters - American Indian / Alaska Native residents 16 22.7% Owner occupied53 77.3% Renter occupiedHouse owners and renters - Asian residents 868 54.1% Owner occupied735 45.9% Renter occupiedHouse owners and renters - Native Hawaiian / Pacific Islander residents 18 100.0% Renter occupiedHouse owners and renters - Other race residents 13 22.4% Owner occupied45 77.6% Renter occupiedHouse owners and renters - Two or more races residents 259 50.1% Owner occupied258 49.9% Renter occupiedHouse owners and renters - White alone residents 4,224 64.9% Owner occupied2,281 35.1% Renter occupiedHouse owners and renters - Hispanic or Latino residents 110 36.8% Owner occupied190 63.2% Renter occupied
Language usage in Princeton
English speakers - Total 61.3% of residents of Princeton speak English at home.
6.4% of residents speak Spanish at home 1,367 73.3% Speak English very well499 26.7% Speak English less than very well33.6% of residents speak other language at home 6,964 70.9% Speak English very well2,852 29.1% Speak English less than very well
English speakers - Born in the United States 85.9% of residents of Princeton speak English at home.
2.8% of residents speak Spanish at home 327 96.2% Speak English very well13 3.8% Speak English less than very well14.1% of residents speak other language at home 1,571 91.5% Speak English very well146 8.5% Speak English less than very well
English speakers - Native, born elsewhere 49.4% of residents of Princeton speak English at home.
20.6% of residents speak Spanish at home 138 78.4% Speak English very well38 21.6% Speak English less than very well55.9% of residents speak other language at home 458 96.0% Speak English very well19 4.0% Speak English less than very well
English speakers - Foreign-born 24.1% of residents of Princeton speak English at home.
5.6% of residents speak Spanish at home 268 51.0% Speak English very well257 49.0% Speak English less than very well69.4% of residents speak other language at home 3,997 61.0% Speak English very well2,557 39.0% Speak English less than very well
White (Caucasian) - Speak only English Native:
88.3% (12,383)Foreign-born:
43.5% (1,241)
White (Caucasian) - Speak another language Native:
11.4% (1,592)Foreign-born:
59.3% (1,694)
Black or African American - Speak only English Native:
87.0% (1,178)Foreign-born:
22.1% (155)
Black or African American - Speak another language Native:
16.5% (224)Foreign-born:
81.3% (571)
American Indian / Alaska Native - Speak another language Native:
20.0% (45)Foreign-born:
97.6% (195)
Asian - Speak only English Native:
39.4% (842)Foreign-born:
11.6% (440)
Asian - Speak another language Native:
60.8% (1,299)Foreign-born:
88.6% (3,371)
Other race - Speak only English Native:
56.0% (75)Foreign-born:
6.4% (18)
Other race - Speak another language Native:
55.7% (74)Foreign-born:
88.7% (249)
Two or more races - Speak only English Native:
56.2% (1,286)Foreign-born:
49.8% (169)
Two or more races - Speak another language Native:
41.3% (945)Foreign-born:
61.6% (209)
White alone - Speak only English Native:
87.5% (12,172)Foreign-born:
33.4% (1,287)
White alone - Speak another language Native:
14.2% (1,975)Foreign-born:
64.6% (2,488)
Hispanic or Latino - Speak only English Native:
44.3% (581)Foreign-born:
11.0% (52)
Hispanic or Latino - Speak another language Native:
56.2% (737)Foreign-born:
89.8% (426)
Foreign-born residents in Princeton 9,001 residents are foreign born (15.5% Asia , 8.0% Europe , 3.4% Latin America ).
This city:
29.8%New Jersey:
23.2%
Marital status for residents in Princeton Marital status - White (Caucasian) population 15 years and over
Males 46.2% Never married48.4% Now married0.3% Separated1.3% Widowed3.8% DivorcedFemales 41.0% Never married45.1% Now married1.1% Separated4.0% Widowed8.7% DivorcedWomen who gave birth in the past 12 months Now married:
100.0% (31)Unmarried:
0.0% (0)
Women who did not give birth in the past 12 months Now married:
34.0% (1,468)Unmarried:
66.0% (2,848)
Marital status - Black or African American population 15 years and over
Males 56.1% Never married37.2% Now married5.7% Separated0.0% Widowed1.0% DivorcedFemales 54.2% Never married33.4% Now married0.5% Separated6.7% Widowed5.2% DivorcedWomen who gave birth in the past 12 months Now married:
100.0% (10)Unmarried:
0.0% (0)
Women who did not give birth in the past 12 months Now married:
30.5% (214)Unmarried:
69.5% (487)
Marital status - American Indian / Alaska Native population 15 years and over
Males 59.6% Never married20.5% Now married19.9% Separated0.0% Widowed0.0% DivorcedFemales 47.8% Never married37.3% Now married0.0% Separated0.0% Widowed14.9% DivorcedWomen who did not give birth in the past 12 months Now married:
43.9% (39)Unmarried:
56.1% (49)
Marital status - Asian population 15 years and over
Males 50.0% Never married48.0% Now married0.0% Separated1.5% Widowed0.4% DivorcedFemales 51.3% Never married43.5% Now married0.3% Separated2.0% Widowed2.9% DivorcedWomen who gave birth in the past 12 months Now married:
76.1% (35)Unmarried:
23.9% (11)
Women who did not give birth in the past 12 months Now married:
31.9% (633)Unmarried:
68.1% (1,349)
Marital status - Other race population 15 years and over
Males 13.0% Never married78.3% Now married0.0% Separated0.0% Widowed8.7% DivorcedFemales 25.3% Never married36.3% Now married12.1% Separated5.5% Widowed20.9% DivorcedWomen who did not give birth in the past 12 months Now married:
46.9% (31)Unmarried:
53.1% (35)
Marital status - Two or more races population 15 years and over
Males 79.3% Never married20.7% Now married0.0% Separated0.0% Widowed0.0% DivorcedFemales 77.0% Never married20.5% Now married0.0% Separated0.6% Widowed2.0% DivorcedWomen who did not give birth in the past 12 months Now married:
9.7% (108)Unmarried:
90.3% (999)
Marital status - White alone, not Hispanic / Latino population 15 years and over
Males 44.0% Never married50.5% Now married0.3% Separated1.4% Widowed3.8% DivorcedFemales 39.6% Never married46.3% Now married1.0% Separated4.1% Widowed8.9% DivorcedWomen who gave birth in the past 12 months Now married:
100.0% (33)Unmarried:
0.0% (0)
Women who did not give birth in the past 12 months Now married:
35.5% (1,553)Unmarried:
64.5% (2,825)
Marital status - Hispanic or Latino population 15 years and over
Males 62.0% Never married31.8% Now married3.0% Separated0.0% Widowed3.3% DivorcedFemales 73.5% Never married16.7% Now married3.6% Separated1.4% Widowed4.8% DivorcedWomen who did not give birth in the past 12 months Now married:
11.0% (74)Unmarried:
89.0% (597)
Ancestries in Princeton
1,482 9.0% English848 5.2% Italian807 4.9% American786 4.8% French702 4.3% German588 3.6% Irish405 2.5% Russian356 2.2% Haitian305 1.9% European261 1.6% Polish247 1.5% Eastern European188 1.1% Israeli180 1.1% Hungarian175 1.1% Egyptian158 1.0% British125 0.8% Swedish94 0.6% Danish81 0.5% Greek80 0.5% Ethiopian77 0.5% Turkish72 0.4% Dutch68 0.4% Scottish60 0.4% Northern European56 0.3% Romanian49 0.3% Belgian47 0.3% Ukrainian44 0.3% African43 0.3% Nigerian41 0.2% Slavic41 0.2% Croatian39 0.2% Lithuanian37 0.2% Czech36 0.2% Yugoslavian34 0.2% Scotch-Irish33 0.2% Norwegian32 0.2% Moroccan31 0.2% Welsh29 0.2% Australian29 0.2% Trinidadian and Tobagonian25 0.2% Portuguese24 0.1% Brazilian23 0.1% Palestinian23 0.1% Iranian22 0.1% Serbian21 0.1% Bulgarian16 0.10% French Canadian16 0.10% Swiss15 0.09% Slovak15 0.09% Austrian14 0.09% Albanian13 0.08% Scandinavian12 0.07% Kenyan11 0.07% Canadian10 0.06% Guyanese8 0.05% Ugandan7 0.04% Liberian6 0.04% Finnish5 0.03% Pennsylvania German5 0.03% Syrian4 0.02% Jamaican
Geographical mobility in Princeton Same house 1 year ago 13,161 76.2% White (Caucasian)1,741 81.1% Black or African American346 78.8% American Indian / Alaska Native4,360 71.2% Asian16 100.0% Native Hawaiian / Pacific Islander167 38.4% Other race2,218 73.2% Two or more races13,707 76.8% White alone, not Hispanic / Latino1,162 59.1% Hispanic or LatinoMoved within same county 858 5.0% White / Caucasian88 4.1% Black or African American190 3.1% Asian38 8.9% Other race95 3.1% Two or more races967 5.4% White alone, not Hispanic / Latino93 4.7% Hispanic or LatinoMoved within same state 1,075 6.2% White / Caucasian74 3.5% Black or African American52 11.8% American Indian / Alaska Native330 5.4% Asian92 3.0% Two or more races1,068 6.0% White alone, not Hispanic / Latino220 11.2% Hispanic or LatinoMoved from different state 1,557 9.0% White / Caucasian292 13.6% Black or African American16 3.5% American Indian / Alaska Native649 10.6% Asian122 28.0% Other race265 8.8% Two or more races1,468 8.2% White alone, not Hispanic / Latino402 20.5% Hispanic or LatinoMoved from abroad 313 1.8% White79 3.7% Black or African American21 4.7% American Indian / Alaska Native788 12.9% Asian49 11.3% Other race71 2.4% Two or more races323 1.8% White alone, not Hispanic / Latino68 3.4% Hispanic or Latino
Children Nativity (place of birth) in Princeton
Children under 6 years - Living with two parents Both parents native 280 100.0% NativeBoth parents foreign-born 316 64.6% Native173 35.4% Foreign-bornOne native, one foreign-born parent 185 100.0% NativeChildren under 6 years - Living with one parent Native parent 70 100.0% NativeChildren 6 to 17 years - Living with two parents Both parents native 1,429 94.3% Native87 5.7% Foreign-bornBoth parents foreign-born 860 68.0% Native405 32.0% Foreign-bornOne native, one foreign-born parent 585 73.0% Native216 27.0% Foreign-bornChildren 6 to 17 years - Living with one parent Native parent 524 100.0% NativeForeign-born parent 230 51.2% Native220 48.8% Foreign-born
Place of birth for residents in Princeton
Grandparents responsible for own grandchildren in Princeton
Grandparents (30 to 59 years) Other race 7 100.0% Not responsible for grandchildrenHispanic or Latino 5 100.0% Not responsible for grandchildren
Grandparents (60 years and over) Hispanic or Latino 42 100.0% Not responsible for grandchildren