Races in Portsmouth, Rhode Island (RI) Detailed Stats
Ancestries, Foreign-born residents, place of birth

Recent posts about races in Portsmouth, Rhode Island on our local forum with over 2,400,000 registered users:
 | Buying a house in RI vs CT? (177 replies) |
| House buyers flooding in from MA & NYC (90 replies) |
| "Woonsocket Man" (Rocket Man parody) (514 replies) |
| The HGTV Dream Home is in Portsmouth (37 replies) |
| Would you buy this house on Patience Island? (18 replies) |
| How Good (or Bad) Is It Living In RI? (257 replies) |
Latest news about races in Portsmouth, RI collected exclusively by city-data.com from local newspapers, TV, and radio stations
4.0% of Portsmouth, RI residents are foreign-born (2.1% born in Europe, 1.0% born in Asia, 0.5% born in North America), which is 251.5% less than the foreign-born rate of 14.0% across the entire state of Rhode Island.
Race distribution in Portsmouth

- 16,26994.9%White alone
- 2491.5%Hispanic
- 2301.3%Asian alone
- 1941.1%Black alone
- 1570.9%Two or more races
- 200.1%Other race alone
- 240.1%American Indian alone
- 60.03%Native Hawaiian and Other
Pacific Islander alone

2000
2022
-
- 858,43381.9%White alone
- 90,8208.7%Hispanic
- 41,9224.0%Black alone
- 23,4162.2%Asian alone
- 20,8162.0%Two or more races
- 8,4110.8%Other race alone
- 4,1810.4%American Indian alone
- 3200.03%Native Hawaiian and Other
Pacific Islander alone

-
- 745,82568.2%White alone
- 191,97917.6%Hispanic
- 56,7385.2%Two or more races
- 51,3264.7%Black alone
- 37,2343.4%Asian alone
- 9,5140.9%Other race alone
- 9780.09%American Indian alone
- 1400.01%Native Hawaiian and Other
Pacific Islander alone

Income and house value in Portsmouth
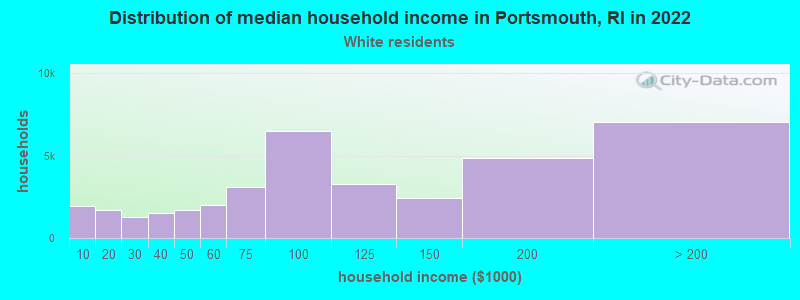
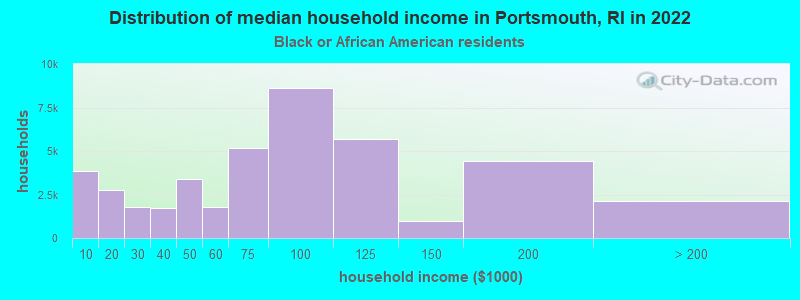
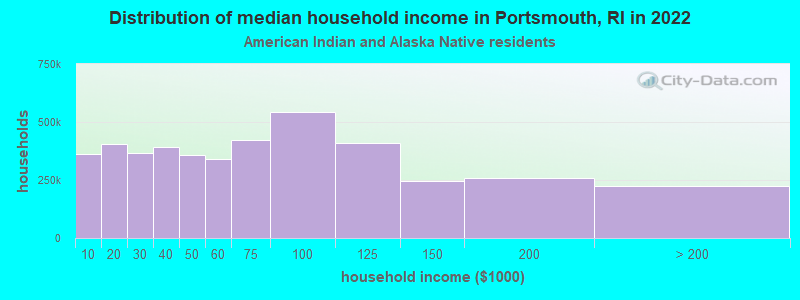
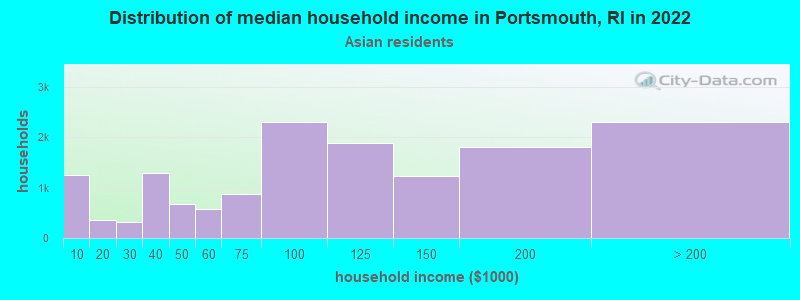
- Median household income in 2022
- $108,128White non-Hispanic householders
- $172,379Black householders
- $113,826Asian householders
- $16,185Some other race householders
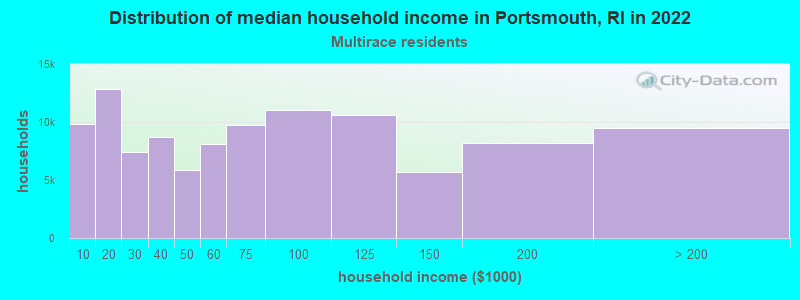
- over $200,000Two or more races householders
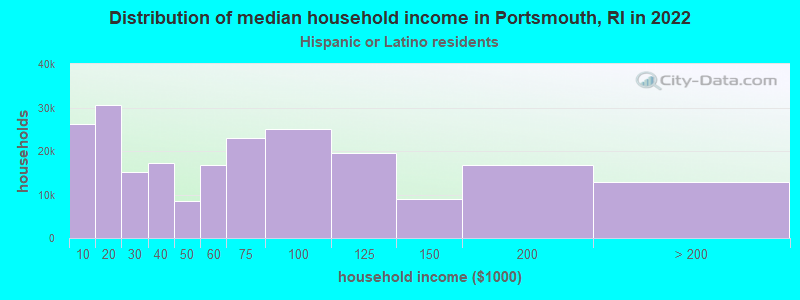
- over $200,000Hispanic or Latino race householders
- Median 2022 house value
- $634,905White Non-Hispanic householders
- $608,040Black or African American householders
- $709,443American Indian or Alaska Native householders
- $603,121Asian householders
- $952,735Two or more races householders
- $425,666Hispanic or Latino householders
Household income for White non-Hispanic householders
Household income for Black householders
Household income for American Indian and Alaska Native householders
Household income for Asian householders
Household income for Two or more races householders
Household income for Hispanic or Latino race householders
Foreign-born residents in Portsmouth
683 residents are foreign born (2.1% Europe, 1.0% Asia, 0.5% North America).
| This city: | 4.0% |
| Rhode Island: | 11.4% |
Ancestries in Portsmouth

- 4,27719.8%Irish
- 3,17314.7%English
- 2,45211.3%Portuguese
- 2,1199.8%German
- 1,9358.9%Other
- 1,8668.6%Italian
- 1,5147.0%French
- 9144.2%Polish
- 6983.2%French Canadian
- 4632.1%United States
- 4422.0%Scottish
- 3061.4%Scotch-Irish
- 2401.1%Swedish
- 2141.0%Dutch
- 1540.7%Norwegian
- 1470.7%Russian
- 1310.6%Arab
- 1140.5%Greek
- 1030.5%Slovak
- 770.4%Danish
- 650.3%Lithuanian
- 590.3%Swiss
- 480.2%Welsh
- 430.2%Hungarian
- 280.1%Czech
- 270.1%Subsaharan African
- 250.1%Ukrainian
- 160.07%West Indian

Zip codes: 02871.