Races in Poplar Bluff, Missouri (MO) Detailed Stats
Data:
Races - White alone (%)
Races - White alone (% change since 2000)
Races - Black alone (%)
Races - Black alone (% change since 2000)
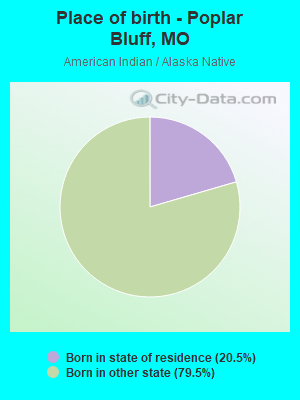
Races - American Indian alone (%)
Races - American Indian alone (% change since 2000)
Races - Asian alone (%)
Races - Asian alone (% change since 2000)
Races - Hispanic (%)
Races - Hispanic (% change since 2000)
Races - Native Hawaiian and Other Pacific Islander alone (%)
Races - Native Hawaiian and Other Pacific Islander alone (% change since 2000)
Races - Two or more races(%)
Races - Two or more races(% change since 2000)
Races - Other race alone (%)
Races - Other race alone (% change since 2000)
Racial diversity
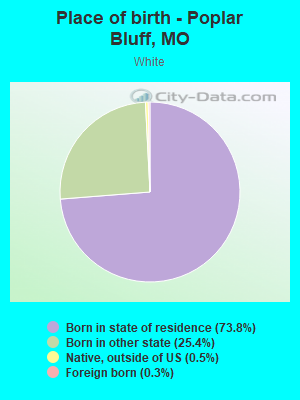
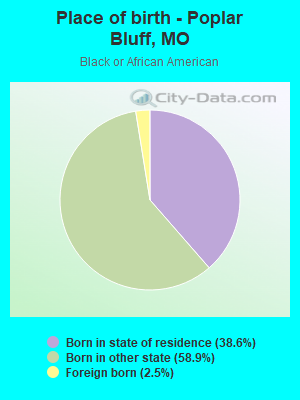
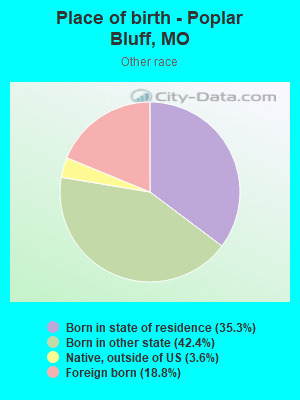
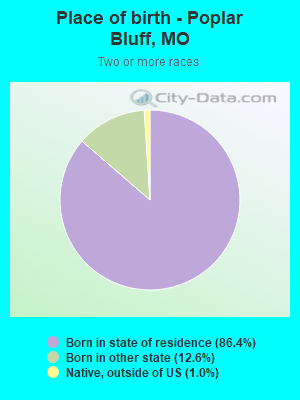
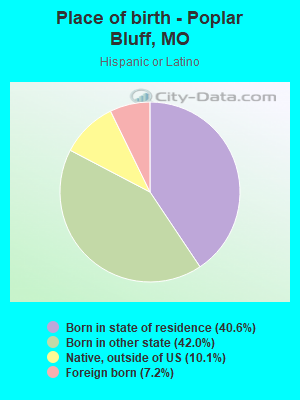
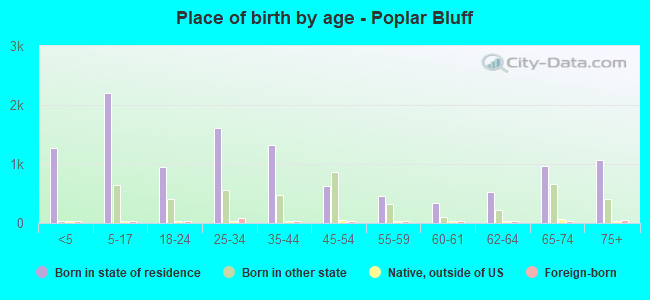
Place of birth - Born in state of residence (%)
Place of birth - Born in state of residence (%) - White
Place of birth - Born in state of residence (%) - Black or African American
Place of birth - Born in state of residence (%) - Asian
Place of birth - Born in state of residence (%) - Hispanic or Latino
Place of birth - Born in state of residence (%) - American Indian and Alaska Native
Place of birth - Born in state of residence (%) - Multirace
Place of birth - Born in state of residence (%) - Other Race
Place of birth - Born in other state (%)
Place of birth - Born in other state (%) - White
Place of birth - Born in other state (%) - Black or African American
Place of birth - Born in other state (%) - Asian
Place of birth - Born in other state (%) - Hispanic or Latino
Place of birth - Born in other state (%) - American Indian and Alaska Native
Place of birth - Born in other state (%) - Multirace
Place of birth - Born in other state (%) - Other Race
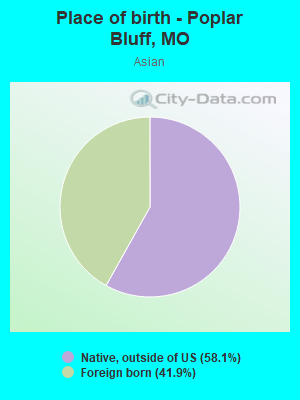
Place of birth - Native, outside of US (%)
Place of birth - Native, outside of US (%) - White
Place of birth - Native, outside of US (%) - Black or African American
Place of birth - Native, outside of US (%) - Asian
Place of birth - Native, outside of US (%) - Hispanic or Latino
Place of birth - Native, outside of US (%) - American Indian and Alaska Native
Place of birth - Native, outside of US (%) - Multirace
Place of birth - Native, outside of US (%) - Other Race
Place of birth - Foreign born (%)
Place of birth - Foreign born (%) - White
Place of birth - Foreign born (%) - Black or African American
Place of birth - Foreign born (%) - Asian
Place of birth - Foreign born (%) - Hispanic or Latino
Place of birth - Foreign born (%) - American Indian and Alaska Native
Place of birth - Foreign born (%) - Multirace
Place of birth - Foreign born (%) - Other Race
Residents speaking English at home (%)
Residents speaking English at home - Born in the United States (%)
Residents speaking English at home - Native, born elsewhere (%)
Residents speaking English at home - Foreign born (%)
Residents speaking Spanish at home (%)
Residents speaking Spanish at home - Born in the United States (%)
Residents speaking Spanish at home - Native, born elsewhere (%)
Residents speaking Spanish at home - Foreign born (%)
Residents speaking other language at home (%)
Residents speaking other language at home - Born in the United States (%)
Residents speaking other language at home - Native, born elsewhere (%)
Residents speaking other language at home - Foreign born (%)
Marital status - Never married (%)
Marital status - Now married (%)
Marital status - Separated (%)
Marital status - Widowed (%)
Marital status - Divorced (%)
Ancestries Reported - Arab (%)
Ancestries Reported - Czech (%)
Ancestries Reported - Danish (%)
Ancestries Reported - Dutch (%)
Ancestries Reported - English (%)
Ancestries Reported - French (%)
Ancestries Reported - French Canadian (%)
Ancestries Reported - German (%)
Ancestries Reported - Greek (%)
Ancestries Reported - Hungarian (%)
Ancestries Reported - Irish (%)
Ancestries Reported - Italian (%)
Ancestries Reported - Lithuanian (%)
Ancestries Reported - Norwegian (%)
Ancestries Reported - Polish (%)
Ancestries Reported - Portuguese (%)
Ancestries Reported - Russian (%)
Ancestries Reported - Scotch-Irish (%)
Ancestries Reported - Scottish (%)
Ancestries Reported - Slovak (%)
Ancestries Reported - Subsaharan African (%)
Ancestries Reported - Swedish (%)
Ancestries Reported - Swiss (%)
Ancestries Reported - Ukrainian (%)
Ancestries Reported - United States (%)
Ancestries Reported - Welsh (%)
Ancestries Reported - West Indian (%)
Ancestries Reported - Other (%)
Geographical mobility - Same house 1 year ago (%)
Geographical mobility - Same house 1 year ago (%) - White
Geographical mobility - Same house 1 year ago (%) - Black or African American
Geographical mobility - Same house 1 year ago (%) - Asian
Geographical mobility - Same house 1 year ago (%) - Hispanic or Latino
Geographical mobility - Same house 1 year ago (%) - American Indian and Alaska Native
Geographical mobility - Same house 1 year ago (%) - Multirace
Geographical mobility - Same house 1 year ago (%) - Other Race
Geographical mobility - Moved within same county (%)
Geographical mobility - Moved within same county (%) - White
Geographical mobility - Moved within same county (%) - Black or African American
Geographical mobility - Moved within same county (%) - Asian
Geographical mobility - Moved within same county (%) - Hispanic or Latino
Geographical mobility - Moved within same county (%) - American Indian and Alaska Native
Geographical mobility - Moved within same county (%) - Multirace
Geographical mobility - Moved within same county (%) - Other Race
Geographical mobility - Moved from different county within same state (%)
Geographical mobility - Moved from different county within same state (%) - White
Geographical mobility - Moved from different county within same state (%) - Black or African American
Geographical mobility - Moved from different county within same state (%) - Asian
Geographical mobility - Moved from different county within same state (%) - Hispanic or Latino
Geographical mobility - Moved from different county within same state (%) - American Indian and Alaska Native
Geographical mobility - Moved from different county within same state (%) - Multirace
Geographical mobility - Moved from different county within same state (%) - Other Race
Geographical mobility - Moved from different state (%)
Geographical mobility - Moved from different state (%) - White
Geographical mobility - Moved from different state (%) - Black or African American
Geographical mobility - Moved from different state (%) - Asian
Geographical mobility - Moved from different state (%) - Hispanic or Latino
Geographical mobility - Moved from different state (%) - American Indian and Alaska Native
Geographical mobility - Moved from different state (%) - Multirace
Geographical mobility - Moved from different state (%) - Other Race
Geographical mobility - Moved from abroad (%)
Geographical mobility - Moved from abroad (%) - White
Geographical mobility - Moved from abroad (%) - Black or African American
Geographical mobility - Moved from abroad (%) - Asian
Geographical mobility - Moved from abroad (%) - Hispanic or Latino
Geographical mobility - Moved from abroad (%) - American Indian and Alaska Native
Geographical mobility - Moved from abroad (%) - Multirace
Geographical mobility - Moved from abroad (%) - Other Race
Place of birth for the foreign-born population - Ireland (%)
Place of birth for the foreign-born population - Denmark (%)
Place of birth for the foreign-born population - Norway (%)
Place of birth for the foreign-born population - Sweden (%)
Place of birth for the foreign-born population - United Kingdom (%)
Place of birth for the foreign-born population - England (%)
Place of birth for the foreign-born population - Scotland (%)
Place of birth for the foreign-born population - Other Northern Europe (%)
Place of birth for the foreign-born population - Austria (%)
Place of birth for the foreign-born population - Belgium (%)
Place of birth for the foreign-born population - France (%)
Place of birth for the foreign-born population - Germany (%)
Place of birth for the foreign-born population - Netherlands (%)
Place of birth for the foreign-born population - Switzerland (%)
Place of birth for the foreign-born population - Other Western Europe (%)
Place of birth for the foreign-born population - Greece (%)
Place of birth for the foreign-born population - Italy (%)
Place of birth for the foreign-born population - Portugal (%)
Place of birth for the foreign-born population - Spain (%)
Place of birth for the foreign-born population - Other Southern Europe (%)
Place of birth for the foreign-born population - Albania (%)
Place of birth for the foreign-born population - Belarus (%)
Place of birth for the foreign-born population - Bosnia and Herzegovina (%)
Place of birth for the foreign-born population - Bulgaria (%)
Place of birth for the foreign-born population - Croatia (%)
Place of birth for the foreign-born population - Czechoslovakia (%)
Place of birth for the foreign-born population - Hungary (%)
Place of birth for the foreign-born population - Latvia (%)
Place of birth for the foreign-born population - Lithuania (%)
Place of birth for the foreign-born population - North Macedonia (Macedonia) (%)
Place of birth for the foreign-born population - Moldova (%)
Place of birth for the foreign-born population - Poland (%)
Place of birth for the foreign-born population - Romania (%)
Place of birth for the foreign-born population - Russia (%)
Place of birth for the foreign-born population - Serbia (%)
Place of birth for the foreign-born population - Ukraine (%)
Place of birth for the foreign-born population - Other Eastern Europe (%)
Place of birth for the foreign-born population - China (%)
Place of birth for the foreign-born population - Hong Kong (%)
Place of birth for the foreign-born population - Taiwan (%)
Place of birth for the foreign-born population - Japan (%)
Place of birth for the foreign-born population - Korea (%)
Place of birth for the foreign-born population - Other Eastern Asia (%)
Place of birth for the foreign-born population - Afghanistan (%)
Place of birth for the foreign-born population - Bangladesh (%)
Place of birth for the foreign-born population - India (%)
Place of birth for the foreign-born population - Iran (%)
Place of birth for the foreign-born population - Kazakhstan (%)
Place of birth for the foreign-born population - Nepal (%)
Place of birth for the foreign-born population - Pakistan (%)
Place of birth for the foreign-born population - Sri Lanka (%)
Place of birth for the foreign-born population - Uzbekistan (%)
Place of birth for the foreign-born population - Other South Central Asia (%)
Place of birth for the foreign-born population - Burma (%)
Place of birth for the foreign-born population - Cambodia (%)
Place of birth for the foreign-born population - Indonesia (%)
Place of birth for the foreign-born population - Laos (%)
Place of birth for the foreign-born population - Malaysia (%)
Place of birth for the foreign-born population - Philippines (%)
Place of birth for the foreign-born population - Singapore (%)
Place of birth for the foreign-born population - Thailand (%)
Place of birth for the foreign-born population - Vietnam (%)
Place of birth for the foreign-born population - Other South Eastern Asia (%)
Place of birth for the foreign-born population - Armenia (%)
Place of birth for the foreign-born population - Iraq (%)
Place of birth for the foreign-born population - Israel (%)
Place of birth for the foreign-born population - Jordan (%)
Place of birth for the foreign-born population - Kuwait (%)
Place of birth for the foreign-born population - Lebanon (%)
Place of birth for the foreign-born population - Saudi Arabia (%)
Place of birth for the foreign-born population - Syria (%)
Place of birth for the foreign-born population - Turkey (%)
Place of birth for the foreign-born population - Yemen (%)
Place of birth for the foreign-born population - Other Western Asia (%)
Place of birth for the foreign-born population - Eritrea (%)
Place of birth for the foreign-born population - Ethiopia (%)
Place of birth for the foreign-born population - Kenya (%)
Place of birth for the foreign-born population - Somalia (%)
Place of birth for the foreign-born population - Uganda (%)
Place of birth for the foreign-born population - Zimbabwe (%)
Place of birth for the foreign-born population - Other Eastern Africa (%)
Place of birth for the foreign-born population - Cameroon (%)
Place of birth for the foreign-born population - Congo (%)
Place of birth for the foreign-born population - Democratic Republic of Congo (Zaire) (%)
Place of birth for the foreign-born population - Other Middle Africa (%)
Place of birth for the foreign-born population - Egypt (%)
Place of birth for the foreign-born population - Morocco (%)
Place of birth for the foreign-born population - Sudan (%)
Place of birth for the foreign-born population - Other Northern Africa (%)
Place of birth for the foreign-born population - South Africa (%)
Place of birth for the foreign-born population - Other Southern Africa (%)
Place of birth for the foreign-born population - Cabo Verde (%)
Place of birth for the foreign-born population - Ghana (%)
Place of birth for the foreign-born population - Liberia (%)
Place of birth for the foreign-born population - Nigeria (%)
Place of birth for the foreign-born population - Senegal (%)
Place of birth for the foreign-born population - Sierra Leone (%)
Place of birth for the foreign-born population - Other Western Africa (%)
Place of birth for the foreign-born population - Australia (%)
Place of birth for the foreign-born population - New Zealand (%)
Place of birth for the foreign-born population - Fiji (%)
Place of birth for the foreign-born population - Micronesia (%)
Place of birth for the foreign-born population - Bahamas (%)
Place of birth for the foreign-born population - Barbados (%)
Place of birth for the foreign-born population - Cuba (%)
Place of birth for the foreign-born population - Dominica (%)
Place of birth for the foreign-born population - Dominican Republic (%)
Place of birth for the foreign-born population - Grenada (%)
Place of birth for the foreign-born population - Haiti (%)
Place of birth for the foreign-born population - Jamaica (%)
Place of birth for the foreign-born population - St. Vincent and the Grenadines (%)
Place of birth for the foreign-born population - Trinidad and Tobago (%)
Place of birth for the foreign-born population - West Indies (%)
Place of birth for the foreign-born population - Other Caribbean (%)
Place of birth for the foreign-born population - Belize (%)
Place of birth for the foreign-born population - Costa Rica (%)
Place of birth for the foreign-born population - El Salvador (%)
Place of birth for the foreign-born population - Guatemala (%)
Place of birth for the foreign-born population - Honduras (%)
Place of birth for the foreign-born population - Mexico (%)
Place of birth for the foreign-born population - Nicaragua (%)
Place of birth for the foreign-born population - Panama (%)
Place of birth for the foreign-born population - Other Central America (%)
Place of birth for the foreign-born population - Argentina (%)
Place of birth for the foreign-born population - Bolivia (%)
Place of birth for the foreign-born population - Brazil (%)
Place of birth for the foreign-born population - Chile (%)
Place of birth for the foreign-born population - Colombia (%)
Place of birth for the foreign-born population - Ecuador (%)
Place of birth for the foreign-born population - Guyana (%)
Place of birth for the foreign-born population - Peru (%)
Place of birth for the foreign-born population - Uruguay (%)
Place of birth for the foreign-born population - Venezuela (%)
Place of birth for the foreign-born population - Other South America (%)
Place of birth for the foreign-born population - Canada (%)
Place of birth for the foreign-born population - Other Northern America (%)
Place of birth for the foreign-born population - Other (%)
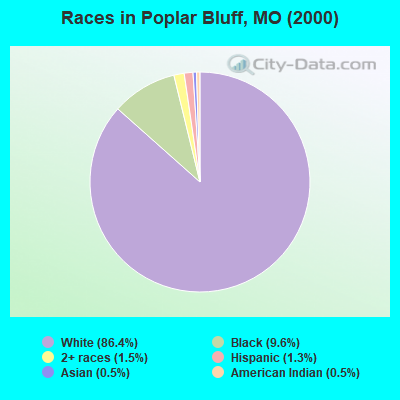
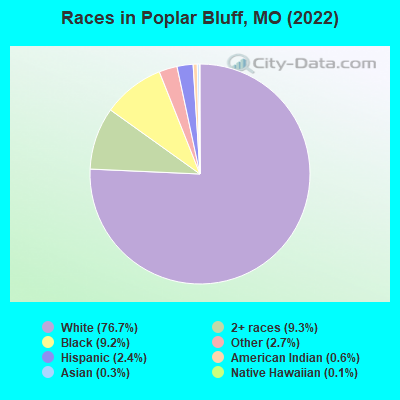
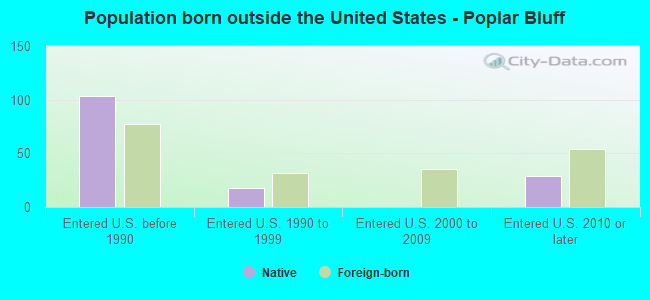
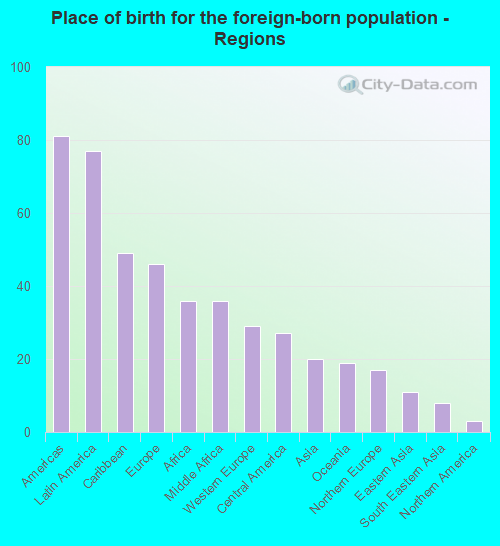
According to 2022 data, the most numerous races in Poplar Bluff, MO are White alone (12,557 residents), Black alone (1,509 residents), and Two or more races (1,529 residents). 97.6% of Poplar Bluff residents speak English at home. 1.2% of Poplar Bluff, MO residents are foreign-born , which is 221.1% less than the foreign-born rate of 4.0% across the entire state of Missouri.
Race distribution in Poplar Bluff
2000 2022
4,686,474 83.8% White alone 625,667 11.2% Black alone 118,592 2.1% Hispanic 71,905 1.3% Two or more races 61,041 1.1% Asian alone 23,302 0.4% American Indian alone 5,291 0.09% Other race alone 2,939 0.05% Native Hawaiian and Other
4,733,411 76.6% White alone 656,739 10.6% Black alone 316,300 5.1% Two or more races 291,763 4.7% Hispanic 132,436 2.1% Asian alone 27,467 0.4% Other race alone 12,313 0.2% American Indian alone 7,528 0.1% Native Hawaiian and Other
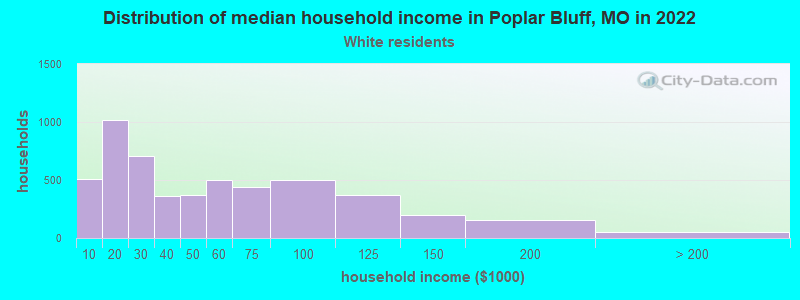
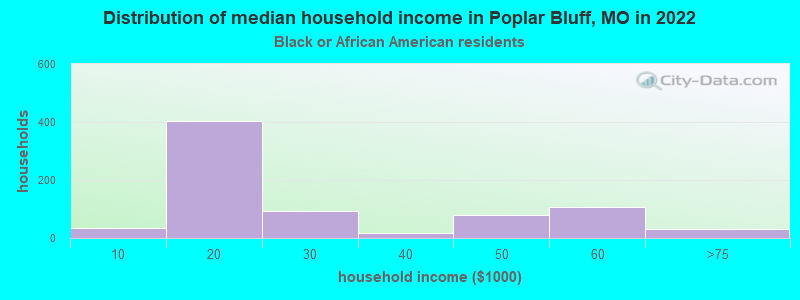
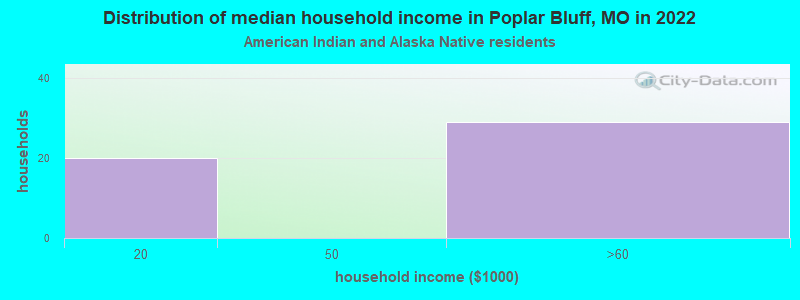
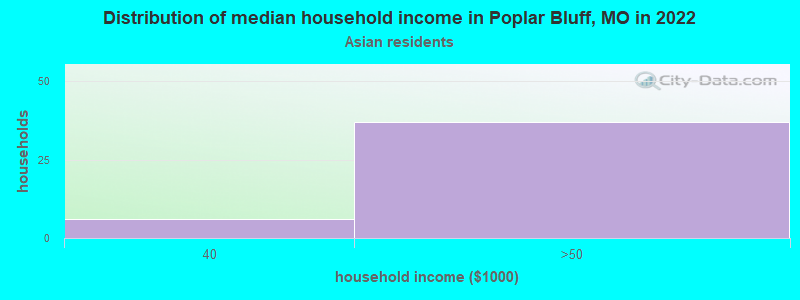
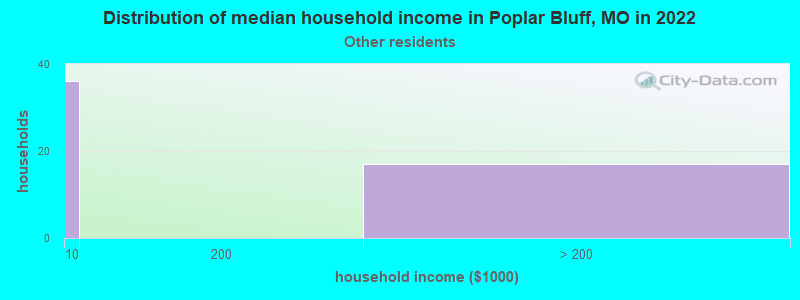
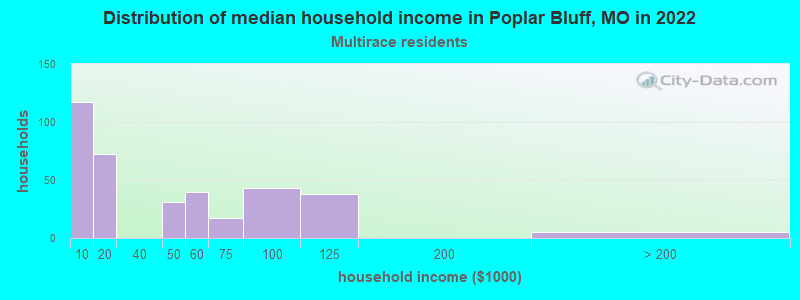
Income and house value in Poplar Bluff Median household income in 2022 $39,582 White non-Hispanic householdersMedian 2022 house value $114,837 White Non-Hispanic householders$98,464 Black or African American householders$22,737 American Indian or Alaska Native householders $292,892 Asian householders$125,070 Some other race householders$350,652 Two or more races householders
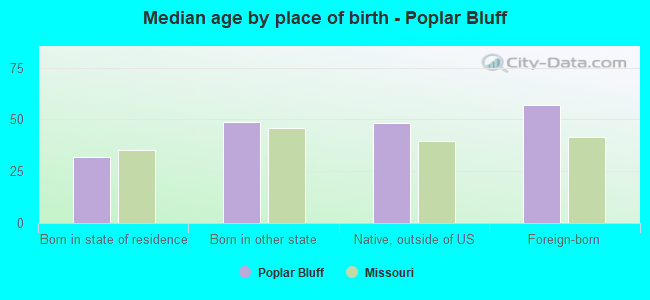
Median age by race in Poplar Bluff
37.6 Median age for White residents34.7 41.2 48.2 Median age for Black or African American residents34.0 52.7 59.6 Median age for American Indian / Alaska Native residents-652,291,104.5 56.6 52.3 Median age for Asian residents-676,616,914.7 -666,666,666.0 -693,430,656.2 Median age for Native Hawaiian / Pacific Islander residents-683,513,838.1 -752,136,751.4 43.6 Median age for Other race residents47.7 18.0 13.5 Median age for Two or more races residents12.8 14.8 37.7 Median age for White alone residents35.6 41.2 18.1 Median age for Hispanic or Latino residents28.4 16.5
Owner/renter occupied households by race in Poplar Bluff
House owners and renters - White residents 2,739 53.2% Owner occupied2,408 46.8% Renter occupiedHouse owners and renters - Black or African American residents 189 24.9% Owner occupied570 75.1% Renter occupiedHouse owners and renters - American Indian / Alaska Native residents 37 67.9% Owner occupied17 32.1% Renter occupiedHouse owners and renters - Asian residents 10 27.5% Owner occupied26 72.5% Renter occupiedHouse owners and renters - Native Hawaiian / Pacific Islander residents 12 100.0% Renter occupiedHouse owners and renters - Other race residents 43 100.0% Renter occupiedHouse owners and renters - Two or more races residents 136 40.1% Owner occupied203 59.9% Renter occupiedHouse owners and renters - White alone residents 2,731 52.8% Owner occupied2,439 47.2% Renter occupiedHouse owners and renters - Hispanic or Latino residents 21 45.9% Owner occupied25 54.1% Renter occupied
Language usage in Poplar Bluff
English speakers - Total 97.6% of residents of Poplar Bluff speak English at home.
1.7% of residents speak Spanish at home 208 81.9% Speak English very well46 18.1% Speak English less than very well0.6% of residents speak other language at home 65 67.0% Speak English very well32 33.0% Speak English less than very well
English speakers - Born in the United States 97.8% of residents of Poplar Bluff speak English at home.
1.6% of residents speak Spanish at home 76 100.0% Speak English very well0.5% of residents speak other language at home 21 100.0% Speak English very well
English speakers - Native, born elsewhere 88.2% of residents of Poplar Bluff speak English at home.
9.8% of residents speak Spanish at home 15 100.0% Speak English very well
English speakers - Foreign-born 41.7% of residents of Poplar Bluff speak English at home.
22.1% of residents speak Spanish at home 45 100.0% Speak English less than very well34.3% of residents speak other language at home 38 54.3% Speak English very well32 45.7% Speak English less than very well
White (Caucasian) - Speak only English Native:
99.6% (11,623)Foreign-born:
43.3% (17)
White (Caucasian) - Speak another language Native:
0.6% (69)Foreign-born:
57.1% (23)
Black or African American - Speak only English Native:
96.7% (1,337)Foreign-born:
100.0% (38)
Other race - Speak only English Native:
78.5% (382)Foreign-born:
50.0% (57)
Other race - Speak another language Native:
24.2% (118)Foreign-born:
62.3% (71)
White alone - Speak only English Native:
99.3% (11,544)Foreign-born:
37.0% (17)
White alone - Speak another language Native:
0.7% (82)Foreign-born:
61.7% (29)
Hispanic or Latino - Speak another language Native:
34.5% (112)Foreign-born:
99.4% (28)
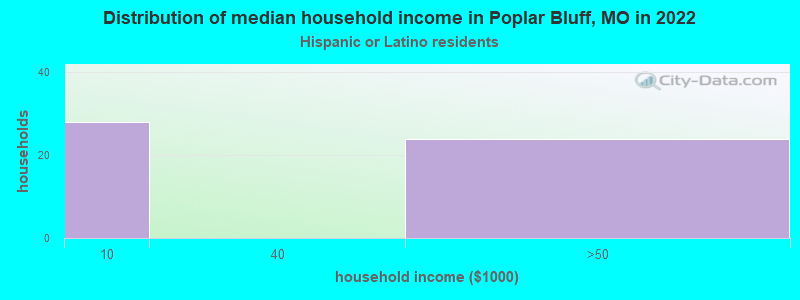
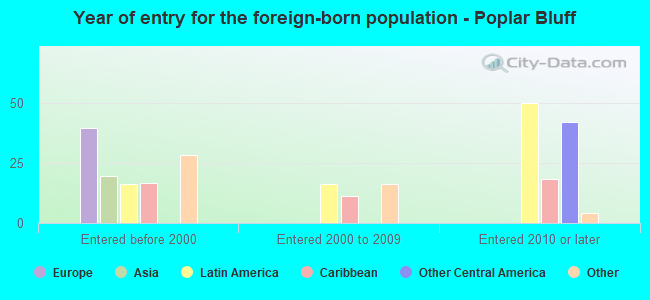
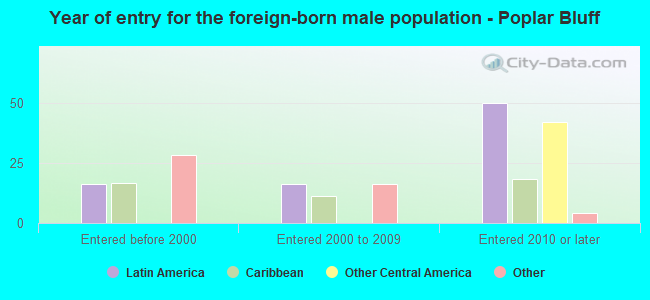
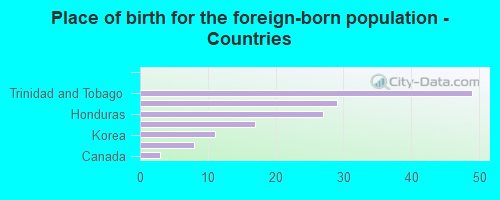
Foreign-born residents in Poplar Bluff 204 residents are foreign born
This city:
1.2%Missouri:
4.2%
Marital status for residents in Poplar Bluff Marital status - White (Caucasian) population 15 years and over
Males 42.5% Never married40.8% Now married2.5% Separated1.9% Widowed12.3% DivorcedFemales 25.9% Never married37.8% Now married3.1% Separated14.5% Widowed18.7% DivorcedWomen who gave birth in the past 12 months Now married:
56.7% (83)Unmarried:
43.3% (64)
Women who did not give birth in the past 12 months Now married:
36.0% (899)Unmarried:
64.0% (1,601)
Marital status - Black or African American population 15 years and over
Males 60.3% Never married24.4% Now married11.6% Separated1.7% Widowed1.9% DivorcedFemales 47.5% Never married10.4% Now married2.3% Separated5.1% Widowed34.8% DivorcedWomen who did not give birth in the past 12 months Now married:
0.0% (0)Unmarried:
100.0% (264)
Marital status - American Indian / Alaska Native population 15 years and over
Males 34.6% Never married65.4% Now married0.0% Separated0.0% Widowed0.0% DivorcedFemales 0.0% Never married66.1% Now married0.0% Separated22.0% Widowed11.9% DivorcedMarital status - Asian population 15 years and over
Males 0.0% Never married100.0% Now married0.0% Separated0.0% Widowed0.0% DivorcedFemales 0.0% Never married57.1% Now married0.0% Separated42.9% Widowed0.0% DivorcedMarital status - Other race population 15 years and over
Males 56.8% Never married14.5% Now married0.0% Separated0.0% Widowed28.7% DivorcedFemales 62.1% Never married0.0% Now married37.9% Separated0.0% Widowed0.0% DivorcedWomen who did not give birth in the past 12 months Now married:
37.9% (30)Unmarried:
62.1% (50)
Marital status - Two or more races population 15 years and over
Males 57.8% Never married40.6% Now married0.0% Separated0.0% Widowed1.6% DivorcedFemales 25.1% Never married32.4% Now married1.0% Separated2.4% Widowed39.0% DivorcedWomen who gave birth in the past 12 months Now married:
0.0% (0)Unmarried:
100.0% (100)
Women who did not give birth in the past 12 months Now married:
44.1% (72)Unmarried:
55.9% (91)
Marital status - White alone, not Hispanic / Latino population 15 years and over
Males 42.2% Never married41.0% Now married2.5% Separated1.9% Widowed12.4% DivorcedFemales 26.0% Never married37.9% Now married3.1% Separated14.5% Widowed18.4% DivorcedWomen who gave birth in the past 12 months Now married:
56.7% (84)Unmarried:
43.3% (64)
Women who did not give birth in the past 12 months Now married:
36.2% (908)Unmarried:
63.8% (1,599)
Marital status - Hispanic or Latino population 15 years and over
Males 75.4% Never married24.6% Now married0.0% Separated0.0% Widowed0.0% DivorcedFemales 42.3% Never married12.4% Now married25.8% Separated0.0% Widowed19.6% DivorcedWomen who did not give birth in the past 12 months Now married:
38.1% (41)Unmarried:
61.9% (66)
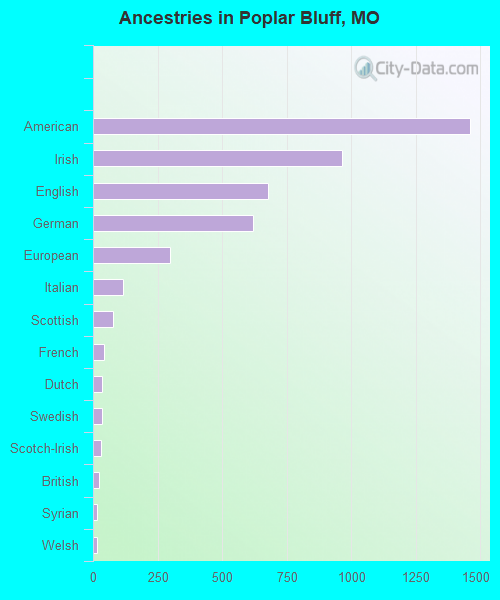
Ancestries in Poplar Bluff
1,461 23.5% American965 15.5% Irish677 10.9% English621 10.0% German297 4.8% European116 1.9% Italian79 1.3% Scottish43 0.7% French35 0.6% Dutch33 0.5% Swedish31 0.5% Scotch-Irish22 0.4% British17 0.3% Syrian15 0.2% Welsh5 0.08% Polish4 0.06% Canadian
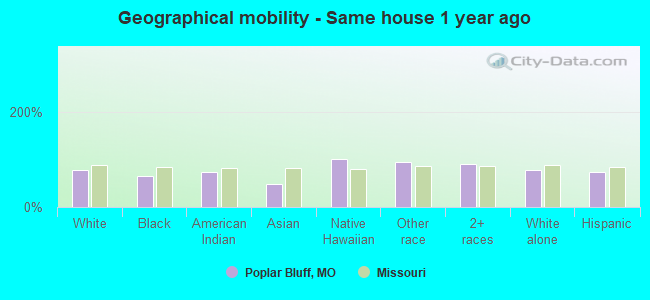
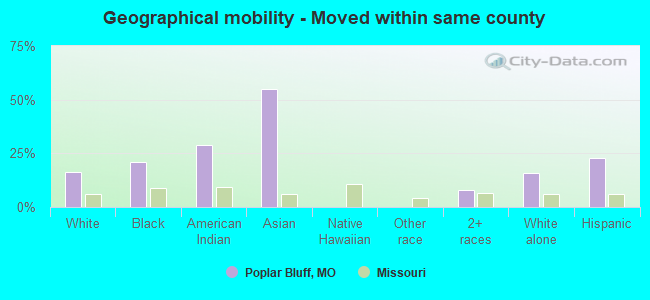
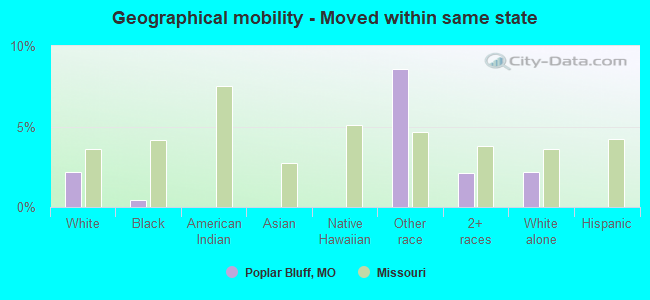
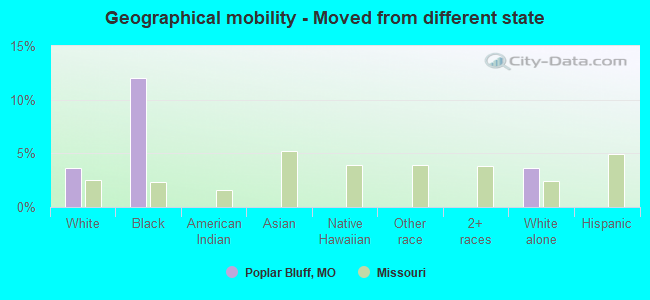
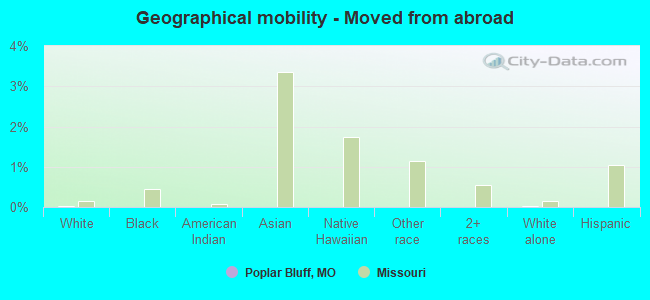
Geographical mobility in Poplar Bluff Same house 1 year ago 9,636 77.3% White (Caucasian)954 63.9% Black or African American79 73.1% American Indian / Alaska Native23 48.4% Asian29 100.0% Native Hawaiian / Pacific Islander552 93.7% Other race1,408 89.6% Two or more races9,681 77.8% White alone, not Hispanic / Latino278 73.2% Hispanic or LatinoMoved within same county 2,017 16.2% White / Caucasian310 20.8% Black or African American31 28.8% American Indian / Alaska Native26 55.2% Asian123 7.8% Two or more races1,942 15.6% White alone, not Hispanic / Latino86 22.7% Hispanic or LatinoMoved within same state 267 2.1% White / Caucasian7 0.4% Black or African American51 8.6% Other race33 2.1% Two or more races269 2.2% White alone, not Hispanic / LatinoMoved from different state 447 3.6% White / Caucasian179 12.0% Black or African American452 3.6% White alone, not Hispanic / LatinoMoved from abroad 3 0.0% White3 0.0% White alone, not Hispanic / Latino
Children Nativity (place of birth) in Poplar Bluff
Children under 6 years - Living with two parents Both parents native 557 100.0% NativeOne native, one foreign-born parent 14 100.0% NativeChildren under 6 years - Living with one parent Native parent 836 100.0% Native
Children 6 to 17 years - Living with two parents Both parents native 958 100.0% NativeOne native, one foreign-born parent 65 100.0% NativeChildren 6 to 17 years - Living with one parent Native parent 1,182 100.0% Native
Grandparents responsible for own grandchildren in Poplar Bluff
Grandparents (30 to 59 years) White / Caucasian 9 57.6% Responsible for grandchildren6 42.4% Not responsible for grandchildrenBlack or African American 5 14.0% Responsible for grandchildren32 86.0% Not responsible for grandchildrenTwo or more races 3 100.0% Responsible for grandchildrenWhite alone, not Hispanic / Latino 9 57.5% Responsible for grandchildren7 42.5% Not responsible for grandchildrenGrandparents (60 years and over) White / Caucasian 69 61.2% Responsible for grandchildren44 38.8% Not responsible for grandchildrenTwo or more races 7 100.0% Responsible for grandchildrenWhite alone, not Hispanic / Latino 70 60.8% Responsible for grandchildren45 39.2% Not responsible for grandchildren