Races in Pooler, Georgia (GA) Detailed Stats
Data:
Races - White alone (%)
Races - White alone (% change since 2000)
Races - Black alone (%)
Races - Black alone (% change since 2000)
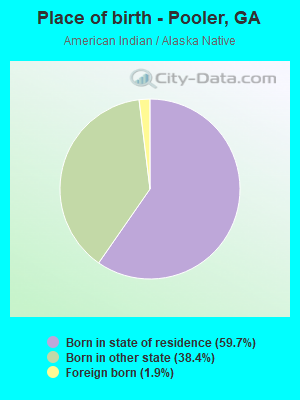
Races - American Indian alone (%)
Races - American Indian alone (% change since 2000)
Races - Asian alone (%)
Races - Asian alone (% change since 2000)
Races - Hispanic (%)
Races - Hispanic (% change since 2000)
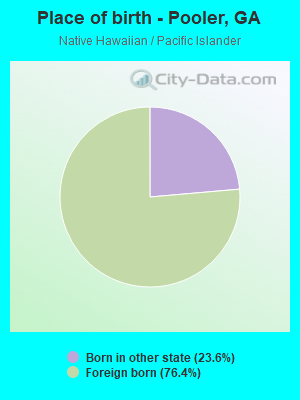
Races - Native Hawaiian and Other Pacific Islander alone (%)
Races - Native Hawaiian and Other Pacific Islander alone (% change since 2000)
Races - Two or more races(%)
Races - Two or more races(% change since 2000)
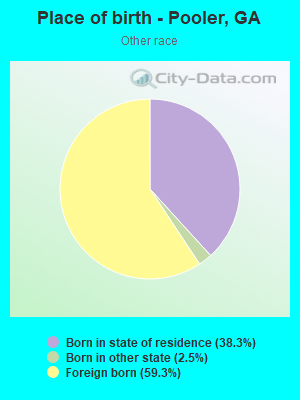
Races - Other race alone (%)
Races - Other race alone (% change since 2000)
Racial diversity
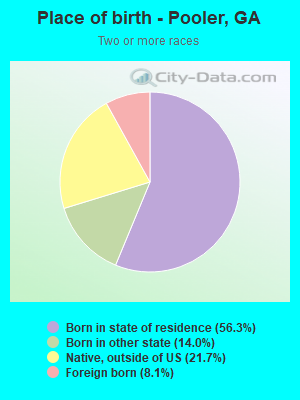
Place of birth - Born in state of residence (%)
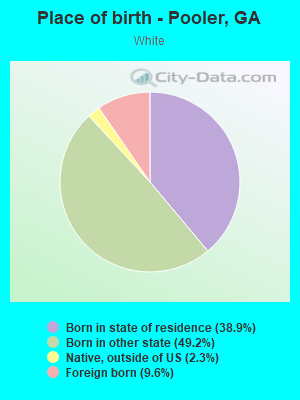
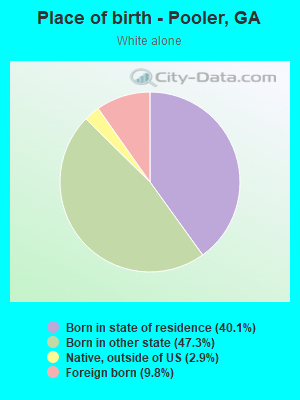
Place of birth - Born in state of residence (%) - White
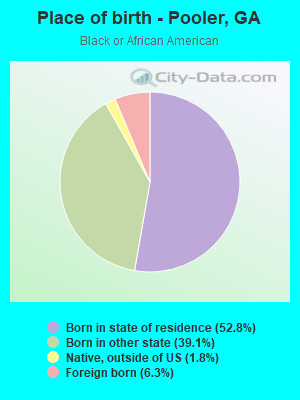
Place of birth - Born in state of residence (%) - Black or African American
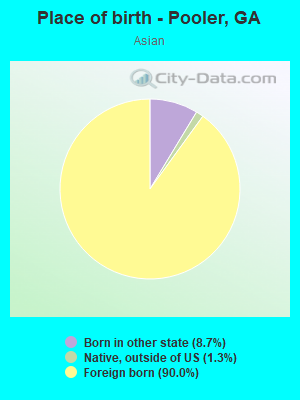
Place of birth - Born in state of residence (%) - Asian
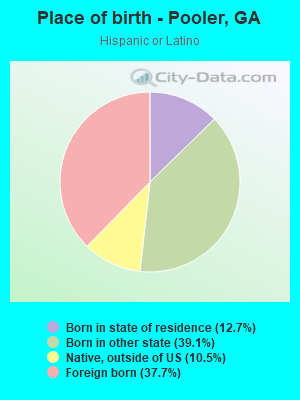
Place of birth - Born in state of residence (%) - Hispanic or Latino
Place of birth - Born in state of residence (%) - American Indian and Alaska Native
Place of birth - Born in state of residence (%) - Multirace
Place of birth - Born in state of residence (%) - Other Race
Place of birth - Born in other state (%)
Place of birth - Born in other state (%) - White
Place of birth - Born in other state (%) - Black or African American
Place of birth - Born in other state (%) - Asian
Place of birth - Born in other state (%) - Hispanic or Latino
Place of birth - Born in other state (%) - American Indian and Alaska Native
Place of birth - Born in other state (%) - Multirace
Place of birth - Born in other state (%) - Other Race
Place of birth - Native, outside of US (%)
Place of birth - Native, outside of US (%) - White
Place of birth - Native, outside of US (%) - Black or African American
Place of birth - Native, outside of US (%) - Asian
Place of birth - Native, outside of US (%) - Hispanic or Latino
Place of birth - Native, outside of US (%) - American Indian and Alaska Native
Place of birth - Native, outside of US (%) - Multirace
Place of birth - Native, outside of US (%) - Other Race
Place of birth - Foreign born (%)
Place of birth - Foreign born (%) - White
Place of birth - Foreign born (%) - Black or African American
Place of birth - Foreign born (%) - Asian
Place of birth - Foreign born (%) - Hispanic or Latino
Place of birth - Foreign born (%) - American Indian and Alaska Native
Place of birth - Foreign born (%) - Multirace
Place of birth - Foreign born (%) - Other Race
Residents speaking English at home (%)
Residents speaking English at home - Born in the United States (%)
Residents speaking English at home - Native, born elsewhere (%)
Residents speaking English at home - Foreign born (%)
Residents speaking Spanish at home (%)
Residents speaking Spanish at home - Born in the United States (%)
Residents speaking Spanish at home - Native, born elsewhere (%)
Residents speaking Spanish at home - Foreign born (%)
Residents speaking other language at home (%)
Residents speaking other language at home - Born in the United States (%)
Residents speaking other language at home - Native, born elsewhere (%)
Residents speaking other language at home - Foreign born (%)
Marital status - Never married (%)
Marital status - Now married (%)
Marital status - Separated (%)
Marital status - Widowed (%)
Marital status - Divorced (%)
Ancestries Reported - Arab (%)
Ancestries Reported - Czech (%)
Ancestries Reported - Danish (%)
Ancestries Reported - Dutch (%)
Ancestries Reported - English (%)
Ancestries Reported - French (%)
Ancestries Reported - French Canadian (%)
Ancestries Reported - German (%)
Ancestries Reported - Greek (%)
Ancestries Reported - Hungarian (%)
Ancestries Reported - Irish (%)
Ancestries Reported - Italian (%)
Ancestries Reported - Lithuanian (%)
Ancestries Reported - Norwegian (%)
Ancestries Reported - Polish (%)
Ancestries Reported - Portuguese (%)
Ancestries Reported - Russian (%)
Ancestries Reported - Scotch-Irish (%)
Ancestries Reported - Scottish (%)
Ancestries Reported - Slovak (%)
Ancestries Reported - Subsaharan African (%)
Ancestries Reported - Swedish (%)
Ancestries Reported - Swiss (%)
Ancestries Reported - Ukrainian (%)
Ancestries Reported - United States (%)
Ancestries Reported - Welsh (%)
Ancestries Reported - West Indian (%)
Ancestries Reported - Other (%)
Geographical mobility - Same house 1 year ago (%)
Geographical mobility - Same house 1 year ago (%) - White
Geographical mobility - Same house 1 year ago (%) - Black or African American
Geographical mobility - Same house 1 year ago (%) - Asian
Geographical mobility - Same house 1 year ago (%) - Hispanic or Latino
Geographical mobility - Same house 1 year ago (%) - American Indian and Alaska Native
Geographical mobility - Same house 1 year ago (%) - Multirace
Geographical mobility - Same house 1 year ago (%) - Other Race
Geographical mobility - Moved within same county (%)
Geographical mobility - Moved within same county (%) - White
Geographical mobility - Moved within same county (%) - Black or African American
Geographical mobility - Moved within same county (%) - Asian
Geographical mobility - Moved within same county (%) - Hispanic or Latino
Geographical mobility - Moved within same county (%) - American Indian and Alaska Native
Geographical mobility - Moved within same county (%) - Multirace
Geographical mobility - Moved within same county (%) - Other Race
Geographical mobility - Moved from different county within same state (%)
Geographical mobility - Moved from different county within same state (%) - White
Geographical mobility - Moved from different county within same state (%) - Black or African American
Geographical mobility - Moved from different county within same state (%) - Asian
Geographical mobility - Moved from different county within same state (%) - Hispanic or Latino
Geographical mobility - Moved from different county within same state (%) - American Indian and Alaska Native
Geographical mobility - Moved from different county within same state (%) - Multirace
Geographical mobility - Moved from different county within same state (%) - Other Race
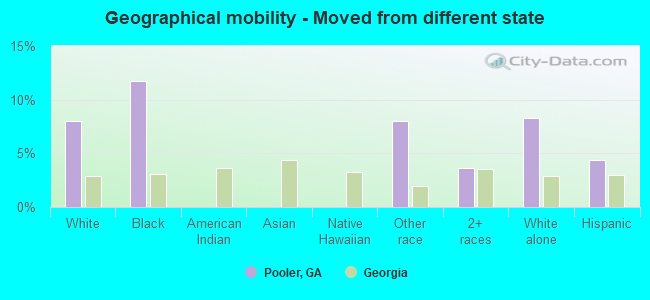
Geographical mobility - Moved from different state (%)
Geographical mobility - Moved from different state (%) - White
Geographical mobility - Moved from different state (%) - Black or African American
Geographical mobility - Moved from different state (%) - Asian
Geographical mobility - Moved from different state (%) - Hispanic or Latino
Geographical mobility - Moved from different state (%) - American Indian and Alaska Native
Geographical mobility - Moved from different state (%) - Multirace
Geographical mobility - Moved from different state (%) - Other Race
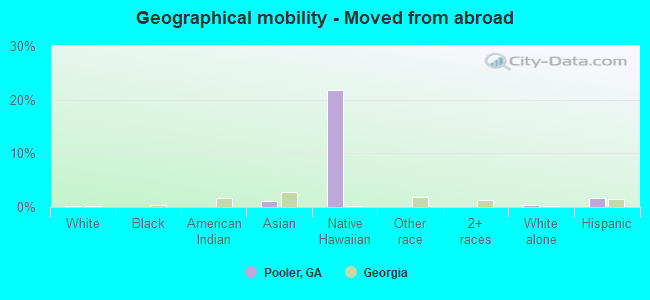
Geographical mobility - Moved from abroad (%)
Geographical mobility - Moved from abroad (%) - White
Geographical mobility - Moved from abroad (%) - Black or African American
Geographical mobility - Moved from abroad (%) - Asian
Geographical mobility - Moved from abroad (%) - Hispanic or Latino
Geographical mobility - Moved from abroad (%) - American Indian and Alaska Native
Geographical mobility - Moved from abroad (%) - Multirace
Geographical mobility - Moved from abroad (%) - Other Race
Place of birth for the foreign-born population - Ireland (%)
Place of birth for the foreign-born population - Denmark (%)
Place of birth for the foreign-born population - Norway (%)
Place of birth for the foreign-born population - Sweden (%)
Place of birth for the foreign-born population - United Kingdom (%)
Place of birth for the foreign-born population - England (%)
Place of birth for the foreign-born population - Scotland (%)
Place of birth for the foreign-born population - Other Northern Europe (%)
Place of birth for the foreign-born population - Austria (%)
Place of birth for the foreign-born population - Belgium (%)
Place of birth for the foreign-born population - France (%)
Place of birth for the foreign-born population - Germany (%)
Place of birth for the foreign-born population - Netherlands (%)
Place of birth for the foreign-born population - Switzerland (%)
Place of birth for the foreign-born population - Other Western Europe (%)
Place of birth for the foreign-born population - Greece (%)
Place of birth for the foreign-born population - Italy (%)
Place of birth for the foreign-born population - Portugal (%)
Place of birth for the foreign-born population - Spain (%)
Place of birth for the foreign-born population - Other Southern Europe (%)
Place of birth for the foreign-born population - Albania (%)
Place of birth for the foreign-born population - Belarus (%)
Place of birth for the foreign-born population - Bosnia and Herzegovina (%)
Place of birth for the foreign-born population - Bulgaria (%)
Place of birth for the foreign-born population - Croatia (%)
Place of birth for the foreign-born population - Czechoslovakia (%)
Place of birth for the foreign-born population - Hungary (%)
Place of birth for the foreign-born population - Latvia (%)
Place of birth for the foreign-born population - Lithuania (%)
Place of birth for the foreign-born population - North Macedonia (Macedonia) (%)
Place of birth for the foreign-born population - Moldova (%)
Place of birth for the foreign-born population - Poland (%)
Place of birth for the foreign-born population - Romania (%)
Place of birth for the foreign-born population - Russia (%)
Place of birth for the foreign-born population - Serbia (%)
Place of birth for the foreign-born population - Ukraine (%)
Place of birth for the foreign-born population - Other Eastern Europe (%)
Place of birth for the foreign-born population - China (%)
Place of birth for the foreign-born population - Hong Kong (%)
Place of birth for the foreign-born population - Taiwan (%)
Place of birth for the foreign-born population - Japan (%)
Place of birth for the foreign-born population - Korea (%)
Place of birth for the foreign-born population - Other Eastern Asia (%)
Place of birth for the foreign-born population - Afghanistan (%)
Place of birth for the foreign-born population - Bangladesh (%)
Place of birth for the foreign-born population - India (%)
Place of birth for the foreign-born population - Iran (%)
Place of birth for the foreign-born population - Kazakhstan (%)
Place of birth for the foreign-born population - Nepal (%)
Place of birth for the foreign-born population - Pakistan (%)
Place of birth for the foreign-born population - Sri Lanka (%)
Place of birth for the foreign-born population - Uzbekistan (%)
Place of birth for the foreign-born population - Other South Central Asia (%)
Place of birth for the foreign-born population - Burma (%)
Place of birth for the foreign-born population - Cambodia (%)
Place of birth for the foreign-born population - Indonesia (%)
Place of birth for the foreign-born population - Laos (%)
Place of birth for the foreign-born population - Malaysia (%)
Place of birth for the foreign-born population - Philippines (%)
Place of birth for the foreign-born population - Singapore (%)
Place of birth for the foreign-born population - Thailand (%)
Place of birth for the foreign-born population - Vietnam (%)
Place of birth for the foreign-born population - Other South Eastern Asia (%)
Place of birth for the foreign-born population - Armenia (%)
Place of birth for the foreign-born population - Iraq (%)
Place of birth for the foreign-born population - Israel (%)
Place of birth for the foreign-born population - Jordan (%)
Place of birth for the foreign-born population - Kuwait (%)
Place of birth for the foreign-born population - Lebanon (%)
Place of birth for the foreign-born population - Saudi Arabia (%)
Place of birth for the foreign-born population - Syria (%)
Place of birth for the foreign-born population - Turkey (%)
Place of birth for the foreign-born population - Yemen (%)
Place of birth for the foreign-born population - Other Western Asia (%)
Place of birth for the foreign-born population - Eritrea (%)
Place of birth for the foreign-born population - Ethiopia (%)
Place of birth for the foreign-born population - Kenya (%)
Place of birth for the foreign-born population - Somalia (%)
Place of birth for the foreign-born population - Uganda (%)
Place of birth for the foreign-born population - Zimbabwe (%)
Place of birth for the foreign-born population - Other Eastern Africa (%)
Place of birth for the foreign-born population - Cameroon (%)
Place of birth for the foreign-born population - Congo (%)
Place of birth for the foreign-born population - Democratic Republic of Congo (Zaire) (%)
Place of birth for the foreign-born population - Other Middle Africa (%)
Place of birth for the foreign-born population - Egypt (%)
Place of birth for the foreign-born population - Morocco (%)
Place of birth for the foreign-born population - Sudan (%)
Place of birth for the foreign-born population - Other Northern Africa (%)
Place of birth for the foreign-born population - South Africa (%)
Place of birth for the foreign-born population - Other Southern Africa (%)
Place of birth for the foreign-born population - Cabo Verde (%)
Place of birth for the foreign-born population - Ghana (%)
Place of birth for the foreign-born population - Liberia (%)
Place of birth for the foreign-born population - Nigeria (%)
Place of birth for the foreign-born population - Senegal (%)
Place of birth for the foreign-born population - Sierra Leone (%)
Place of birth for the foreign-born population - Other Western Africa (%)
Place of birth for the foreign-born population - Australia (%)
Place of birth for the foreign-born population - New Zealand (%)
Place of birth for the foreign-born population - Fiji (%)
Place of birth for the foreign-born population - Micronesia (%)
Place of birth for the foreign-born population - Bahamas (%)
Place of birth for the foreign-born population - Barbados (%)
Place of birth for the foreign-born population - Cuba (%)
Place of birth for the foreign-born population - Dominica (%)
Place of birth for the foreign-born population - Dominican Republic (%)
Place of birth for the foreign-born population - Grenada (%)
Place of birth for the foreign-born population - Haiti (%)
Place of birth for the foreign-born population - Jamaica (%)
Place of birth for the foreign-born population - St. Vincent and the Grenadines (%)
Place of birth for the foreign-born population - Trinidad and Tobago (%)
Place of birth for the foreign-born population - West Indies (%)
Place of birth for the foreign-born population - Other Caribbean (%)
Place of birth for the foreign-born population - Belize (%)
Place of birth for the foreign-born population - Costa Rica (%)
Place of birth for the foreign-born population - El Salvador (%)
Place of birth for the foreign-born population - Guatemala (%)
Place of birth for the foreign-born population - Honduras (%)
Place of birth for the foreign-born population - Mexico (%)
Place of birth for the foreign-born population - Nicaragua (%)
Place of birth for the foreign-born population - Panama (%)
Place of birth for the foreign-born population - Other Central America (%)
Place of birth for the foreign-born population - Argentina (%)
Place of birth for the foreign-born population - Bolivia (%)
Place of birth for the foreign-born population - Brazil (%)
Place of birth for the foreign-born population - Chile (%)
Place of birth for the foreign-born population - Colombia (%)
Place of birth for the foreign-born population - Ecuador (%)
Place of birth for the foreign-born population - Guyana (%)
Place of birth for the foreign-born population - Peru (%)
Place of birth for the foreign-born population - Uruguay (%)
Place of birth for the foreign-born population - Venezuela (%)
Place of birth for the foreign-born population - Other South America (%)
Place of birth for the foreign-born population - Canada (%)
Place of birth for the foreign-born population - Other Northern America (%)
Place of birth for the foreign-born population - Other (%)
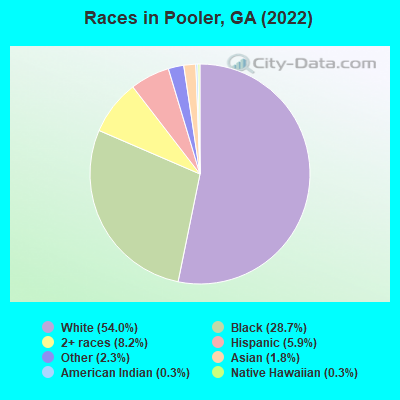
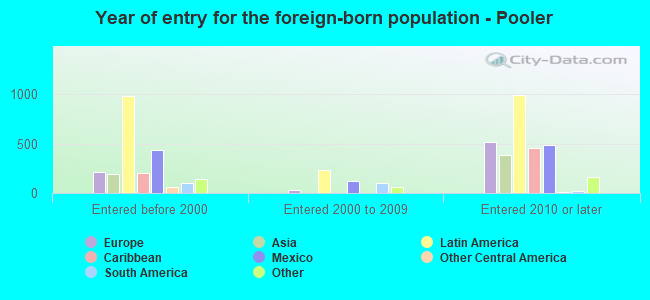
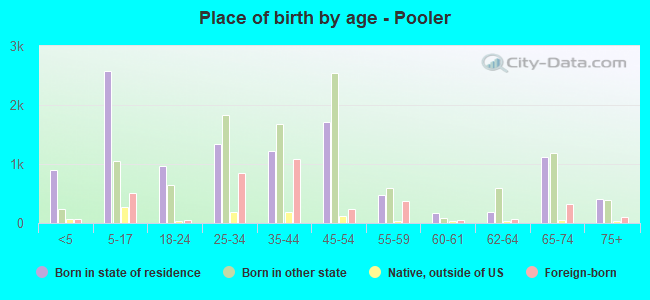
According to 2022 data, the most numerous races in Pooler, GA are White alone (14,410 residents), Black alone (7,670 residents), and Hispanic (1,584 residents). 88.6% of Pooler residents speak English at home. 14.6% of Pooler, GA residents are foreign-born (7.2% born in Latin America, 3.1% born in Europe, 2.4% born in Asia), which is 31.5% greater than the foreign-born rate of 10.0% across the entire state of Georgia.
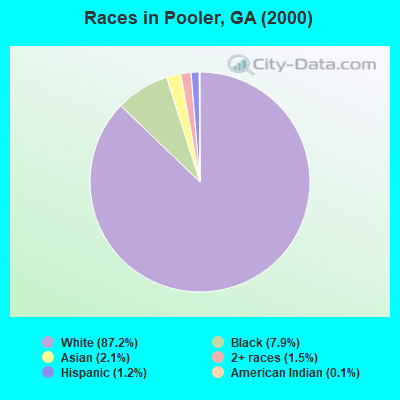
Race distribution in Pooler
2000 2022
5,128,661 62.6% White alone 2,331,465 28.5% Black alone 435,227 5.3% Hispanic 171,513 2.1% Asian alone 87,364 1.1% Two or more races 17,670 0.2% American Indian alone 11,275 0.1% Other race alone 3,278 0.04% Native Hawaiian and Other
5,415,657 49.6% White alone 3,349,240 30.7% Black alone 1,132,604 10.4% Hispanic 479,156 4.4% Asian alone 462,923 4.2% Two or more races 54,416 0.5% Other race alone 11,923 0.1% American Indian alone 6,957 0.06% Native Hawaiian and Other
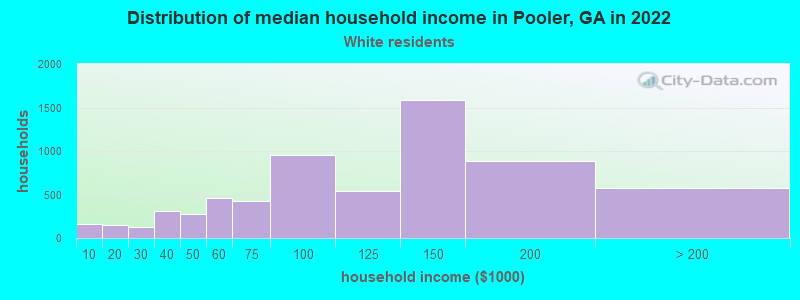
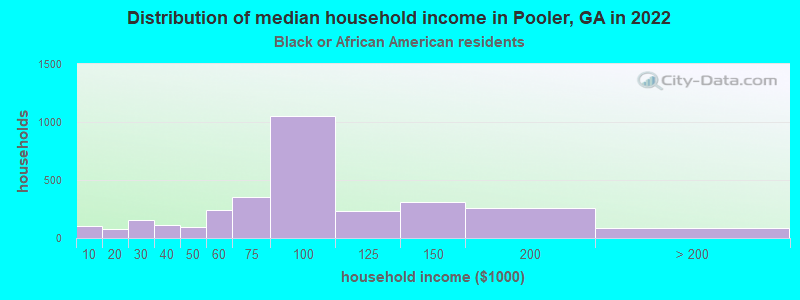
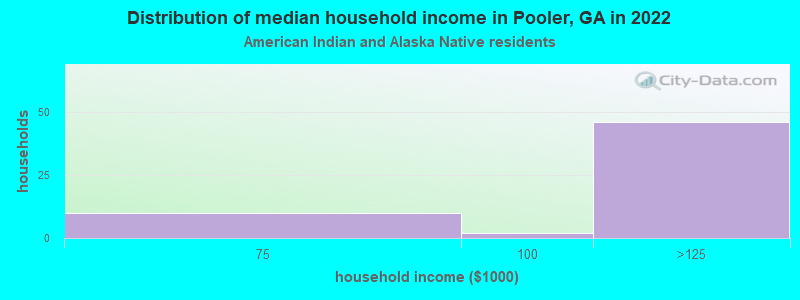
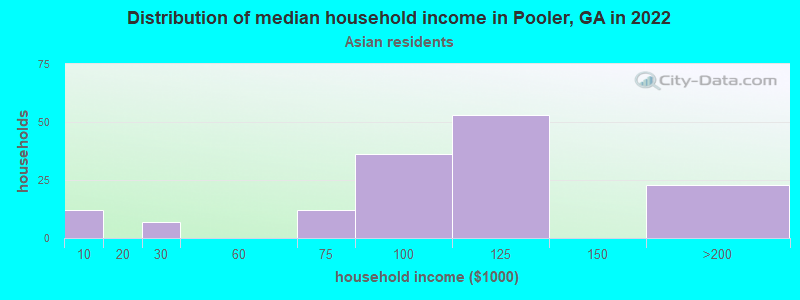
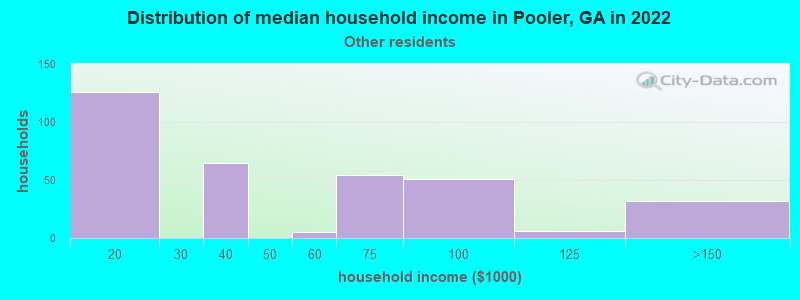
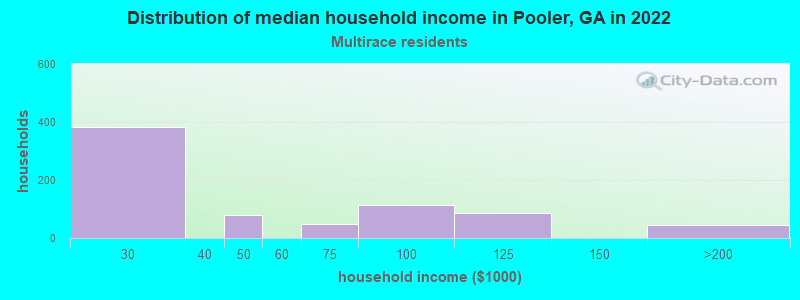
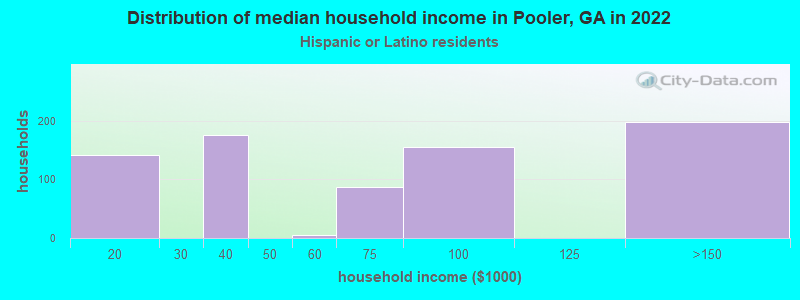
Income and house value in Pooler Median household income in 2022 $116,967 White non-Hispanic householders$85,333 Black householders$75,937 American Indian and Alaska Native householders$95,355 Asian householders$83,826 Hispanic or Latino race householdersMedian 2022 house value $317,388 White Non-Hispanic householders$300,913 Black or African American householders$378,243 American Indian or Alaska Native householders $453,555 Asian householdersover $1,000,000 Some other race householders$462,297 Two or more races householdersover $1,000,000 Hispanic or Latino householders
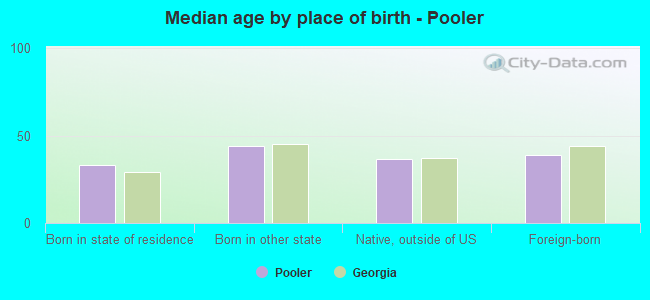
Median age by race in Pooler
42.3 Median age for White residents41.9 42.9 35.4 Median age for Black or African American residents33.3 37.5 14.0 Median age for American Indian / Alaska Native residents5.6 39.1 35.3 Median age for Asian residents31.0 36.0 29.9 Median age for Native Hawaiian / Pacific Islander residents-693,227,090.9 -776,776,776.0 28.9 Median age for Other race residents27.5 33.0 43.8 Median age for Two or more races residents39.6 45.3 42.5 Median age for White alone residents42.6 42.0 39.9 Median age for Hispanic or Latino residents39.9 35.1
Owner/renter occupied households by race in Pooler
House owners and renters - White residents 4,611 69.7% Owner occupied2,008 30.3% Renter occupiedHouse owners and renters - Black or African American residents 1,599 52.5% Owner occupied1,449 47.5% Renter occupiedHouse owners and renters - American Indian / Alaska Native residents 50 100.0% Owner occupiedHouse owners and renters - Asian residents 35 28.1% Owner occupied90 71.9% Renter occupiedHouse owners and renters - Native Hawaiian / Pacific Islander residents 147 100.0% Renter occupiedHouse owners and renters - Other race residents 183 55.7% Owner occupied146 44.3% Renter occupiedHouse owners and renters - Two or more races residents 159 18.3% Owner occupied709 81.7% Renter occupiedHouse owners and renters - White alone residents 4,526 71.7% Owner occupied1,788 28.3% Renter occupiedHouse owners and renters - Hispanic or Latino residents 208 31.2% Owner occupied460 68.8% Renter occupied
Language usage in Pooler
English speakers - Total 88.6% of residents of Pooler speak English at home.
6.7% of residents speak Spanish at home 500 29.2% Speak English very well1,215 70.8% Speak English less than very well4.4% of residents speak other language at home 772 68.4% Speak English very well356 31.6% Speak English less than very well
English speakers - Born in the United States 94.9% of residents of Pooler speak English at home.
3.4% of residents speak Spanish at home 179 48.5% Speak English very well190 51.5% Speak English less than very well2.5% of residents speak other language at home 114 41.9% Speak English very well158 58.1% Speak English less than very well
English speakers - Native, born elsewhere 76.7% of residents of Pooler speak English at home.
18.6% of residents speak Spanish at home 171 100.0% Speak English less than very well9.3% of residents speak other language at home 55 64.7% Speak English very well30 35.3% Speak English less than very well
English speakers - Foreign-born 54.0% of residents of Pooler speak English at home.
30.1% of residents speak Spanish at home 324 29.3% Speak English very well780 70.7% Speak English less than very well21.6% of residents speak other language at home 592 74.7% Speak English very well201 25.3% Speak English less than very well
White (Caucasian) - Speak only English Native:
97.6% (12,146)Foreign-born:
41.9% (559)
White (Caucasian) - Speak another language Native:
2.5% (314)Foreign-born:
69.2% (924)
Black or African American - Speak only English Native:
99.1% (6,751)Foreign-born:
99.3% (491)
Black or African American - Speak another language Native:
1.1% (77)Foreign-born:
10.3% (51)
American Indian / Alaska Native - Speak only English Native:
95.0% (85)Foreign-born:
96.6% (2)
Asian - Speak only English Native:
40.0% (17)Foreign-born:
15.3% (61)
Asian - Speak another language Native:
53.2% (23)Foreign-born:
73.5% (294)
Other race - Speak only English Native:
70.3% (153)Foreign-born:
27.7% (101)
Other race - Speak another language Native:
30.9% (67)Foreign-born:
73.3% (268)
Two or more races - Speak only English Native:
88.7% (2,156)Foreign-born:
71.2% (144)
White alone - Speak only English Native:
97.0% (11,863)Foreign-born:
43.3% (590)
White alone - Speak another language Native:
3.0% (369)Foreign-born:
46.1% (628)
Hispanic or Latino - Speak only English Native:
62.9% (616)Foreign-born:
0.3% (2)
Hispanic or Latino - Speak another language Native:
37.9% (371)Foreign-born:
94.5% (516)
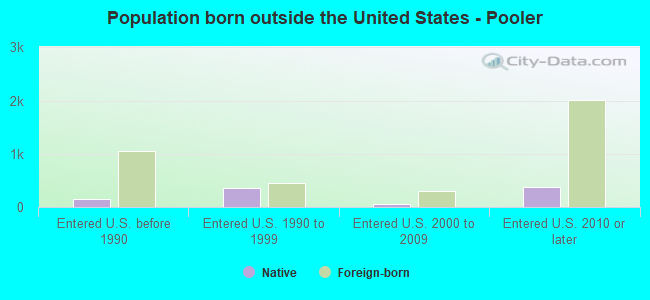
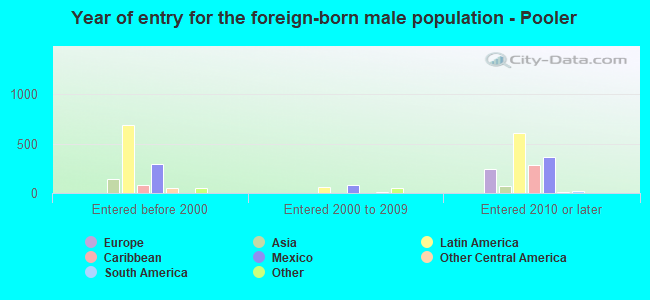
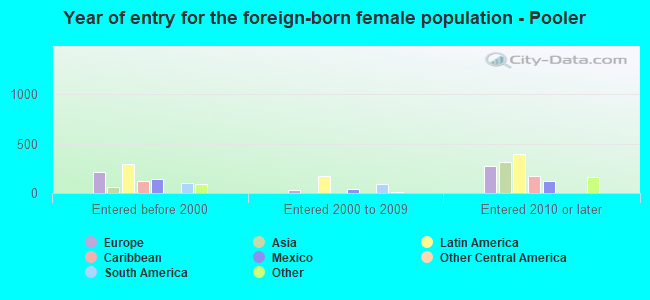
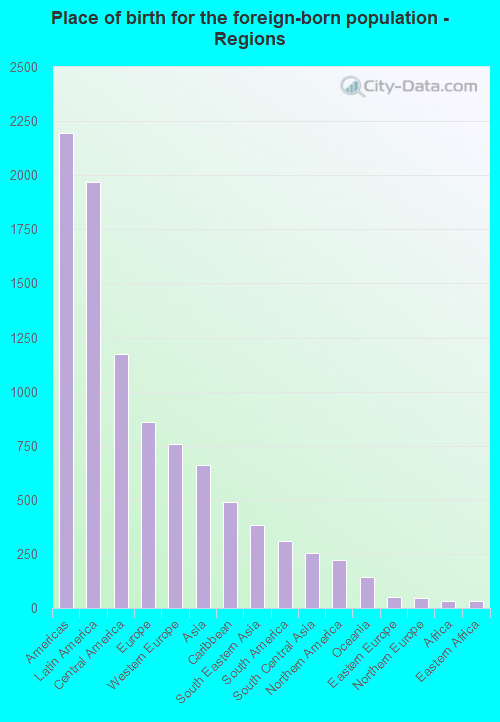
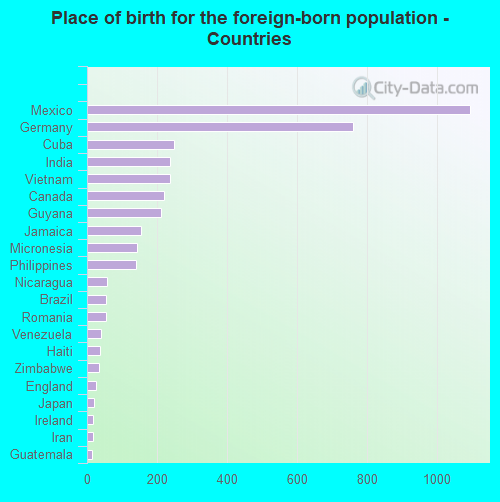
Foreign-born residents in Pooler 3,894 residents are foreign born (7.2% Latin America , 3.1% Europe , 2.4% Asia ).
This city:
14.6%Georgia:
10.4%
Marital status for residents in Pooler Marital status - White (Caucasian) population 15 years and over
Males 26.4% Never married57.8% Now married1.0% Separated1.4% Widowed13.4% DivorcedFemales 18.0% Never married62.9% Now married1.0% Separated5.5% Widowed12.6% DivorcedWomen who gave birth in the past 12 months Now married:
100.0% (69)Unmarried:
0.0% (0)
Women who did not give birth in the past 12 months Now married:
64.5% (2,257)Unmarried:
35.5% (1,243)
Marital status - Black or African American population 15 years and over
Males 34.9% Never married60.3% Now married0.0% Separated1.4% Widowed3.3% DivorcedFemales 31.2% Never married46.8% Now married0.9% Separated9.2% Widowed11.9% DivorcedWomen who did not give birth in the past 12 months Now married:
41.1% (935)Unmarried:
58.9% (1,338)
Marital status - American Indian / Alaska Native population 15 years and over
Males 0.0% Never married100.0% Now married0.0% Separated0.0% Widowed0.0% DivorcedFemales 36.0% Never married44.0% Now married0.0% Separated0.0% Widowed20.0% DivorcedWomen who did not give birth in the past 12 months Now married:
55.0% (35)Unmarried:
45.0% (29)
Marital status - Asian population 15 years and over
Males 31.7% Never married68.3% Now married0.0% Separated0.0% Widowed0.0% DivorcedFemales 31.0% Never married54.5% Now married0.0% Separated14.5% Widowed0.0% DivorcedWomen who did not give birth in the past 12 months Now married:
61.4% (148)Unmarried:
38.6% (93)
Marital status - Native Hawaiian / Pacific Islander population 15 years and over
Males 54.6% Never married45.4% Now married0.0% Separated0.0% Widowed0.0% DivorcedFemales 0.0% Never married100.0% Now married0.0% Separated0.0% Widowed0.0% DivorcedWomen who did not give birth in the past 12 months Now married:
100.0% (88)Unmarried:
0.0% (0)
Marital status - Other race population 15 years and over
Males 35.7% Never married39.8% Now married0.0% Separated0.0% Widowed24.6% DivorcedFemales 1.7% Never married56.7% Now married0.0% Separated40.6% Widowed1.1% DivorcedWomen who gave birth in the past 12 months Now married:
42.1% (69)Unmarried:
57.9% (95)
Women who did not give birth in the past 12 months Now married:
90.7% (64)Unmarried:
9.3% (6)
Marital status - Two or more races population 15 years and over
Males 66.3% Never married33.7% Now married0.0% Separated0.0% Widowed0.0% DivorcedFemales 17.5% Never married41.8% Now married0.0% Separated2.6% Widowed38.1% DivorcedWomen who did not give birth in the past 12 months Now married:
30.4% (198)Unmarried:
69.6% (454)
Marital status - White alone, not Hispanic / Latino population 15 years and over
Males 27.4% Never married56.2% Now married1.1% Separated1.4% Widowed13.9% DivorcedFemales 19.0% Never married63.5% Now married1.1% Separated6.0% Widowed10.4% DivorcedWomen who gave birth in the past 12 months Now married:
100.0% (72)Unmarried:
0.0% (0)
Women who did not give birth in the past 12 months Now married:
63.3% (2,183)Unmarried:
36.7% (1,268)
Marital status - Hispanic or Latino population 15 years and over
Males 36.6% Never married53.0% Now married0.0% Separated0.0% Widowed10.4% DivorcedFemales 16.4% Never married56.6% Now married0.0% Separated0.0% Widowed27.0% DivorcedWomen who did not give birth in the past 12 months Now married:
71.4% (299)Unmarried:
28.6% (120)
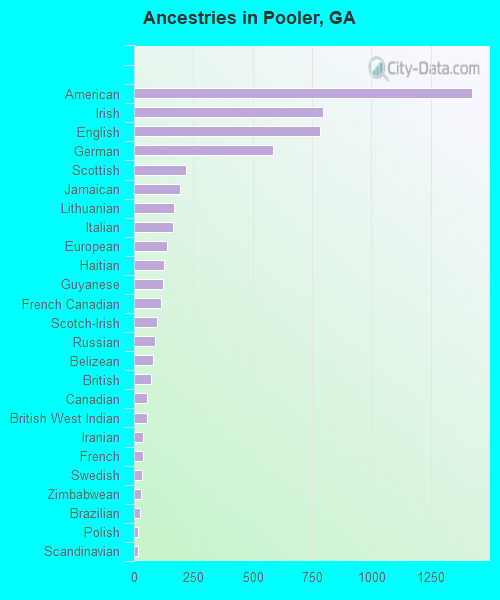
Ancestries in Pooler
1,425 10.5% American796 5.9% Irish784 5.8% English586 4.3% German218 1.6% Scottish195 1.4% Jamaican169 1.2% Lithuanian164 1.2% Italian137 1.0% European127 0.9% Haitian121 0.9% Guyanese115 0.8% French Canadian96 0.7% Scotch-Irish87 0.6% Russian78 0.6% Belizean73 0.5% British56 0.4% Canadian53 0.4% British West Indian39 0.3% Iranian36 0.3% French32 0.2% Swedish31 0.2% Zimbabwean25 0.2% Brazilian18 0.1% Polish17 0.1% Scandinavian15 0.1% Greek9 0.07% Hungarian8 0.06% Eastern European7 0.05% Portuguese5 0.04% Dutch1 0.01% Czech1 0.01% African
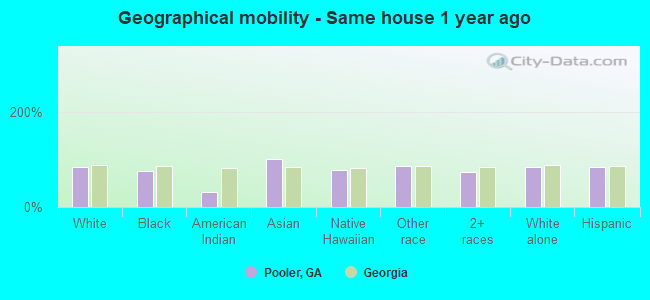
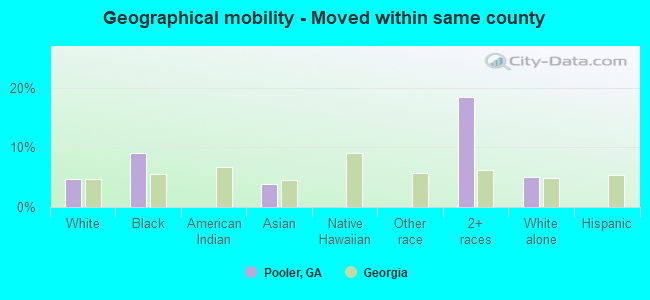
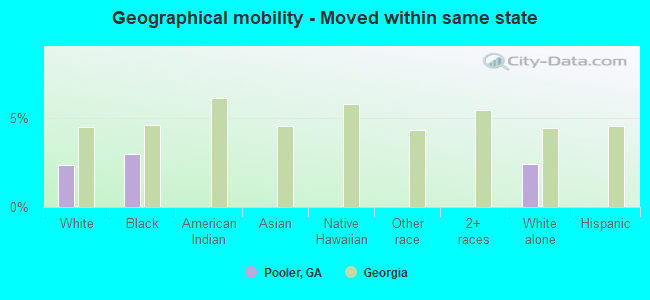
Geographical mobility in Pooler Same house 1 year ago 12,478 84.0% White (Caucasian)5,943 76.4% Black or African American47 32.0% American Indian / Alaska Native522 100.0% Asian174 77.8% Native Hawaiian / Pacific Islander564 86.2% Other race1,885 74.5% Two or more races11,953 83.3% White alone, not Hispanic / Latino1,349 84.3% Hispanic or LatinoMoved within same county 706 4.8% White / Caucasian708 9.1% Black or African American19 3.9% Asian468 18.5% Two or more races729 5.1% White alone, not Hispanic / LatinoMoved within same state 345 2.3% White / Caucasian229 2.9% Black or African American343 2.4% White alone, not Hispanic / LatinoMoved from different state 1,193 8.0% White / Caucasian913 11.7% Black or African American52 8.0% Other race92 3.6% Two or more races1,194 8.3% White alone, not Hispanic / Latino70 4.3% Hispanic or LatinoMoved from abroad 36 0.2% White6 1.1% Asian49 21.8% Native Hawaiian / Pacific Islander60 0.4% White alone, not Hispanic / Latino27 1.7% Hispanic or Latino
Children Nativity (place of birth) in Pooler
Children under 6 years - Living with two parents Both parents native 747 100.0% NativeBoth parents foreign-born 176 77.0% Native53 23.0% Foreign-bornOne native, one foreign-born parent 27 100.0% NativeChildren under 6 years - Living with one parent Native parent 519 99.9% Native0 0.1% Foreign-bornForeign-born parent 8 100.0% Foreign-bornChildren 6 to 17 years - Living with two parents Both parents native 1,881 100.0% NativeBoth parents foreign-born 46 100.0% NativeOne native, one foreign-born parent 157 23.1% Native523 76.9% Foreign-bornChildren 6 to 17 years - Living with one parent Native parent 785 100.0% NativeForeign-born parent 226 61.9% Native139 38.1% Foreign-born
Grandparents responsible for own grandchildren in Pooler
Grandparents (30 to 59 years) White / Caucasian 101 100.0% Responsible for grandchildrenBlack or African American 74 42.1% Responsible for grandchildren102 57.9% Not responsible for grandchildrenWhite alone, not Hispanic / Latino 104 100.0% Responsible for grandchildrenGrandparents (60 years and over) White / Caucasian 36 45.4% Responsible for grandchildren44 54.6% Not responsible for grandchildrenBlack or African American 132 100.0% Not responsible for grandchildrenWhite alone, not Hispanic / Latino 37 45.1% Responsible for grandchildren45 54.9% Not responsible for grandchildren