Races in Pleasantville, New Jersey (NJ) Detailed Stats
Data:
Races - White alone (%)
Races - White alone (% change since 2000)
Races - Black alone (%)
Races - Black alone (% change since 2000)
Races - American Indian alone (%)
Races - American Indian alone (% change since 2000)
Races - Asian alone (%)
Races - Asian alone (% change since 2000)
Races - Hispanic (%)
Races - Hispanic (% change since 2000)
Races - Native Hawaiian and Other Pacific Islander alone (%)
Races - Native Hawaiian and Other Pacific Islander alone (% change since 2000)
Races - Two or more races(%)
Races - Two or more races(% change since 2000)
Races - Other race alone (%)
Races - Other race alone (% change since 2000)
Racial diversity
Place of birth - Born in state of residence (%)
Place of birth - Born in state of residence (%) - White
Place of birth - Born in state of residence (%) - Black or African American
Place of birth - Born in state of residence (%) - Asian
Place of birth - Born in state of residence (%) - Hispanic or Latino
Place of birth - Born in state of residence (%) - American Indian and Alaska Native
Place of birth - Born in state of residence (%) - Multirace
Place of birth - Born in state of residence (%) - Other Race
Place of birth - Born in other state (%)
Place of birth - Born in other state (%) - White
Place of birth - Born in other state (%) - Black or African American
Place of birth - Born in other state (%) - Asian
Place of birth - Born in other state (%) - Hispanic or Latino
Place of birth - Born in other state (%) - American Indian and Alaska Native
Place of birth - Born in other state (%) - Multirace
Place of birth - Born in other state (%) - Other Race
Place of birth - Native, outside of US (%)
Place of birth - Native, outside of US (%) - White
Place of birth - Native, outside of US (%) - Black or African American
Place of birth - Native, outside of US (%) - Asian
Place of birth - Native, outside of US (%) - Hispanic or Latino
Place of birth - Native, outside of US (%) - American Indian and Alaska Native
Place of birth - Native, outside of US (%) - Multirace
Place of birth - Native, outside of US (%) - Other Race
Place of birth - Foreign born (%)
Place of birth - Foreign born (%) - White
Place of birth - Foreign born (%) - Black or African American
Place of birth - Foreign born (%) - Asian
Place of birth - Foreign born (%) - Hispanic or Latino
Place of birth - Foreign born (%) - American Indian and Alaska Native
Place of birth - Foreign born (%) - Multirace
Place of birth - Foreign born (%) - Other Race
Residents speaking English at home (%)
Residents speaking English at home - Born in the United States (%)
Residents speaking English at home - Native, born elsewhere (%)
Residents speaking English at home - Foreign born (%)
Residents speaking Spanish at home (%)
Residents speaking Spanish at home - Born in the United States (%)
Residents speaking Spanish at home - Native, born elsewhere (%)
Residents speaking Spanish at home - Foreign born (%)
Residents speaking other language at home (%)
Residents speaking other language at home - Born in the United States (%)
Residents speaking other language at home - Native, born elsewhere (%)
Residents speaking other language at home - Foreign born (%)
Marital status - Never married (%)
Marital status - Now married (%)
Marital status - Separated (%)
Marital status - Widowed (%)
Marital status - Divorced (%)
Ancestries Reported - Arab (%)
Ancestries Reported - Czech (%)
Ancestries Reported - Danish (%)
Ancestries Reported - Dutch (%)
Ancestries Reported - English (%)
Ancestries Reported - French (%)
Ancestries Reported - French Canadian (%)
Ancestries Reported - German (%)
Ancestries Reported - Greek (%)
Ancestries Reported - Hungarian (%)
Ancestries Reported - Irish (%)
Ancestries Reported - Italian (%)
Ancestries Reported - Lithuanian (%)
Ancestries Reported - Norwegian (%)
Ancestries Reported - Polish (%)
Ancestries Reported - Portuguese (%)
Ancestries Reported - Russian (%)
Ancestries Reported - Scotch-Irish (%)
Ancestries Reported - Scottish (%)
Ancestries Reported - Slovak (%)
Ancestries Reported - Subsaharan African (%)
Ancestries Reported - Swedish (%)
Ancestries Reported - Swiss (%)
Ancestries Reported - Ukrainian (%)
Ancestries Reported - United States (%)
Ancestries Reported - Welsh (%)
Ancestries Reported - West Indian (%)
Ancestries Reported - Other (%)
Geographical mobility - Same house 1 year ago (%)
Geographical mobility - Same house 1 year ago (%) - White
Geographical mobility - Same house 1 year ago (%) - Black or African American
Geographical mobility - Same house 1 year ago (%) - Asian
Geographical mobility - Same house 1 year ago (%) - Hispanic or Latino
Geographical mobility - Same house 1 year ago (%) - American Indian and Alaska Native
Geographical mobility - Same house 1 year ago (%) - Multirace
Geographical mobility - Same house 1 year ago (%) - Other Race
Geographical mobility - Moved within same county (%)
Geographical mobility - Moved within same county (%) - White
Geographical mobility - Moved within same county (%) - Black or African American
Geographical mobility - Moved within same county (%) - Asian
Geographical mobility - Moved within same county (%) - Hispanic or Latino
Geographical mobility - Moved within same county (%) - American Indian and Alaska Native
Geographical mobility - Moved within same county (%) - Multirace
Geographical mobility - Moved within same county (%) - Other Race
Geographical mobility - Moved from different county within same state (%)
Geographical mobility - Moved from different county within same state (%) - White
Geographical mobility - Moved from different county within same state (%) - Black or African American
Geographical mobility - Moved from different county within same state (%) - Asian
Geographical mobility - Moved from different county within same state (%) - Hispanic or Latino
Geographical mobility - Moved from different county within same state (%) - American Indian and Alaska Native
Geographical mobility - Moved from different county within same state (%) - Multirace
Geographical mobility - Moved from different county within same state (%) - Other Race
Geographical mobility - Moved from different state (%)
Geographical mobility - Moved from different state (%) - White
Geographical mobility - Moved from different state (%) - Black or African American
Geographical mobility - Moved from different state (%) - Asian
Geographical mobility - Moved from different state (%) - Hispanic or Latino
Geographical mobility - Moved from different state (%) - American Indian and Alaska Native
Geographical mobility - Moved from different state (%) - Multirace
Geographical mobility - Moved from different state (%) - Other Race
Geographical mobility - Moved from abroad (%)
Geographical mobility - Moved from abroad (%) - White
Geographical mobility - Moved from abroad (%) - Black or African American
Geographical mobility - Moved from abroad (%) - Asian
Geographical mobility - Moved from abroad (%) - Hispanic or Latino
Geographical mobility - Moved from abroad (%) - American Indian and Alaska Native
Geographical mobility - Moved from abroad (%) - Multirace
Geographical mobility - Moved from abroad (%) - Other Race
Place of birth for the foreign-born population - Ireland (%)
Place of birth for the foreign-born population - Denmark (%)
Place of birth for the foreign-born population - Norway (%)
Place of birth for the foreign-born population - Sweden (%)
Place of birth for the foreign-born population - United Kingdom (%)
Place of birth for the foreign-born population - England (%)
Place of birth for the foreign-born population - Scotland (%)
Place of birth for the foreign-born population - Other Northern Europe (%)
Place of birth for the foreign-born population - Austria (%)
Place of birth for the foreign-born population - Belgium (%)
Place of birth for the foreign-born population - France (%)
Place of birth for the foreign-born population - Germany (%)
Place of birth for the foreign-born population - Netherlands (%)
Place of birth for the foreign-born population - Switzerland (%)
Place of birth for the foreign-born population - Other Western Europe (%)
Place of birth for the foreign-born population - Greece (%)
Place of birth for the foreign-born population - Italy (%)
Place of birth for the foreign-born population - Portugal (%)
Place of birth for the foreign-born population - Spain (%)
Place of birth for the foreign-born population - Other Southern Europe (%)
Place of birth for the foreign-born population - Albania (%)
Place of birth for the foreign-born population - Belarus (%)
Place of birth for the foreign-born population - Bosnia and Herzegovina (%)
Place of birth for the foreign-born population - Bulgaria (%)
Place of birth for the foreign-born population - Croatia (%)
Place of birth for the foreign-born population - Czechoslovakia (%)
Place of birth for the foreign-born population - Hungary (%)
Place of birth for the foreign-born population - Latvia (%)
Place of birth for the foreign-born population - Lithuania (%)
Place of birth for the foreign-born population - North Macedonia (Macedonia) (%)
Place of birth for the foreign-born population - Moldova (%)
Place of birth for the foreign-born population - Poland (%)
Place of birth for the foreign-born population - Romania (%)
Place of birth for the foreign-born population - Russia (%)
Place of birth for the foreign-born population - Serbia (%)
Place of birth for the foreign-born population - Ukraine (%)
Place of birth for the foreign-born population - Other Eastern Europe (%)
Place of birth for the foreign-born population - China (%)
Place of birth for the foreign-born population - Hong Kong (%)
Place of birth for the foreign-born population - Taiwan (%)
Place of birth for the foreign-born population - Japan (%)
Place of birth for the foreign-born population - Korea (%)
Place of birth for the foreign-born population - Other Eastern Asia (%)
Place of birth for the foreign-born population - Afghanistan (%)
Place of birth for the foreign-born population - Bangladesh (%)
Place of birth for the foreign-born population - India (%)
Place of birth for the foreign-born population - Iran (%)
Place of birth for the foreign-born population - Kazakhstan (%)
Place of birth for the foreign-born population - Nepal (%)
Place of birth for the foreign-born population - Pakistan (%)
Place of birth for the foreign-born population - Sri Lanka (%)
Place of birth for the foreign-born population - Uzbekistan (%)
Place of birth for the foreign-born population - Other South Central Asia (%)
Place of birth for the foreign-born population - Burma (%)
Place of birth for the foreign-born population - Cambodia (%)
Place of birth for the foreign-born population - Indonesia (%)
Place of birth for the foreign-born population - Laos (%)
Place of birth for the foreign-born population - Malaysia (%)
Place of birth for the foreign-born population - Philippines (%)
Place of birth for the foreign-born population - Singapore (%)
Place of birth for the foreign-born population - Thailand (%)
Place of birth for the foreign-born population - Vietnam (%)
Place of birth for the foreign-born population - Other South Eastern Asia (%)
Place of birth for the foreign-born population - Armenia (%)
Place of birth for the foreign-born population - Iraq (%)
Place of birth for the foreign-born population - Israel (%)
Place of birth for the foreign-born population - Jordan (%)
Place of birth for the foreign-born population - Kuwait (%)
Place of birth for the foreign-born population - Lebanon (%)
Place of birth for the foreign-born population - Saudi Arabia (%)
Place of birth for the foreign-born population - Syria (%)
Place of birth for the foreign-born population - Turkey (%)
Place of birth for the foreign-born population - Yemen (%)
Place of birth for the foreign-born population - Other Western Asia (%)
Place of birth for the foreign-born population - Eritrea (%)
Place of birth for the foreign-born population - Ethiopia (%)
Place of birth for the foreign-born population - Kenya (%)
Place of birth for the foreign-born population - Somalia (%)
Place of birth for the foreign-born population - Uganda (%)
Place of birth for the foreign-born population - Zimbabwe (%)
Place of birth for the foreign-born population - Other Eastern Africa (%)
Place of birth for the foreign-born population - Cameroon (%)
Place of birth for the foreign-born population - Congo (%)
Place of birth for the foreign-born population - Democratic Republic of Congo (Zaire) (%)
Place of birth for the foreign-born population - Other Middle Africa (%)
Place of birth for the foreign-born population - Egypt (%)
Place of birth for the foreign-born population - Morocco (%)
Place of birth for the foreign-born population - Sudan (%)
Place of birth for the foreign-born population - Other Northern Africa (%)
Place of birth for the foreign-born population - South Africa (%)
Place of birth for the foreign-born population - Other Southern Africa (%)
Place of birth for the foreign-born population - Cabo Verde (%)
Place of birth for the foreign-born population - Ghana (%)
Place of birth for the foreign-born population - Liberia (%)
Place of birth for the foreign-born population - Nigeria (%)
Place of birth for the foreign-born population - Senegal (%)
Place of birth for the foreign-born population - Sierra Leone (%)
Place of birth for the foreign-born population - Other Western Africa (%)
Place of birth for the foreign-born population - Australia (%)
Place of birth for the foreign-born population - New Zealand (%)
Place of birth for the foreign-born population - Fiji (%)
Place of birth for the foreign-born population - Micronesia (%)
Place of birth for the foreign-born population - Bahamas (%)
Place of birth for the foreign-born population - Barbados (%)
Place of birth for the foreign-born population - Cuba (%)
Place of birth for the foreign-born population - Dominica (%)
Place of birth for the foreign-born population - Dominican Republic (%)
Place of birth for the foreign-born population - Grenada (%)
Place of birth for the foreign-born population - Haiti (%)
Place of birth for the foreign-born population - Jamaica (%)
Place of birth for the foreign-born population - St. Vincent and the Grenadines (%)
Place of birth for the foreign-born population - Trinidad and Tobago (%)
Place of birth for the foreign-born population - West Indies (%)
Place of birth for the foreign-born population - Other Caribbean (%)
Place of birth for the foreign-born population - Belize (%)
Place of birth for the foreign-born population - Costa Rica (%)
Place of birth for the foreign-born population - El Salvador (%)
Place of birth for the foreign-born population - Guatemala (%)
Place of birth for the foreign-born population - Honduras (%)
Place of birth for the foreign-born population - Mexico (%)
Place of birth for the foreign-born population - Nicaragua (%)
Place of birth for the foreign-born population - Panama (%)
Place of birth for the foreign-born population - Other Central America (%)
Place of birth for the foreign-born population - Argentina (%)
Place of birth for the foreign-born population - Bolivia (%)
Place of birth for the foreign-born population - Brazil (%)
Place of birth for the foreign-born population - Chile (%)
Place of birth for the foreign-born population - Colombia (%)
Place of birth for the foreign-born population - Ecuador (%)
Place of birth for the foreign-born population - Guyana (%)
Place of birth for the foreign-born population - Peru (%)
Place of birth for the foreign-born population - Uruguay (%)
Place of birth for the foreign-born population - Venezuela (%)
Place of birth for the foreign-born population - Other South America (%)
Place of birth for the foreign-born population - Canada (%)
Place of birth for the foreign-born population - Other Northern America (%)
Place of birth for the foreign-born population - Other (%)
Latest news about races in Pleasantville, NJ collected exclusively by city-data.com from local newspapers, TV, and radio stations
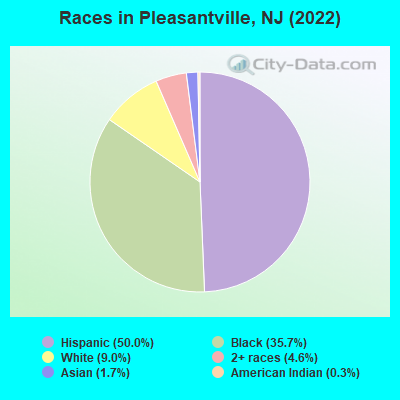
According to 2022 data, the most numerous races in Pleasantville, NJ are White alone (1,867 residents), Hispanic (10,327 residents), and Black alone (7,373 residents). 48.7% of Pleasantville residents speak English at home. 26.8% of Pleasantville, NJ residents are foreign-born (24.9% born in Latin America), which is 14.3% greater than the foreign-born rate of 23.0% across the entire state of New Jersey.
Race distribution in Pleasantville
2000 2022
5,557,209 66.0% White alone 1,117,191 13.3% Hispanic 1,096,171 13.0% Black alone 477,012 5.7% Asian alone 133,689 1.6% Two or more races 19,565 0.2% Other race alone 11,338 0.1% American Indian alone 2,175 0.03% Native Hawaiian and Other
4,766,476 51.5% White alone 2,028,470 21.9% Hispanic 1,111,632 12.0% Black alone 923,546 10.0% Asian alone 332,237 3.6% Two or more races 89,847 1.0% Other race alone 8,557 0.09% American Indian alone 934 0.01% Native Hawaiian and Other
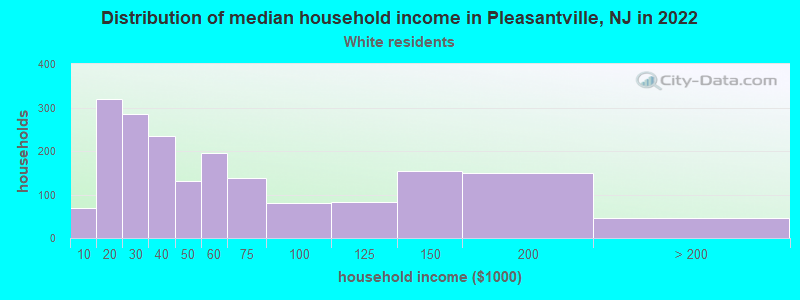
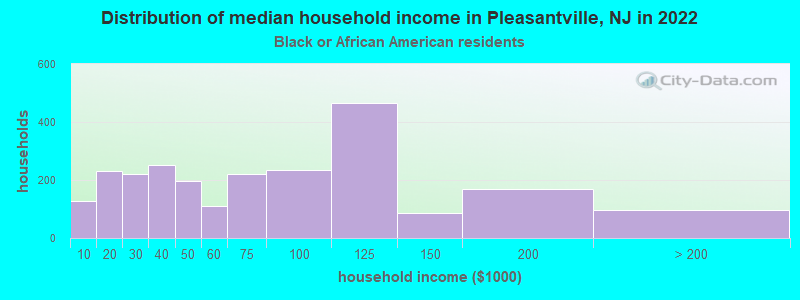
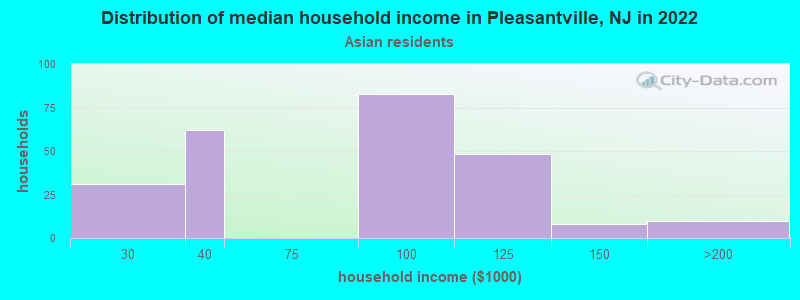
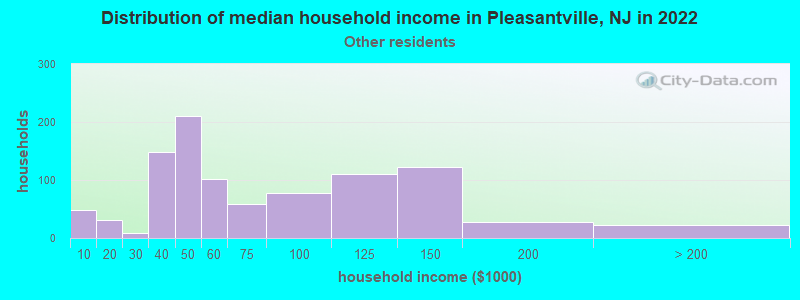
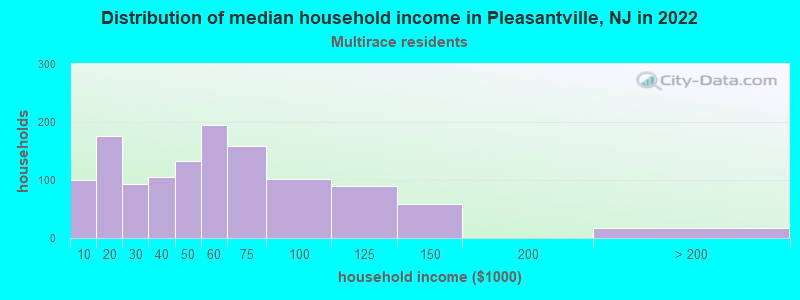
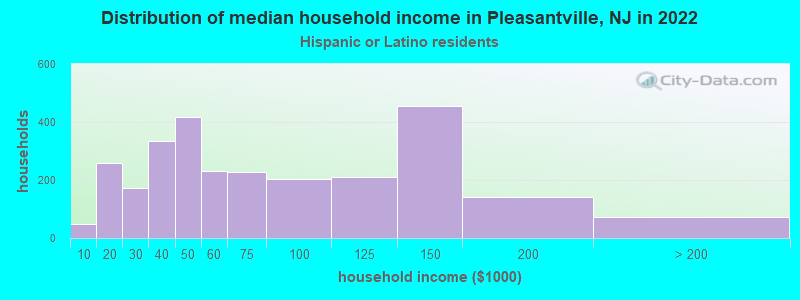
Income and house value in Pleasantville Median household income in 2022 $47,162 White non-Hispanic householders$61,001 Black householders$81,182 Asian householders$60,166 Some other race householders$60,318 Two or more races householders$59,494 Hispanic or Latino race householdersMedian 2022 house value $175,876 White Non-Hispanic householders$180,830 Black or African American householders$143,054 American Indian or Alaska Native householders $172,779 Asian householders$175,257 Some other race householders$170,302 Two or more races householders$176,495 Hispanic or Latino householders
Median age by race in Pleasantville
36.4 Median age for White residents30.8 39.6 39.2 Median age for Black or African American residents31.5 44.2 62.8 Median age for American Indian / Alaska Native residents-590,299,277.0 81.3 31.4 Median age for Asian residents29.3 33.8 -804,177,544.9 Median age for Native Hawaiian / Pacific Islander residents-860,335,194.7 -713,070,378.3 33.8 Median age for Other race residents39.0 28.6 35.9 Median age for Two or more races residents37.0 34.9 56.3 Median age for White alone residents33.1 58.9 30.8 Median age for Hispanic or Latino residents30.5 29.9
Owner/renter occupied households by race in Pleasantville
House owners and renters - White residents 847 47.4% Owner occupied939 52.6% Renter occupiedHouse owners and renters - Black or African American residents 1,044 44.6% Owner occupied1,298 55.4% Renter occupiedHouse owners and renters - American Indian / Alaska Native residents 33 100.0% Owner occupiedHouse owners and renters - Asian residents 88 45.3% Owner occupied107 54.7% Renter occupiedHouse owners and renters - Other race residents 502 46.5% Owner occupied576 53.5% Renter occupiedHouse owners and renters - Two or more races residents 574 45.4% Owner occupied691 54.6% Renter occupiedHouse owners and renters - White alone residents 340 39.3% Owner occupied525 60.7% Renter occupiedHouse owners and renters - Hispanic or Latino residents 1,367 49.3% Owner occupied1,408 50.7% Renter occupied
Language usage in Pleasantville
English speakers - Total 48.7% of residents of Pleasantville speak English at home.
40.7% of residents speak Spanish at home 3,393 43.9% Speak English very well4,337 56.1% Speak English less than very well8.9% of residents speak other language at home 958 56.5% Speak English very well737 43.5% Speak English less than very well
English speakers - Born in the United States 72.1% of residents of Pleasantville speak English at home.
22.8% of residents speak Spanish at home 533 86.2% Speak English very well85 13.8% Speak English less than very well0.7% of residents speak other language at home 19 100.0% Speak English very well
English speakers - Native, born elsewhere 0.8% of residents of Pleasantville speak English at home.
95.2% of residents speak Spanish at home 462 36.8% Speak English very well795 63.2% Speak English less than very well4.1% of residents speak other language at home 54 100.0% Speak English very well
English speakers - Foreign-born 4.9% of residents of Pleasantville speak English at home.
68.7% of residents speak Spanish at home 481 14.0% Speak English very well2,967 86.0% Speak English less than very well24.6% of residents speak other language at home 568 46.0% Speak English very well667 54.0% Speak English less than very well
White (Caucasian) - Speak only English Native:
61.5% (1,858)Foreign-born:
1.4% (14)
White (Caucasian) - Speak another language Native:
21.8% (658)Foreign-born:
95.6% (908)
Black or African American - Speak only English Native:
96.4% (5,718)Foreign-born:
13.7% (159)
Black or African American - Speak another language Native:
3.4% (201)Foreign-born:
87.5% (1,011)
American Indian / Alaska Native - Speak only English Native:
74.7% (39)Foreign-born:
47.6% (6)
Asian - Speak another language Native:
55.5% (135)Foreign-born:
99.4% (154)
Other race - Speak only English Native:
17.1% (341)Foreign-born:
2.8% (54)
Other race - Speak another language Native:
80.1% (1,596)Foreign-born:
95.7% (1,828)
Two or more races - Speak another language Native:
72.2% (2,495)Foreign-born:
94.7% (642)
White alone - Speak another language Native:
5.6% (99)Foreign-born:
100.0% (29)
Hispanic or Latino - Speak only English Native:
19.5% (1,067)Foreign-born:
2.5% (86)
Hispanic or Latino - Speak another language Native:
75.1% (4,102)Foreign-born:
96.5% (3,301)
Foreign-born residents in Pleasantville 5,545 residents are foreign born (24.9% Latin America ).
This city:
26.8%New Jersey:
23.2%
Marital status for residents in Pleasantville Marital status - White (Caucasian) population 15 years and over
Males 41.4% Never married38.8% Now married0.7% Separated1.4% Widowed17.6% DivorcedFemales 32.1% Never married31.7% Now married4.9% Separated15.0% Widowed16.2% DivorcedWomen who gave birth in the past 12 months Now married:
37.2% (49)Unmarried:
62.8% (83)
Women who did not give birth in the past 12 months Now married:
45.4% (420)Unmarried:
54.6% (504)
Marital status - Black or African American population 15 years and over
Males 50.9% Never married36.7% Now married2.4% Separated3.0% Widowed6.9% DivorcedFemales 49.3% Never married25.6% Now married3.2% Separated8.9% Widowed13.0% DivorcedWomen who gave birth in the past 12 months Now married:
0.0% (0)Unmarried:
100.0% (32)
Women who did not give birth in the past 12 months Now married:
25.4% (411)Unmarried:
74.6% (1,207)
Marital status - American Indian / Alaska Native population 15 years and over
Males 0.0% Never married86.4% Now married13.6% Separated0.0% Widowed0.0% DivorcedFemales 22.7% Never married77.3% Now married0.0% Separated0.0% Widowed0.0% DivorcedMarital status - Asian population 15 years and over
Males 64.0% Never married36.0% Now married0.0% Separated0.0% Widowed0.0% DivorcedFemales 30.0% Never married43.3% Now married0.0% Separated16.1% Widowed10.6% DivorcedWomen who did not give birth in the past 12 months Now married:
47.9% (72)Unmarried:
52.1% (78)
Marital status - Other race population 15 years and over
Males 41.3% Never married32.4% Now married7.1% Separated2.6% Widowed16.6% DivorcedFemales 31.2% Never married39.0% Now married12.4% Separated0.2% Widowed17.2% DivorcedWomen who gave birth in the past 12 months Now married:
98.9% (115)Unmarried:
1.1% (1)
Women who did not give birth in the past 12 months Now married:
43.7% (502)Unmarried:
56.3% (646)
Marital status - Two or more races population 15 years and over
Males 42.4% Never married36.7% Now married0.8% Separated6.5% Widowed13.6% DivorcedFemales 57.8% Never married22.2% Now married4.1% Separated4.3% Widowed11.6% DivorcedWomen who gave birth in the past 12 months Now married:
42.2% (56)Unmarried:
57.8% (77)
Women who did not give birth in the past 12 months Now married:
22.2% (368)Unmarried:
77.8% (1,292)
Marital status - White alone, not Hispanic / Latino population 15 years and over
Males 59.3% Never married26.5% Now married1.6% Separated0.0% Widowed12.5% DivorcedFemales 29.9% Never married25.1% Now married6.3% Separated23.3% Widowed15.5% DivorcedWomen who gave birth in the past 12 months Now married:
100.0% (20)Unmarried:
0.0% (0)
Women who did not give birth in the past 12 months Now married:
34.6% (70)Unmarried:
65.4% (132)
Marital status - Hispanic or Latino population 15 years and over
Males 39.8% Never married37.0% Now married3.1% Separated3.7% Widowed16.5% DivorcedFemales 38.6% Never married36.1% Now married7.1% Separated4.7% Widowed13.4% DivorcedWomen who gave birth in the past 12 months Now married:
59.4% (176)Unmarried:
40.6% (120)
Women who did not give birth in the past 12 months Now married:
40.8% (1,174)Unmarried:
59.2% (1,703)
Ancestries in Pleasantville
621 4.6% Haitian225 1.7% English123 0.9% African102 0.8% Ghanaian101 0.8% Kenyan98 0.7% Italian90 0.7% Irish87 0.6% Jamaican66 0.5% American44 0.3% U.S. Virgin Islander42 0.3% Guyanese35 0.3% Yugoslavian30 0.2% Trinidadian and Tobagonian29 0.2% Polish25 0.2% German12 0.09% French3 0.02% Romanian
Geographical mobility in Pleasantville Same house 1 year ago 4,110 88.5% White (Caucasian)7,297 95.6% Black or African American36 54.9% American Indian / Alaska Native278 76.9% Asian3,964 85.0% Other race3,983 94.4% Two or more races1,541 82.8% White alone, not Hispanic / Latino9,148 91.3% Hispanic or LatinoMoved within same county 357 7.7% White / Caucasian559 7.3% Black or African American40 62.4% American Indian / Alaska Native560 12.0% Other race109 2.6% Two or more races214 11.5% White alone, not Hispanic / Latino780 7.8% Hispanic or LatinoMoved within same state 4 0.1% White / Caucasian59 0.8% Black or African American1 0.1% White alone, not Hispanic / Latino1 0.0% Hispanic or LatinoMoved from different state 101 2.2% White / Caucasian131 36.1% Asian22 0.5% Other race267 6.3% Two or more races37 2.0% White alone, not Hispanic / Latino254 2.5% Hispanic or LatinoMoved from abroad 38 10.5% Asian10 0.2% Other race27 0.3% Hispanic or Latino
Children Nativity (place of birth) in Pleasantville
Children under 6 years - Living with two parents Both parents native 409 100.0% NativeBoth parents foreign-born 240 96.4% Native9 3.6% Foreign-bornOne native, one foreign-born parent 43 100.0% NativeChildren under 6 years - Living with one parent Native parent 612 100.0% NativeForeign-born parent 339 100.0% NativeChildren 6 to 17 years - Living with two parents Both parents native 626 100.0% NativeBoth parents foreign-born 673 84.2% Native126 15.8% Foreign-bornOne native, one foreign-born parent 186 100.0% NativeChildren 6 to 17 years - Living with one parent Native parent 770 100.0% NativeForeign-born parent 760 51.9% Native705 48.1% Foreign-born
Grandparents responsible for own grandchildren in Pleasantville
Grandparents (30 to 59 years) White / Caucasian 18 29.5% Responsible for grandchildren42 70.5% Not responsible for grandchildrenBlack or African American 95 51.5% Responsible for grandchildren89 48.5% Not responsible for grandchildrenOther race 27 40.3% Responsible for grandchildren40 59.7% Not responsible for grandchildrenTwo or more races 16 35.0% Responsible for grandchildren30 65.0% Not responsible for grandchildrenWhite alone, not Hispanic / Latino 21 76.8% Responsible for grandchildren6 23.2% Not responsible for grandchildrenHispanic or Latino 33 23.1% Responsible for grandchildren111 76.9% Not responsible for grandchildrenGrandparents (60 years and over) Black or African American 64 87.6% Responsible for grandchildren9 12.4% Not responsible for grandchildrenOther race 174 100.0% Not responsible for grandchildrenHispanic or Latino 148 100.0% Not responsible for grandchildren