Races in Pleasant Grove, Utah (UT) Detailed Stats
Data:
Races - White alone (%)
Races - White alone (% change since 2000)
Races - Black alone (%)
Races - Black alone (% change since 2000)
Races - American Indian alone (%)
Races - American Indian alone (% change since 2000)
Races - Asian alone (%)
Races - Asian alone (% change since 2000)
Races - Hispanic (%)
Races - Hispanic (% change since 2000)
Races - Native Hawaiian and Other Pacific Islander alone (%)
Races - Native Hawaiian and Other Pacific Islander alone (% change since 2000)
Races - Two or more races(%)
Races - Two or more races(% change since 2000)
Races - Other race alone (%)
Races - Other race alone (% change since 2000)
Racial diversity
Place of birth - Born in state of residence (%)
Place of birth - Born in state of residence (%) - White
Place of birth - Born in state of residence (%) - Black or African American
Place of birth - Born in state of residence (%) - Asian
Place of birth - Born in state of residence (%) - Hispanic or Latino
Place of birth - Born in state of residence (%) - American Indian and Alaska Native
Place of birth - Born in state of residence (%) - Multirace
Place of birth - Born in state of residence (%) - Other Race
Place of birth - Born in other state (%)
Place of birth - Born in other state (%) - White
Place of birth - Born in other state (%) - Black or African American
Place of birth - Born in other state (%) - Asian
Place of birth - Born in other state (%) - Hispanic or Latino
Place of birth - Born in other state (%) - American Indian and Alaska Native
Place of birth - Born in other state (%) - Multirace
Place of birth - Born in other state (%) - Other Race
Place of birth - Native, outside of US (%)
Place of birth - Native, outside of US (%) - White
Place of birth - Native, outside of US (%) - Black or African American
Place of birth - Native, outside of US (%) - Asian
Place of birth - Native, outside of US (%) - Hispanic or Latino
Place of birth - Native, outside of US (%) - American Indian and Alaska Native
Place of birth - Native, outside of US (%) - Multirace
Place of birth - Native, outside of US (%) - Other Race
Place of birth - Foreign born (%)
Place of birth - Foreign born (%) - White
Place of birth - Foreign born (%) - Black or African American
Place of birth - Foreign born (%) - Asian
Place of birth - Foreign born (%) - Hispanic or Latino
Place of birth - Foreign born (%) - American Indian and Alaska Native
Place of birth - Foreign born (%) - Multirace
Place of birth - Foreign born (%) - Other Race
Residents speaking English at home (%)
Residents speaking English at home - Born in the United States (%)
Residents speaking English at home - Native, born elsewhere (%)
Residents speaking English at home - Foreign born (%)
Residents speaking Spanish at home (%)
Residents speaking Spanish at home - Born in the United States (%)
Residents speaking Spanish at home - Native, born elsewhere (%)
Residents speaking Spanish at home - Foreign born (%)
Residents speaking other language at home (%)
Residents speaking other language at home - Born in the United States (%)
Residents speaking other language at home - Native, born elsewhere (%)
Residents speaking other language at home - Foreign born (%)
Marital status - Never married (%)
Marital status - Now married (%)
Marital status - Separated (%)
Marital status - Widowed (%)
Marital status - Divorced (%)
Ancestries Reported - Arab (%)
Ancestries Reported - Czech (%)
Ancestries Reported - Danish (%)
Ancestries Reported - Dutch (%)
Ancestries Reported - English (%)
Ancestries Reported - French (%)
Ancestries Reported - French Canadian (%)
Ancestries Reported - German (%)
Ancestries Reported - Greek (%)
Ancestries Reported - Hungarian (%)
Ancestries Reported - Irish (%)
Ancestries Reported - Italian (%)
Ancestries Reported - Lithuanian (%)
Ancestries Reported - Norwegian (%)
Ancestries Reported - Polish (%)
Ancestries Reported - Portuguese (%)
Ancestries Reported - Russian (%)
Ancestries Reported - Scotch-Irish (%)
Ancestries Reported - Scottish (%)
Ancestries Reported - Slovak (%)
Ancestries Reported - Subsaharan African (%)
Ancestries Reported - Swedish (%)
Ancestries Reported - Swiss (%)
Ancestries Reported - Ukrainian (%)
Ancestries Reported - United States (%)
Ancestries Reported - Welsh (%)
Ancestries Reported - West Indian (%)
Ancestries Reported - Other (%)
Geographical mobility - Same house 1 year ago (%)
Geographical mobility - Same house 1 year ago (%) - White
Geographical mobility - Same house 1 year ago (%) - Black or African American
Geographical mobility - Same house 1 year ago (%) - Asian
Geographical mobility - Same house 1 year ago (%) - Hispanic or Latino
Geographical mobility - Same house 1 year ago (%) - American Indian and Alaska Native
Geographical mobility - Same house 1 year ago (%) - Multirace
Geographical mobility - Same house 1 year ago (%) - Other Race
Geographical mobility - Moved within same county (%)
Geographical mobility - Moved within same county (%) - White
Geographical mobility - Moved within same county (%) - Black or African American
Geographical mobility - Moved within same county (%) - Asian
Geographical mobility - Moved within same county (%) - Hispanic or Latino
Geographical mobility - Moved within same county (%) - American Indian and Alaska Native
Geographical mobility - Moved within same county (%) - Multirace
Geographical mobility - Moved within same county (%) - Other Race
Geographical mobility - Moved from different county within same state (%)
Geographical mobility - Moved from different county within same state (%) - White
Geographical mobility - Moved from different county within same state (%) - Black or African American
Geographical mobility - Moved from different county within same state (%) - Asian
Geographical mobility - Moved from different county within same state (%) - Hispanic or Latino
Geographical mobility - Moved from different county within same state (%) - American Indian and Alaska Native
Geographical mobility - Moved from different county within same state (%) - Multirace
Geographical mobility - Moved from different county within same state (%) - Other Race
Geographical mobility - Moved from different state (%)
Geographical mobility - Moved from different state (%) - White
Geographical mobility - Moved from different state (%) - Black or African American
Geographical mobility - Moved from different state (%) - Asian
Geographical mobility - Moved from different state (%) - Hispanic or Latino
Geographical mobility - Moved from different state (%) - American Indian and Alaska Native
Geographical mobility - Moved from different state (%) - Multirace
Geographical mobility - Moved from different state (%) - Other Race
Geographical mobility - Moved from abroad (%)
Geographical mobility - Moved from abroad (%) - White
Geographical mobility - Moved from abroad (%) - Black or African American
Geographical mobility - Moved from abroad (%) - Asian
Geographical mobility - Moved from abroad (%) - Hispanic or Latino
Geographical mobility - Moved from abroad (%) - American Indian and Alaska Native
Geographical mobility - Moved from abroad (%) - Multirace
Geographical mobility - Moved from abroad (%) - Other Race
Place of birth for the foreign-born population - Ireland (%)
Place of birth for the foreign-born population - Denmark (%)
Place of birth for the foreign-born population - Norway (%)
Place of birth for the foreign-born population - Sweden (%)
Place of birth for the foreign-born population - United Kingdom (%)
Place of birth for the foreign-born population - England (%)
Place of birth for the foreign-born population - Scotland (%)
Place of birth for the foreign-born population - Other Northern Europe (%)
Place of birth for the foreign-born population - Austria (%)
Place of birth for the foreign-born population - Belgium (%)
Place of birth for the foreign-born population - France (%)
Place of birth for the foreign-born population - Germany (%)
Place of birth for the foreign-born population - Netherlands (%)
Place of birth for the foreign-born population - Switzerland (%)
Place of birth for the foreign-born population - Other Western Europe (%)
Place of birth for the foreign-born population - Greece (%)
Place of birth for the foreign-born population - Italy (%)
Place of birth for the foreign-born population - Portugal (%)
Place of birth for the foreign-born population - Spain (%)
Place of birth for the foreign-born population - Other Southern Europe (%)
Place of birth for the foreign-born population - Albania (%)
Place of birth for the foreign-born population - Belarus (%)
Place of birth for the foreign-born population - Bosnia and Herzegovina (%)
Place of birth for the foreign-born population - Bulgaria (%)
Place of birth for the foreign-born population - Croatia (%)
Place of birth for the foreign-born population - Czechoslovakia (%)
Place of birth for the foreign-born population - Hungary (%)
Place of birth for the foreign-born population - Latvia (%)
Place of birth for the foreign-born population - Lithuania (%)
Place of birth for the foreign-born population - North Macedonia (Macedonia) (%)
Place of birth for the foreign-born population - Moldova (%)
Place of birth for the foreign-born population - Poland (%)
Place of birth for the foreign-born population - Romania (%)
Place of birth for the foreign-born population - Russia (%)
Place of birth for the foreign-born population - Serbia (%)
Place of birth for the foreign-born population - Ukraine (%)
Place of birth for the foreign-born population - Other Eastern Europe (%)
Place of birth for the foreign-born population - China (%)
Place of birth for the foreign-born population - Hong Kong (%)
Place of birth for the foreign-born population - Taiwan (%)
Place of birth for the foreign-born population - Japan (%)
Place of birth for the foreign-born population - Korea (%)
Place of birth for the foreign-born population - Other Eastern Asia (%)
Place of birth for the foreign-born population - Afghanistan (%)
Place of birth for the foreign-born population - Bangladesh (%)
Place of birth for the foreign-born population - India (%)
Place of birth for the foreign-born population - Iran (%)
Place of birth for the foreign-born population - Kazakhstan (%)
Place of birth for the foreign-born population - Nepal (%)
Place of birth for the foreign-born population - Pakistan (%)
Place of birth for the foreign-born population - Sri Lanka (%)
Place of birth for the foreign-born population - Uzbekistan (%)
Place of birth for the foreign-born population - Other South Central Asia (%)
Place of birth for the foreign-born population - Burma (%)
Place of birth for the foreign-born population - Cambodia (%)
Place of birth for the foreign-born population - Indonesia (%)
Place of birth for the foreign-born population - Laos (%)
Place of birth for the foreign-born population - Malaysia (%)
Place of birth for the foreign-born population - Philippines (%)
Place of birth for the foreign-born population - Singapore (%)
Place of birth for the foreign-born population - Thailand (%)
Place of birth for the foreign-born population - Vietnam (%)
Place of birth for the foreign-born population - Other South Eastern Asia (%)
Place of birth for the foreign-born population - Armenia (%)
Place of birth for the foreign-born population - Iraq (%)
Place of birth for the foreign-born population - Israel (%)
Place of birth for the foreign-born population - Jordan (%)
Place of birth for the foreign-born population - Kuwait (%)
Place of birth for the foreign-born population - Lebanon (%)
Place of birth for the foreign-born population - Saudi Arabia (%)
Place of birth for the foreign-born population - Syria (%)
Place of birth for the foreign-born population - Turkey (%)
Place of birth for the foreign-born population - Yemen (%)
Place of birth for the foreign-born population - Other Western Asia (%)
Place of birth for the foreign-born population - Eritrea (%)
Place of birth for the foreign-born population - Ethiopia (%)
Place of birth for the foreign-born population - Kenya (%)
Place of birth for the foreign-born population - Somalia (%)
Place of birth for the foreign-born population - Uganda (%)
Place of birth for the foreign-born population - Zimbabwe (%)
Place of birth for the foreign-born population - Other Eastern Africa (%)
Place of birth for the foreign-born population - Cameroon (%)
Place of birth for the foreign-born population - Congo (%)
Place of birth for the foreign-born population - Democratic Republic of Congo (Zaire) (%)
Place of birth for the foreign-born population - Other Middle Africa (%)
Place of birth for the foreign-born population - Egypt (%)
Place of birth for the foreign-born population - Morocco (%)
Place of birth for the foreign-born population - Sudan (%)
Place of birth for the foreign-born population - Other Northern Africa (%)
Place of birth for the foreign-born population - South Africa (%)
Place of birth for the foreign-born population - Other Southern Africa (%)
Place of birth for the foreign-born population - Cabo Verde (%)
Place of birth for the foreign-born population - Ghana (%)
Place of birth for the foreign-born population - Liberia (%)
Place of birth for the foreign-born population - Nigeria (%)
Place of birth for the foreign-born population - Senegal (%)
Place of birth for the foreign-born population - Sierra Leone (%)
Place of birth for the foreign-born population - Other Western Africa (%)
Place of birth for the foreign-born population - Australia (%)
Place of birth for the foreign-born population - New Zealand (%)
Place of birth for the foreign-born population - Fiji (%)
Place of birth for the foreign-born population - Micronesia (%)
Place of birth for the foreign-born population - Bahamas (%)
Place of birth for the foreign-born population - Barbados (%)
Place of birth for the foreign-born population - Cuba (%)
Place of birth for the foreign-born population - Dominica (%)
Place of birth for the foreign-born population - Dominican Republic (%)
Place of birth for the foreign-born population - Grenada (%)
Place of birth for the foreign-born population - Haiti (%)
Place of birth for the foreign-born population - Jamaica (%)
Place of birth for the foreign-born population - St. Vincent and the Grenadines (%)
Place of birth for the foreign-born population - Trinidad and Tobago (%)
Place of birth for the foreign-born population - West Indies (%)
Place of birth for the foreign-born population - Other Caribbean (%)
Place of birth for the foreign-born population - Belize (%)
Place of birth for the foreign-born population - Costa Rica (%)
Place of birth for the foreign-born population - El Salvador (%)
Place of birth for the foreign-born population - Guatemala (%)
Place of birth for the foreign-born population - Honduras (%)
Place of birth for the foreign-born population - Mexico (%)
Place of birth for the foreign-born population - Nicaragua (%)
Place of birth for the foreign-born population - Panama (%)
Place of birth for the foreign-born population - Other Central America (%)
Place of birth for the foreign-born population - Argentina (%)
Place of birth for the foreign-born population - Bolivia (%)
Place of birth for the foreign-born population - Brazil (%)
Place of birth for the foreign-born population - Chile (%)
Place of birth for the foreign-born population - Colombia (%)
Place of birth for the foreign-born population - Ecuador (%)
Place of birth for the foreign-born population - Guyana (%)
Place of birth for the foreign-born population - Peru (%)
Place of birth for the foreign-born population - Uruguay (%)
Place of birth for the foreign-born population - Venezuela (%)
Place of birth for the foreign-born population - Other South America (%)
Place of birth for the foreign-born population - Canada (%)
Place of birth for the foreign-born population - Other Northern America (%)
Place of birth for the foreign-born population - Other (%)
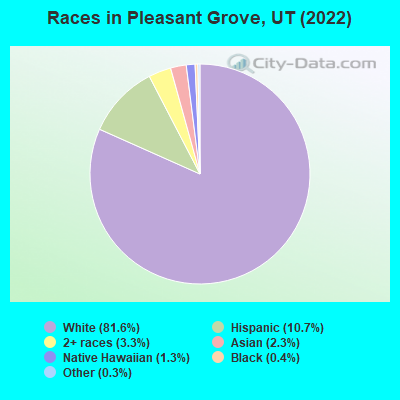
According to 2022 data, the most numerous races in Pleasant Grove, UT are White alone (32,227 residents), Hispanic (4,232 residents), and Two or more races (1,310 residents). 88.4% of Pleasant Grove residents speak English at home. 5.7% of Pleasant Grove, UT residents are foreign-born (3.8% born in Latin America, 0.8% born in Asia), which is 39.5% less than the foreign-born rate of 8.0% across the entire state of Utah.
Race distribution in Pleasant Grove
2000 2022
1,904,265 85.3% White alone 201,559 9.0% Hispanic 36,483 1.6% Asian alone 31,308 1.4% Two or more races 26,663 1.2% American Indian alone 14,806 0.7% Native Hawaiian and Other 16,137 0.7% Black alone 1,948 0.09% Other race alone
2,557,466 75.6% White alone 512,086 15.1% Hispanic 119,308 3.5% Two or more races 82,388 2.4% Asian alone 36,978 1.1% Native Hawaiian and Other 34,873 1.0% Black alone 22,803 0.7% American Indian alone 14,898 0.4% Other race alone
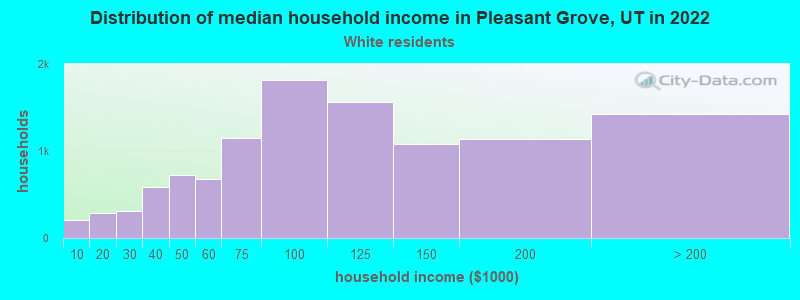
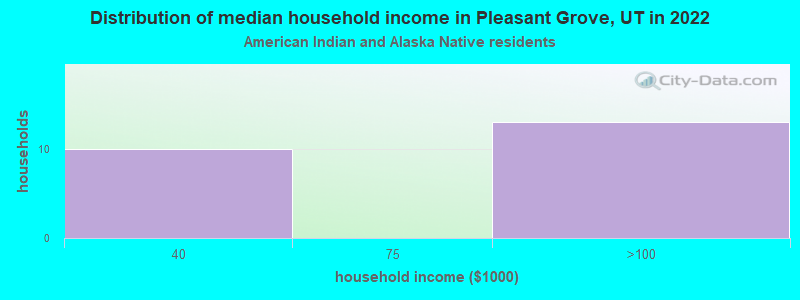
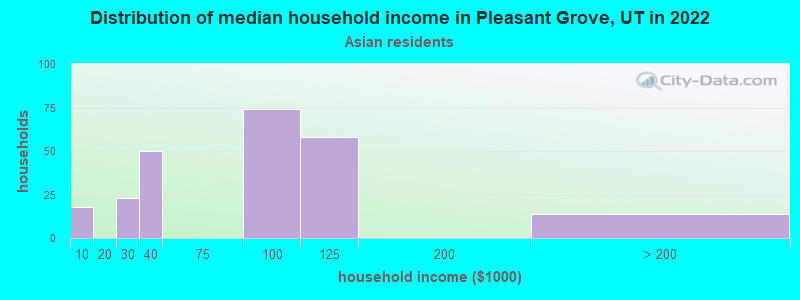
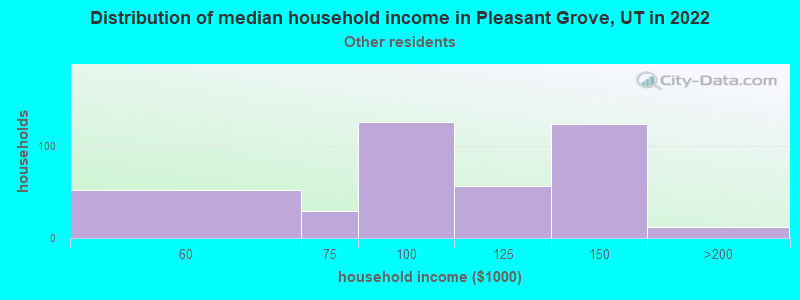
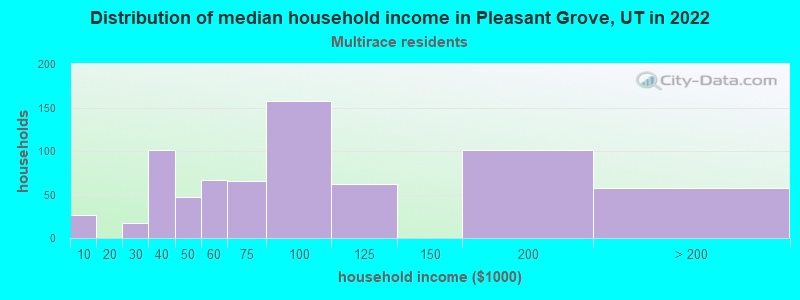
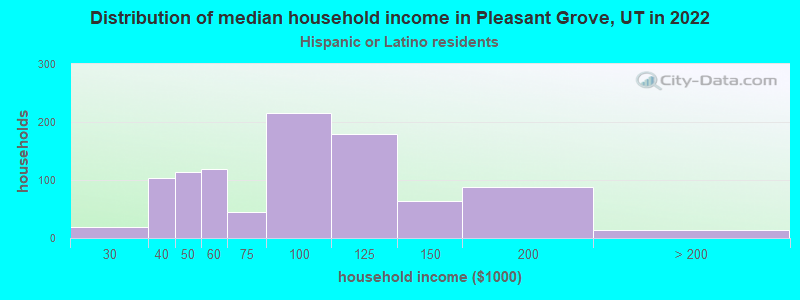
Income and house value in Pleasant Grove Median household income in 2022 $96,225 White non-Hispanic householders$125,487 Asian householders$104,294 Some other race householders$77,223 Two or more races householders$99,361 Hispanic or Latino race householdersMedian 2022 house value $520,507 White Non-Hispanic householders$443,395 Some other race householders$432,792 Two or more races householders$475,846 Hispanic or Latino householders
Median age by race in Pleasant Grove
28.8 Median age for White residents28.6 29.4 13.4 Median age for Black or African American residents5.6 15.0 27.8 Median age for American Indian / Alaska Native residents27.1 25.8 27.1 Median age for Asian residents24.9 45.7 24.2 Median age for Native Hawaiian / Pacific Islander residents31.9 23.2 26.4 Median age for Other race residents25.7 30.2 21.8 Median age for Two or more races residents22.8 19.5 29.2 Median age for White alone residents28.7 29.6 25.8 Median age for Hispanic or Latino residents26.4 25.3
Owner/renter occupied households by race in Pleasant Grove
House owners and renters - White residents 7,579 68.9% Owner occupied3,416 31.1% Renter occupiedHouse owners and renters - American Indian / Alaska Native residents 13 67.8% Owner occupied6 32.2% Renter occupiedHouse owners and renters - Asian residents 129 53.0% Owner occupied114 47.0% Renter occupiedHouse owners and renters - Native Hawaiian / Pacific Islander residents 96 76.5% Owner occupied30 23.5% Renter occupiedHouse owners and renters - Other race residents 261 63.4% Owner occupied151 36.6% Renter occupiedHouse owners and renters - Two or more races residents 308 45.4% Owner occupied370 54.6% Renter occupiedHouse owners and renters - White alone residents 7,494 68.7% Owner occupied3,413 31.3% Renter occupiedHouse owners and renters - Hispanic or Latino residents 584 62.7% Owner occupied347 37.3% Renter occupied
Language usage in Pleasant Grove
English speakers - Total 88.4% of residents of Pleasant Grove speak English at home.
8.1% of residents speak Spanish at home 1,730 58.9% Speak English very well1,209 41.1% Speak English less than very well3.4% of residents speak other language at home 1,052 85.6% Speak English very well177 14.4% Speak English less than very well
English speakers - Born in the United States 87.7% of residents of Pleasant Grove speak English at home.
7.4% of residents speak Spanish at home 675 84.2% Speak English very well127 15.8% Speak English less than very well5.0% of residents speak other language at home 524 96.3% Speak English very well20 3.7% Speak English less than very well
English speakers - Native, born elsewhere 77.0% of residents of Pleasant Grove speak English at home.
18.7% of residents speak Spanish at home 37 71.2% Speak English very well15 28.8% Speak English less than very well
English speakers - Foreign-born 21.6% of residents of Pleasant Grove speak English at home.
59.0% of residents speak Spanish at home 584 40.8% Speak English very well849 59.2% Speak English less than very well18.3% of residents speak other language at home 319 71.7% Speak English very well126 28.3% Speak English less than very well
White (Caucasian) - Speak only English Native:
98.2% (29,279)Foreign-born:
45.2% (182)
White (Caucasian) - Speak another language Native:
2.6% (763)Foreign-born:
58.3% (234)
Black or African American - Speak only English Native:
94.7% (107)Foreign-born:
49.6% (26)
Black or African American - Speak another language Native:
5.4% (6)Foreign-born:
17.0% (9)
American Indian / Alaska Native - Speak another language Native:
76.3% (50)Foreign-born:
96.1% (25)
Asian - Speak only English Native:
22.7% (113)Foreign-born:
54.1% (193)
Asian - Speak another language Native:
84.8% (423)Foreign-born:
51.2% (183)
Native Hawaiian / Pacific Islander - Speak only English Native:
90.8% (207)Foreign-born:
33.0% (61)
Native Hawaiian / Pacific Islander - Speak another language Native:
12.4% (28)Foreign-born:
66.6% (124)
Other race - Speak only English Native:
21.1% (204)Foreign-born:
4.6% (37)
Other race - Speak another language Native:
82.1% (793)Foreign-born:
95.2% (773)
Two or more races - Speak only English Native:
72.2% (1,449)Foreign-born:
1.6% (11)
Two or more races - Speak another language Native:
27.5% (552)Foreign-born:
98.6% (651)
White alone - Speak only English Native:
97.5% (28,803)Foreign-born:
69.1% (171)
White alone - Speak another language Native:
2.6% (766)Foreign-born:
33.1% (82)
Hispanic or Latino - Speak only English Native:
55.5% (1,227)Foreign-born:
3.7% (56)
Hispanic or Latino - Speak another language Native:
44.5% (983)Foreign-born:
96.2% (1,469)
Foreign-born residents in Pleasant Grove 2,266 residents are foreign born (3.8% Latin America , 0.8% Asia ).
Marital status for residents in Pleasant Grove Marital status - White (Caucasian) population 15 years and over
Males 30.1% Never married60.4% Now married0.7% Separated2.3% Widowed6.5% DivorcedFemales 24.0% Never married62.6% Now married1.1% Separated4.8% Widowed7.4% DivorcedWomen who gave birth in the past 12 months Now married:
94.4% (737)Unmarried:
5.6% (44)
Women who did not give birth in the past 12 months Now married:
57.1% (4,120)Unmarried:
42.9% (3,091)
Marital status - Black or African American population 15 years and over
Males 91.2% Never married8.8% Now married0.0% Separated0.0% Widowed0.0% DivorcedFemales 66.7% Never married33.3% Now married0.0% Separated0.0% Widowed0.0% DivorcedWomen who did not give birth in the past 12 months Now married:
20.7% (7)Unmarried:
79.3% (25)
Marital status - American Indian / Alaska Native population 15 years and over
Males 64.8% Never married35.2% Now married0.0% Separated0.0% Widowed0.0% DivorcedFemales 34.5% Never married65.5% Now married0.0% Separated0.0% Widowed0.0% DivorcedWomen who did not give birth in the past 12 months Now married:
65.5% (21)Unmarried:
34.5% (11)
Marital status - Asian population 15 years and over
Males 56.0% Never married44.0% Now married0.0% Separated0.0% Widowed0.0% DivorcedFemales 6.9% Never married81.2% Now married0.0% Separated11.9% Widowed0.0% DivorcedWomen who gave birth in the past 12 months Now married:
100.0% (8)Unmarried:
0.0% (0)
Women who did not give birth in the past 12 months Now married:
90.8% (290)Unmarried:
9.2% (29)
Marital status - Native Hawaiian / Pacific Islander population 15 years and over
Males 34.6% Never married65.4% Now married0.0% Separated0.0% Widowed0.0% DivorcedFemales 32.9% Never married67.1% Now married0.0% Separated0.0% Widowed0.0% DivorcedWomen who gave birth in the past 12 months Now married:
100.0% (16)Unmarried:
0.0% (0)
Women who did not give birth in the past 12 months Now married:
46.2% (71)Unmarried:
53.8% (82)
Marital status - Other race population 15 years and over
Males 39.4% Never married59.0% Now married0.0% Separated0.0% Widowed1.6% DivorcedFemales 28.1% Never married69.0% Now married0.0% Separated2.9% Widowed0.0% DivorcedWomen who did not give birth in the past 12 months Now married:
54.3% (207)Unmarried:
45.7% (175)
Marital status - Two or more races population 15 years and over
Males 44.9% Never married52.5% Now married0.0% Separated0.5% Widowed2.1% DivorcedFemales 18.8% Never married66.2% Now married0.0% Separated6.8% Widowed8.2% DivorcedWomen who gave birth in the past 12 months Now married:
100.0% (62)Unmarried:
0.0% (0)
Women who did not give birth in the past 12 months Now married:
66.8% (371)Unmarried:
33.2% (184)
Marital status - White alone, not Hispanic / Latino population 15 years and over
Males 29.8% Never married60.5% Now married0.8% Separated2.2% Widowed6.6% DivorcedFemales 23.7% Never married63.3% Now married1.2% Separated4.6% Widowed7.2% DivorcedWomen who gave birth in the past 12 months Now married:
94.4% (760)Unmarried:
5.6% (45)
Women who did not give birth in the past 12 months Now married:
57.3% (4,083)Unmarried:
42.7% (3,047)
Marital status - Hispanic or Latino population 15 years and over
Males 41.4% Never married54.8% Now married0.0% Separated0.9% Widowed2.9% DivorcedFemales 27.2% Never married59.2% Now married0.0% Separated6.9% Widowed6.6% DivorcedWomen who gave birth in the past 12 months Now married:
100.0% (11)Unmarried:
0.0% (0)
Women who did not give birth in the past 12 months Now married:
60.9% (542)Unmarried:
39.1% (348)
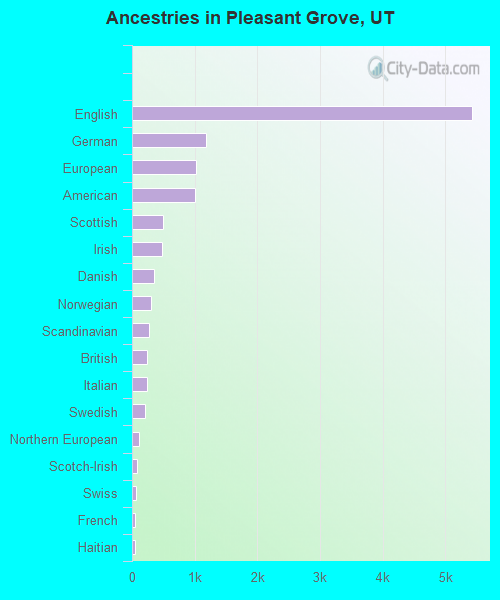
Ancestries in Pleasant Grove
5,426 32.0% English1,184 7.0% German1,021 6.0% European1,007 5.9% American492 2.9% Scottish472 2.8% Irish348 2.1% Danish299 1.8% Norwegian276 1.6% Scandinavian240 1.4% British238 1.4% Italian210 1.2% Swedish113 0.7% Northern European80 0.5% Scotch-Irish66 0.4% Swiss52 0.3% French51 0.3% Haitian47 0.3% Dutch43 0.3% Welsh36 0.2% Russian27 0.2% Estonian23 0.1% Icelander22 0.1% Polish20 0.1% Slavic19 0.1% Canadian19 0.1% Brazilian15 0.09% Armenian13 0.08% Hungarian10 0.06% Czech8 0.05% Moroccan7 0.04% Iranian6 0.04% Basque4 0.02% Romanian3 0.02% French Canadian3 0.02% African
Geographical mobility in Pleasant Grove Same house 1 year ago 27,533 86.1% White (Caucasian)150 100.0% Black or African American37 42.3% American Indian / Alaska Native398 44.4% Asian377 90.7% Native Hawaiian / Pacific Islander1,556 78.5% Other race2,672 84.0% Two or more races27,185 85.9% White alone, not Hispanic / Latino3,492 83.3% Hispanic or LatinoMoved within same county 2,776 8.7% White / Caucasian2 1.5% Black or African American4 4.5% American Indian / Alaska Native412 45.9% Asian13 3.1% Native Hawaiian / Pacific Islander374 18.9% Other race468 14.7% Two or more races2,815 8.9% White alone, not Hispanic / Latino561 13.4% Hispanic or LatinoMoved within same state 1,205 3.8% White / Caucasian13 15.4% American Indian / Alaska Native27 3.0% Asian25 1.2% Other race25 0.8% Two or more races1,139 3.6% White alone, not Hispanic / Latino117 2.8% Hispanic or LatinoMoved from different state 614 1.9% White / Caucasian19 22.1% American Indian / Alaska Native71 7.9% Asian37 1.9% Other race7 0.2% Two or more races634 2.0% White alone, not Hispanic / Latino12 0.3% Hispanic or LatinoMoved from abroad 30 0.1% White18 20.2% American Indian / Alaska Native31 1.0% Two or more races27 0.1% White alone, not Hispanic / Latino47 1.1% Hispanic or Latino
Children Nativity (place of birth) in Pleasant Grove
Children under 6 years - Living with two parents Both parents native 3,132 100.0% NativeBoth parents foreign-born 119 100.0% NativeOne native, one foreign-born parent 263 100.0% NativeChildren under 6 years - Living with one parent Native parent 436 100.0% NativeForeign-born parent 5 100.0% Foreign-bornChildren 6 to 17 years - Living with two parents Both parents native 5,552 99.7% Native17 0.3% Foreign-bornBoth parents foreign-born 287 80.0% Native72 20.0% Foreign-bornOne native, one foreign-born parent 532 88.6% Native68 11.4% Foreign-bornChildren 6 to 17 years - Living with one parent Native parent 1,281 100.0% NativeForeign-born parent 35 49.5% Native36 50.5% Foreign-born
Grandparents responsible for own grandchildren in Pleasant Grove
Grandparents (30 to 59 years) White / Caucasian 16 11.6% Responsible for grandchildren120 88.4% Not responsible for grandchildrenAsian 5 100.0% Not responsible for grandchildrenNative Hawaiian / Pacific Islander 56 100.0% Responsible for grandchildrenOther race 10 100.0% Not responsible for grandchildrenTwo or more races 11 16.3% Responsible for grandchildren55 83.7% Not responsible for grandchildrenWhite alone, not Hispanic / Latino 17 11.0% Responsible for grandchildren138 89.0% Not responsible for grandchildrenHispanic or Latino 4 7.3% Responsible for grandchildren48 92.7% Not responsible for grandchildrenGrandparents (60 years and over) White / Caucasian 42 17.7% Responsible for grandchildren193 82.3% Not responsible for grandchildrenNative Hawaiian / Pacific Islander 21 100.0% Responsible for grandchildrenTwo or more races 32 100.0% Not responsible for grandchildrenWhite alone, not Hispanic / Latino 43 17.3% Responsible for grandchildren205 82.7% Not responsible for grandchildrenHispanic or Latino 21 100.0% Not responsible for grandchildren