Races in Plantation, Florida (FL) Detailed Stats
Data:
Races - White alone (%)
Races - White alone (% change since 2000)
Races - Black alone (%)
Races - Black alone (% change since 2000)
Races - American Indian alone (%)
Races - American Indian alone (% change since 2000)
Races - Asian alone (%)
Races - Asian alone (% change since 2000)
Races - Hispanic (%)
Races - Hispanic (% change since 2000)
Races - Native Hawaiian and Other Pacific Islander alone (%)
Races - Native Hawaiian and Other Pacific Islander alone (% change since 2000)
Races - Two or more races(%)
Races - Two or more races(% change since 2000)
Races - Other race alone (%)
Races - Other race alone (% change since 2000)
Racial diversity
Place of birth - Born in state of residence (%)
Place of birth - Born in state of residence (%) - White
Place of birth - Born in state of residence (%) - Black or African American
Place of birth - Born in state of residence (%) - Asian
Place of birth - Born in state of residence (%) - Hispanic or Latino
Place of birth - Born in state of residence (%) - American Indian and Alaska Native
Place of birth - Born in state of residence (%) - Multirace
Place of birth - Born in state of residence (%) - Other Race
Place of birth - Born in other state (%)
Place of birth - Born in other state (%) - White
Place of birth - Born in other state (%) - Black or African American
Place of birth - Born in other state (%) - Asian
Place of birth - Born in other state (%) - Hispanic or Latino
Place of birth - Born in other state (%) - American Indian and Alaska Native
Place of birth - Born in other state (%) - Multirace
Place of birth - Born in other state (%) - Other Race
Place of birth - Native, outside of US (%)
Place of birth - Native, outside of US (%) - White
Place of birth - Native, outside of US (%) - Black or African American
Place of birth - Native, outside of US (%) - Asian
Place of birth - Native, outside of US (%) - Hispanic or Latino
Place of birth - Native, outside of US (%) - American Indian and Alaska Native
Place of birth - Native, outside of US (%) - Multirace
Place of birth - Native, outside of US (%) - Other Race
Place of birth - Foreign born (%)
Place of birth - Foreign born (%) - White
Place of birth - Foreign born (%) - Black or African American
Place of birth - Foreign born (%) - Asian
Place of birth - Foreign born (%) - Hispanic or Latino
Place of birth - Foreign born (%) - American Indian and Alaska Native
Place of birth - Foreign born (%) - Multirace
Place of birth - Foreign born (%) - Other Race
Residents speaking English at home (%)
Residents speaking English at home - Born in the United States (%)
Residents speaking English at home - Native, born elsewhere (%)
Residents speaking English at home - Foreign born (%)
Residents speaking Spanish at home (%)
Residents speaking Spanish at home - Born in the United States (%)
Residents speaking Spanish at home - Native, born elsewhere (%)
Residents speaking Spanish at home - Foreign born (%)
Residents speaking other language at home (%)
Residents speaking other language at home - Born in the United States (%)
Residents speaking other language at home - Native, born elsewhere (%)
Residents speaking other language at home - Foreign born (%)
Marital status - Never married (%)
Marital status - Now married (%)
Marital status - Separated (%)
Marital status - Widowed (%)
Marital status - Divorced (%)
Ancestries Reported - Arab (%)
Ancestries Reported - Czech (%)
Ancestries Reported - Danish (%)
Ancestries Reported - Dutch (%)
Ancestries Reported - English (%)
Ancestries Reported - French (%)
Ancestries Reported - French Canadian (%)
Ancestries Reported - German (%)
Ancestries Reported - Greek (%)
Ancestries Reported - Hungarian (%)
Ancestries Reported - Irish (%)
Ancestries Reported - Italian (%)
Ancestries Reported - Lithuanian (%)
Ancestries Reported - Norwegian (%)
Ancestries Reported - Polish (%)
Ancestries Reported - Portuguese (%)
Ancestries Reported - Russian (%)
Ancestries Reported - Scotch-Irish (%)
Ancestries Reported - Scottish (%)
Ancestries Reported - Slovak (%)
Ancestries Reported - Subsaharan African (%)
Ancestries Reported - Swedish (%)
Ancestries Reported - Swiss (%)
Ancestries Reported - Ukrainian (%)
Ancestries Reported - United States (%)
Ancestries Reported - Welsh (%)
Ancestries Reported - West Indian (%)
Ancestries Reported - Other (%)
Geographical mobility - Same house 1 year ago (%)
Geographical mobility - Same house 1 year ago (%) - White
Geographical mobility - Same house 1 year ago (%) - Black or African American
Geographical mobility - Same house 1 year ago (%) - Asian
Geographical mobility - Same house 1 year ago (%) - Hispanic or Latino
Geographical mobility - Same house 1 year ago (%) - American Indian and Alaska Native
Geographical mobility - Same house 1 year ago (%) - Multirace
Geographical mobility - Same house 1 year ago (%) - Other Race
Geographical mobility - Moved within same county (%)
Geographical mobility - Moved within same county (%) - White
Geographical mobility - Moved within same county (%) - Black or African American
Geographical mobility - Moved within same county (%) - Asian
Geographical mobility - Moved within same county (%) - Hispanic or Latino
Geographical mobility - Moved within same county (%) - American Indian and Alaska Native
Geographical mobility - Moved within same county (%) - Multirace
Geographical mobility - Moved within same county (%) - Other Race
Geographical mobility - Moved from different county within same state (%)
Geographical mobility - Moved from different county within same state (%) - White
Geographical mobility - Moved from different county within same state (%) - Black or African American
Geographical mobility - Moved from different county within same state (%) - Asian
Geographical mobility - Moved from different county within same state (%) - Hispanic or Latino
Geographical mobility - Moved from different county within same state (%) - American Indian and Alaska Native
Geographical mobility - Moved from different county within same state (%) - Multirace
Geographical mobility - Moved from different county within same state (%) - Other Race
Geographical mobility - Moved from different state (%)
Geographical mobility - Moved from different state (%) - White
Geographical mobility - Moved from different state (%) - Black or African American
Geographical mobility - Moved from different state (%) - Asian
Geographical mobility - Moved from different state (%) - Hispanic or Latino
Geographical mobility - Moved from different state (%) - American Indian and Alaska Native
Geographical mobility - Moved from different state (%) - Multirace
Geographical mobility - Moved from different state (%) - Other Race
Geographical mobility - Moved from abroad (%)
Geographical mobility - Moved from abroad (%) - White
Geographical mobility - Moved from abroad (%) - Black or African American
Geographical mobility - Moved from abroad (%) - Asian
Geographical mobility - Moved from abroad (%) - Hispanic or Latino
Geographical mobility - Moved from abroad (%) - American Indian and Alaska Native
Geographical mobility - Moved from abroad (%) - Multirace
Geographical mobility - Moved from abroad (%) - Other Race
Place of birth for the foreign-born population - Ireland (%)
Place of birth for the foreign-born population - Denmark (%)
Place of birth for the foreign-born population - Norway (%)
Place of birth for the foreign-born population - Sweden (%)
Place of birth for the foreign-born population - United Kingdom (%)
Place of birth for the foreign-born population - England (%)
Place of birth for the foreign-born population - Scotland (%)
Place of birth for the foreign-born population - Other Northern Europe (%)
Place of birth for the foreign-born population - Austria (%)
Place of birth for the foreign-born population - Belgium (%)
Place of birth for the foreign-born population - France (%)
Place of birth for the foreign-born population - Germany (%)
Place of birth for the foreign-born population - Netherlands (%)
Place of birth for the foreign-born population - Switzerland (%)
Place of birth for the foreign-born population - Other Western Europe (%)
Place of birth for the foreign-born population - Greece (%)
Place of birth for the foreign-born population - Italy (%)
Place of birth for the foreign-born population - Portugal (%)
Place of birth for the foreign-born population - Spain (%)
Place of birth for the foreign-born population - Other Southern Europe (%)
Place of birth for the foreign-born population - Albania (%)
Place of birth for the foreign-born population - Belarus (%)
Place of birth for the foreign-born population - Bosnia and Herzegovina (%)
Place of birth for the foreign-born population - Bulgaria (%)
Place of birth for the foreign-born population - Croatia (%)
Place of birth for the foreign-born population - Czechoslovakia (%)
Place of birth for the foreign-born population - Hungary (%)
Place of birth for the foreign-born population - Latvia (%)
Place of birth for the foreign-born population - Lithuania (%)
Place of birth for the foreign-born population - North Macedonia (Macedonia) (%)
Place of birth for the foreign-born population - Moldova (%)
Place of birth for the foreign-born population - Poland (%)
Place of birth for the foreign-born population - Romania (%)
Place of birth for the foreign-born population - Russia (%)
Place of birth for the foreign-born population - Serbia (%)
Place of birth for the foreign-born population - Ukraine (%)
Place of birth for the foreign-born population - Other Eastern Europe (%)
Place of birth for the foreign-born population - China (%)
Place of birth for the foreign-born population - Hong Kong (%)
Place of birth for the foreign-born population - Taiwan (%)
Place of birth for the foreign-born population - Japan (%)
Place of birth for the foreign-born population - Korea (%)
Place of birth for the foreign-born population - Other Eastern Asia (%)
Place of birth for the foreign-born population - Afghanistan (%)
Place of birth for the foreign-born population - Bangladesh (%)
Place of birth for the foreign-born population - India (%)
Place of birth for the foreign-born population - Iran (%)
Place of birth for the foreign-born population - Kazakhstan (%)
Place of birth for the foreign-born population - Nepal (%)
Place of birth for the foreign-born population - Pakistan (%)
Place of birth for the foreign-born population - Sri Lanka (%)
Place of birth for the foreign-born population - Uzbekistan (%)
Place of birth for the foreign-born population - Other South Central Asia (%)
Place of birth for the foreign-born population - Burma (%)
Place of birth for the foreign-born population - Cambodia (%)
Place of birth for the foreign-born population - Indonesia (%)
Place of birth for the foreign-born population - Laos (%)
Place of birth for the foreign-born population - Malaysia (%)
Place of birth for the foreign-born population - Philippines (%)
Place of birth for the foreign-born population - Singapore (%)
Place of birth for the foreign-born population - Thailand (%)
Place of birth for the foreign-born population - Vietnam (%)
Place of birth for the foreign-born population - Other South Eastern Asia (%)
Place of birth for the foreign-born population - Armenia (%)
Place of birth for the foreign-born population - Iraq (%)
Place of birth for the foreign-born population - Israel (%)
Place of birth for the foreign-born population - Jordan (%)
Place of birth for the foreign-born population - Kuwait (%)
Place of birth for the foreign-born population - Lebanon (%)
Place of birth for the foreign-born population - Saudi Arabia (%)
Place of birth for the foreign-born population - Syria (%)
Place of birth for the foreign-born population - Turkey (%)
Place of birth for the foreign-born population - Yemen (%)
Place of birth for the foreign-born population - Other Western Asia (%)
Place of birth for the foreign-born population - Eritrea (%)
Place of birth for the foreign-born population - Ethiopia (%)
Place of birth for the foreign-born population - Kenya (%)
Place of birth for the foreign-born population - Somalia (%)
Place of birth for the foreign-born population - Uganda (%)
Place of birth for the foreign-born population - Zimbabwe (%)
Place of birth for the foreign-born population - Other Eastern Africa (%)
Place of birth for the foreign-born population - Cameroon (%)
Place of birth for the foreign-born population - Congo (%)
Place of birth for the foreign-born population - Democratic Republic of Congo (Zaire) (%)
Place of birth for the foreign-born population - Other Middle Africa (%)
Place of birth for the foreign-born population - Egypt (%)
Place of birth for the foreign-born population - Morocco (%)
Place of birth for the foreign-born population - Sudan (%)
Place of birth for the foreign-born population - Other Northern Africa (%)
Place of birth for the foreign-born population - South Africa (%)
Place of birth for the foreign-born population - Other Southern Africa (%)
Place of birth for the foreign-born population - Cabo Verde (%)
Place of birth for the foreign-born population - Ghana (%)
Place of birth for the foreign-born population - Liberia (%)
Place of birth for the foreign-born population - Nigeria (%)
Place of birth for the foreign-born population - Senegal (%)
Place of birth for the foreign-born population - Sierra Leone (%)
Place of birth for the foreign-born population - Other Western Africa (%)
Place of birth for the foreign-born population - Australia (%)
Place of birth for the foreign-born population - New Zealand (%)
Place of birth for the foreign-born population - Fiji (%)
Place of birth for the foreign-born population - Micronesia (%)
Place of birth for the foreign-born population - Bahamas (%)
Place of birth for the foreign-born population - Barbados (%)
Place of birth for the foreign-born population - Cuba (%)
Place of birth for the foreign-born population - Dominica (%)
Place of birth for the foreign-born population - Dominican Republic (%)
Place of birth for the foreign-born population - Grenada (%)
Place of birth for the foreign-born population - Haiti (%)
Place of birth for the foreign-born population - Jamaica (%)
Place of birth for the foreign-born population - St. Vincent and the Grenadines (%)
Place of birth for the foreign-born population - Trinidad and Tobago (%)
Place of birth for the foreign-born population - West Indies (%)
Place of birth for the foreign-born population - Other Caribbean (%)
Place of birth for the foreign-born population - Belize (%)
Place of birth for the foreign-born population - Costa Rica (%)
Place of birth for the foreign-born population - El Salvador (%)
Place of birth for the foreign-born population - Guatemala (%)
Place of birth for the foreign-born population - Honduras (%)
Place of birth for the foreign-born population - Mexico (%)
Place of birth for the foreign-born population - Nicaragua (%)
Place of birth for the foreign-born population - Panama (%)
Place of birth for the foreign-born population - Other Central America (%)
Place of birth for the foreign-born population - Argentina (%)
Place of birth for the foreign-born population - Bolivia (%)
Place of birth for the foreign-born population - Brazil (%)
Place of birth for the foreign-born population - Chile (%)
Place of birth for the foreign-born population - Colombia (%)
Place of birth for the foreign-born population - Ecuador (%)
Place of birth for the foreign-born population - Guyana (%)
Place of birth for the foreign-born population - Peru (%)
Place of birth for the foreign-born population - Uruguay (%)
Place of birth for the foreign-born population - Venezuela (%)
Place of birth for the foreign-born population - Other South America (%)
Place of birth for the foreign-born population - Canada (%)
Place of birth for the foreign-born population - Other Northern America (%)
Place of birth for the foreign-born population - Other (%)
Latest news about races in Plantation, FL collected exclusively by city-data.com from local newspapers, TV, and radio stations
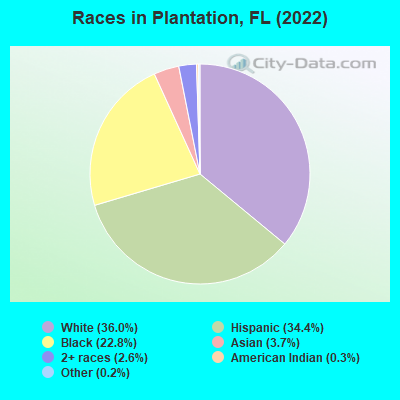
According to 2022 data, the most numerous races in Plantation, FL are White alone (34,568 residents), Hispanic (33,009 residents), and Black alone (21,890 residents). 61.2% of Plantation residents speak English at home. 32.2% of Plantation, FL residents are foreign-born (23.4% born in Latin America, 3.6% born in Asia), which is 34.7% greater than the foreign-born rate of 21.0% across the entire state of Florida.
Race distribution in Plantation
2000 2022
56,411 68.0% White alone 11,101 13.4% Black alone 10,860 13.1% Hispanic 2,359 2.8% Asian alone 1,723 2.1% Two or more races 337 0.4% Other race alone 107 0.1% American Indian alone 36 0.04% Native Hawaiian and Other
34,568 36.0% White alone 33,009 34.4% Hispanic 21,890 22.8% Black alone 3,530 3.7% Asian alone 2,543 2.6% Two or more races 293 0.3% American Indian alone 213 0.2% Other race alone
2000 2022
10,458,509 65.4% White alone 2,682,715 16.8% Hispanic 2,264,268 14.2% Black alone 261,693 1.6% Asian alone 236,954 1.5% Two or more races 42,358 0.3% American Indian alone 28,994 0.2% Other race alone 6,887 0.04% Native Hawaiian and Other
11,309,403 50.8% White alone 6,025,039 27.1% Hispanic 3,241,015 14.6% Black alone 861,630 3.9% Two or more races 623,692 2.8% Asian alone 152,054 0.7% Other race alone 22,504 0.1% American Indian alone 9,486 0.04% Native Hawaiian and Other
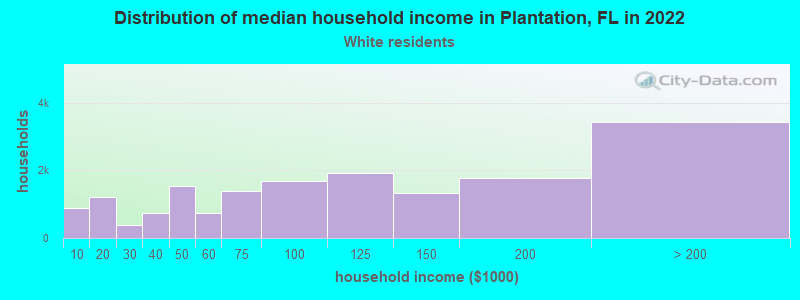
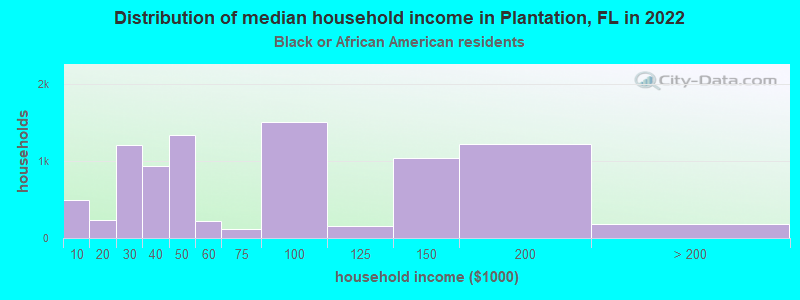
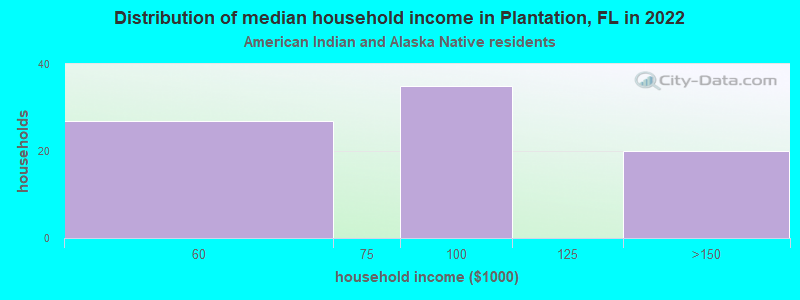
Income and house value in Plantation Median household income in 2022 $100,106 White non-Hispanic householders$53,884 Black householders$77,595 Asian householders$71,431 Some other race householders$102,202 Two or more races householders$84,445 Hispanic or Latino race householdersMedian 2022 house value $561,222 White Non-Hispanic householders$476,293 Black or African American householders$619,805 American Indian or Alaska Native householders $585,487 Asian householders$396,911 Some other race householders$449,601 Two or more races householders$509,571 Hispanic or Latino householders
Median age by race in Plantation
52.4 Median age for White residents44.5 56.5 35.1 Median age for Black or African American residents34.8 35.4 68.2 Median age for American Indian / Alaska Native residents-666,666,666.0 -666,666,666.0 29.7 Median age for Asian residents37.4 28.8 -666,666,666.0 Median age for Native Hawaiian / Pacific Islander residents-666,666,666.0 -666,666,666.0 25.8 Median age for Other race residents35.9 25.3 37.0 Median age for Two or more races residents36.9 37.1 54.8 Median age for White alone residents48.6 58.0 36.1 Median age for Hispanic or Latino residents36.3 35.6
Owner/renter occupied households by race in Plantation
House owners and renters - White residents 12,994 76.2% Owner occupied4,050 23.8% Renter occupiedHouse owners and renters - Black or African American residents 4,188 48.4% Owner occupied4,468 51.6% Renter occupiedHouse owners and renters - American Indian / Alaska Native residents 54 76.7% Owner occupied16 23.3% Renter occupiedHouse owners and renters - Asian residents 387 35.5% Owner occupied702 64.5% Renter occupiedHouse owners and renters - Other race residents 1,274 47.6% Owner occupied1,400 52.4% Renter occupiedHouse owners and renters - Two or more races residents 3,655 57.0% Owner occupied2,762 43.0% Renter occupiedHouse owners and renters - White alone residents 11,685 78.7% Owner occupied3,158 21.3% Renter occupiedHouse owners and renters - Hispanic or Latino residents 5,979 52.1% Owner occupied5,504 47.9% Renter occupied
Language usage in Plantation
English speakers - Total 61.2% of residents of Plantation speak English at home.
25.2% of residents speak Spanish at home 16,086 71.6% Speak English very well6,388 28.4% Speak English less than very well13.6% of residents speak other language at home 8,133 67.3% Speak English very well3,957 32.7% Speak English less than very well
English speakers - Born in the United States 80.8% of residents of Plantation speak English at home.
13.7% of residents speak Spanish at home 3,102 91.7% Speak English very well279 8.3% Speak English less than very well5.5% of residents speak other language at home 1,267 93.9% Speak English very well82 6.1% Speak English less than very well
English speakers - Native, born elsewhere 29.4% of residents of Plantation speak English at home.
65.3% of residents speak Spanish at home 3,072 80.8% Speak English very well728 19.2% Speak English less than very well5.3% of residents speak other language at home 311 100.0% Speak English very well
English speakers - Foreign-born 28.8% of residents of Plantation speak English at home.
40.7% of residents speak Spanish at home 6,927 58.1% Speak English very well4,986 41.9% Speak English less than very well30.5% of residents speak other language at home 5,200 58.2% Speak English very well3,733 41.8% Speak English less than very well
White (Caucasian) - Speak only English Native:
86.2% (27,885)Foreign-born:
24.3% (1,548)
White (Caucasian) - Speak another language Native:
13.8% (4,451)Foreign-born:
75.7% (4,822)
Black or African American - Speak only English Native:
85.5% (9,842)Foreign-born:
54.9% (5,303)
Black or African American - Speak another language Native:
14.5% (1,665)Foreign-born:
45.1% (4,357)
American Indian / Alaska Native - Speak only English Native:
93.8% (199)Foreign-born:
100.0% (54)
Asian - Speak only English Native:
49.0% (365)Foreign-born:
27.5% (788)
Asian - Speak another language Native:
51.0% (380)Foreign-born:
72.5% (2,074)
Other race - Speak only English Native:
58.8% (1,973)Foreign-born:
2.1% (44)
Other race - Speak another language Native:
41.2% (1,383)Foreign-born:
97.9% (2,047)
Two or more races - Speak only English Native:
49.9% (5,808)Foreign-born:
9.2% (764)
Two or more races - Speak another language Native:
50.1% (5,839)Foreign-born:
90.8% (7,546)
White alone - Speak only English Native:
90.8% (26,142)Foreign-born:
32.7% (1,430)
White alone - Speak another language Native:
9.2% (2,640)Foreign-born:
67.3% (2,940)
Hispanic or Latino - Speak only English Native:
45.0% (8,064)Foreign-born:
5.6% (673)
Hispanic or Latino - Speak another language Native:
55.0% (9,852)Foreign-born:
94.4% (11,349)
Foreign-born residents in Plantation 30,062 residents are foreign born (23.4% Latin America , 3.6% Asia ).
This city:
32.2%Florida:
21.1%
Marital status for residents in Plantation Marital status - White (Caucasian) population 15 years and over
Males 32.1% Never married54.5% Now married0.6% Separated1.8% Widowed11.0% DivorcedFemales 21.8% Never married52.2% Now married1.4% Separated15.8% Widowed8.8% DivorcedWomen who gave birth in the past 12 months Now married:
100.0% (365)Unmarried:
0.0% (0)
Women who did not give birth in the past 12 months Now married:
49.2% (2,891)Unmarried:
50.8% (2,982)
Marital status - Black or African American population 15 years and over
Males 46.0% Never married48.7% Now married3.2% Separated0.0% Widowed2.1% DivorcedFemales 42.8% Never married37.4% Now married1.8% Separated7.7% Widowed10.3% DivorcedWomen who gave birth in the past 12 months Now married:
78.2% (433)Unmarried:
21.8% (121)
Women who did not give birth in the past 12 months Now married:
22.0% (1,023)Unmarried:
78.0% (3,636)
Marital status - American Indian / Alaska Native population 15 years and over
Males 28.7% Never married15.8% Now married0.0% Separated0.0% Widowed55.4% DivorcedFemales 58.7% Never married1.6% Now married0.0% Separated39.7% Widowed0.0% DivorcedWomen who did not give birth in the past 12 months Now married:
0.0% (0)Unmarried:
100.0% (26)
Marital status - Asian population 15 years and over
Males 34.8% Never married55.9% Now married0.0% Separated2.1% Widowed7.3% DivorcedFemales 36.5% Never married48.8% Now married0.0% Separated5.3% Widowed9.4% DivorcedWomen who gave birth in the past 12 months Now married:
32.9% (23)Unmarried:
67.1% (48)
Women who did not give birth in the past 12 months Now married:
44.5% (628)Unmarried:
55.5% (783)
Marital status - Other race population 15 years and over
Males 25.4% Never married54.7% Now married4.2% Separated1.2% Widowed14.4% DivorcedFemales 34.6% Never married46.0% Now married0.0% Separated3.9% Widowed15.5% DivorcedWomen who gave birth in the past 12 months Now married:
81.3% (149)Unmarried:
18.7% (34)
Women who did not give birth in the past 12 months Now married:
45.1% (716)Unmarried:
54.9% (870)
Marital status - Two or more races population 15 years and over
Males 23.8% Never married63.7% Now married5.9% Separated0.0% Widowed6.7% DivorcedFemales 25.5% Never married56.9% Now married2.5% Separated4.4% Widowed10.7% DivorcedWomen who gave birth in the past 12 months Now married:
100.0% (288)Unmarried:
0.0% (0)
Women who did not give birth in the past 12 months Now married:
56.7% (2,987)Unmarried:
43.3% (2,277)
Marital status - White alone, not Hispanic / Latino population 15 years and over
Males 31.7% Never married54.8% Now married0.7% Separated2.2% Widowed10.6% DivorcedFemales 19.9% Never married50.8% Now married1.6% Separated18.0% Widowed9.7% DivorcedWomen who gave birth in the past 12 months Now married:
100.0% (289)Unmarried:
0.0% (0)
Women who did not give birth in the past 12 months Now married:
49.1% (2,238)Unmarried:
50.9% (2,322)
Marital status - Hispanic or Latino population 15 years and over
Males 30.6% Never married59.7% Now married1.4% Separated0.0% Widowed8.3% DivorcedFemales 37.8% Never married49.3% Now married1.2% Separated3.2% Widowed8.5% DivorcedWomen who gave birth in the past 12 months Now married:
100.0% (680)Unmarried:
0.0% (0)
Women who did not give birth in the past 12 months Now married:
41.3% (3,457)Unmarried:
58.7% (4,910)
Ancestries in Plantation
4,596 8.2% Haitian4,172 7.5% American4,126 7.4% Jamaican2,266 4.1% Italian1,694 3.0% English1,578 2.8% Irish1,495 2.7% German940 1.7% European654 1.2% Polish550 1.0% Israeli401 0.7% Russian387 0.7% Eastern European353 0.6% Trinidadian and Tobagonian293 0.5% British288 0.5% Brazilian268 0.5% French253 0.5% Slavic252 0.5% African228 0.4% Palestinian227 0.4% Bahamian223 0.4% French Canadian209 0.4% Dutch205 0.4% Scottish203 0.4% West Indian196 0.4% Guyanese179 0.3% Ghanaian161 0.3% Hungarian155 0.3% Moroccan147 0.3% Iranian146 0.3% Lebanese111 0.2% Greek107 0.2% Canadian106 0.2% South African106 0.2% British West Indian101 0.2% Portuguese100 0.2% Ukrainian86 0.2% Scotch-Irish73 0.1% Scandinavian72 0.1% Austrian63 0.1% Slovak62 0.1% Romanian56 0.1% Turkish49 0.09% Sudanese46 0.08% Lithuanian45 0.08% Syrian44 0.08% Swedish43 0.08% Czech42 0.08% Welsh35 0.06% Barbadian32 0.06% Egyptian32 0.06% Croatian29 0.05% Serbian29 0.05% Macedonian27 0.05% Finnish27 0.05% Norwegian26 0.05% Yugoslavian24 0.04% Danish24 0.04% Celtic22 0.04% Northern European20 0.04% Ethiopian17 0.03% Latvian16 0.03% Luxembourger12 0.02% Armenian12 0.02% Australian12 0.02% U.S. Virgin Islander11 0.02% Kenyan11 0.02% Estonian9 0.02% Albanian9 0.02% Czechoslovakian5 0.01% Belgian4 0.01% Arab3 0.01% Nigerian
Geographical mobility in Plantation Same house 1 year ago 34,767 86.4% White (Caucasian)19,066 84.3% Black or African American436 100.0% American Indian / Alaska Native3,160 73.5% Asian4,832 78.3% Other race15,682 73.2% Two or more races30,102 87.9% White alone, not Hispanic / Latino24,140 74.2% Hispanic or LatinoMoved within same county 4,142 10.3% White / Caucasian2,621 11.6% Black or African American522 12.1% Asian831 13.5% Other race3,890 18.2% Two or more races3,269 9.5% White alone, not Hispanic / Latino6,016 18.5% Hispanic or LatinoMoved within same state 518 1.3% White / Caucasian32 0.1% Black or African American187 4.3% Asian232 3.8% Other race1,168 5.5% Two or more races284 0.8% White alone, not Hispanic / Latino1,056 3.2% Hispanic or LatinoMoved from different state 704 1.7% White / Caucasian333 1.5% Black or African American318 7.4% Asian269 4.4% Other race158 0.7% Two or more races491 1.4% White alone, not Hispanic / Latino815 2.5% Hispanic or LatinoMoved from abroad 107 0.3% White573 2.5% Black or African American156 3.6% Asian7 0.1% Other race520 2.4% Two or more races107 0.3% White alone, not Hispanic / Latino527 1.6% Hispanic or Latino
Children Nativity (place of birth) in Plantation
Children under 6 years - Living with two parents Both parents native 2,041 100.0% NativeBoth parents foreign-born 3,275 93.6% Native223 6.4% Foreign-bornOne native, one foreign-born parent 714 100.0% NativeChildren under 6 years - Living with one parent Native parent 1,818 100.0% NativeForeign-born parent 74 100.0% NativeChildren 6 to 17 years - Living with two parents Both parents native 3,461 100.0% NativeBoth parents foreign-born 1,171 37.8% Native1,927 62.2% Foreign-bornOne native, one foreign-born parent 1,462 100.0% NativeChildren 6 to 17 years - Living with one parent Native parent 2,033 100.0% NativeForeign-born parent 746 53.6% Native645 46.4% Foreign-born
Place of birth for residents in Plantation 23,677 Americas23,155 Latin America11,834 Caribbean8,390 South America3,582 Asia2,930 Central America2,211 Europe1,529 South Central Asia866 Western Asia677 Western Europe579 Africa567 Eastern Europe567 Eastern Asia561 South Eastern Asia522 Northern America517 Northern Europe457 China448 Southern Europe187 Western Africa169 Northern Africa105 Southern Africa83 Eastern Africa11 Oceania11 Australia and New Zealand Subregion4,652 Jamaica3,175 Haiti3,057 Colombia2,553 Venezuela1,806 Cuba900 India883 Peru782 Nicaragua718 Dominican Republic713 Mexico558 Trinidad and Tobago534 Israel522 Canada497 Brazil393 Honduras376 Guatemala356 Panama356 Ecuador348 Bahamas346 Germany342 Argentina323 China321 Italy274 Vietnam263 Guyana255 El Salvador237 Pakistan233 France197 England192 Philippines187 Iran177 Uruguay152 Ghana148 United Kingdom145 Azerbaijan121 Hong Kong116 Chile105 South Africa103 Morocco98 Ireland95 Russia85 Greece85 Grenada80 Poland79 Bolivia79 Romania70 Saudi Arabia69 Czechoslovakia66 Barbados64 Hungary63 Bangladesh56 Japan53 Costa Rica49 Netherlands48 West Indies45 Ukraine43 Lithuania41 Sweden34 Thailand31 Switzerland29 Syria29 Kenya28 Kuwait27 Portugal26 St. Lucia24 Lebanon21 Malaysia20 Laos20 Turkey19 Belarus18 Uzbekistan17 Burma (Myanmar)14 Belgium14 Cabo Verde14 Spain13 Korea12 Taiwan11 Australia11 Albania10 Nigeria10 Eritrea9 Liberia8 Ethiopia7 Latvia6 Jordan6 Moldova6 United Arab Emirates4 Scotland4 St. Vincent and the Grenadines2 Cambodia
Grandparents responsible for own grandchildren in Plantation
Grandparents (30 to 59 years) White / Caucasian 19 19.2% Responsible for grandchildren80 80.8% Not responsible for grandchildrenBlack or African American 38 10.0% Responsible for grandchildren342 90.0% Not responsible for grandchildrenAsian 21 20.8% Responsible for grandchildren79 79.2% Not responsible for grandchildrenOther race 76 100.0% Not responsible for grandchildrenTwo or more races 123 100.0% Not responsible for grandchildrenWhite alone, not Hispanic / Latino 9 17.2% Responsible for grandchildren45 82.8% Not responsible for grandchildrenHispanic or Latino 27 7.8% Responsible for grandchildren321 92.2% Not responsible for grandchildrenGrandparents (60 years and over) White / Caucasian 139 30.0% Responsible for grandchildren324 70.0% Not responsible for grandchildrenBlack or African American 114 22.2% Responsible for grandchildren400 77.8% Not responsible for grandchildrenAsian 5 2.8% Responsible for grandchildren168 97.2% Not responsible for grandchildrenOther race 56 100.0% Not responsible for grandchildrenTwo or more races 79 20.5% Responsible for grandchildren305 79.5% Not responsible for grandchildrenWhite alone, not Hispanic / Latino 146 30.2% Responsible for grandchildren338 69.8% Not responsible for grandchildrenHispanic or Latino 27 7.4% Responsible for grandchildren336 92.6% Not responsible for grandchildren