Races in Plainfield, New Jersey (NJ) Detailed Stats
Data:
Races - White alone (%)
Races - White alone (% change since 2000)
Races - Black alone (%)
Races - Black alone (% change since 2000)
Races - American Indian alone (%)
Races - American Indian alone (% change since 2000)
Races - Asian alone (%)
Races - Asian alone (% change since 2000)
Races - Hispanic (%)
Races - Hispanic (% change since 2000)
Races - Native Hawaiian and Other Pacific Islander alone (%)
Races - Native Hawaiian and Other Pacific Islander alone (% change since 2000)
Races - Two or more races(%)
Races - Two or more races(% change since 2000)
Races - Other race alone (%)
Races - Other race alone (% change since 2000)
Racial diversity
Place of birth - Born in state of residence (%)
Place of birth - Born in state of residence (%) - White
Place of birth - Born in state of residence (%) - Black or African American
Place of birth - Born in state of residence (%) - Asian
Place of birth - Born in state of residence (%) - Hispanic or Latino
Place of birth - Born in state of residence (%) - American Indian and Alaska Native
Place of birth - Born in state of residence (%) - Multirace
Place of birth - Born in state of residence (%) - Other Race
Place of birth - Born in other state (%)
Place of birth - Born in other state (%) - White
Place of birth - Born in other state (%) - Black or African American
Place of birth - Born in other state (%) - Asian
Place of birth - Born in other state (%) - Hispanic or Latino
Place of birth - Born in other state (%) - American Indian and Alaska Native
Place of birth - Born in other state (%) - Multirace
Place of birth - Born in other state (%) - Other Race
Place of birth - Native, outside of US (%)
Place of birth - Native, outside of US (%) - White
Place of birth - Native, outside of US (%) - Black or African American
Place of birth - Native, outside of US (%) - Asian
Place of birth - Native, outside of US (%) - Hispanic or Latino
Place of birth - Native, outside of US (%) - American Indian and Alaska Native
Place of birth - Native, outside of US (%) - Multirace
Place of birth - Native, outside of US (%) - Other Race
Place of birth - Foreign born (%)
Place of birth - Foreign born (%) - White
Place of birth - Foreign born (%) - Black or African American
Place of birth - Foreign born (%) - Asian
Place of birth - Foreign born (%) - Hispanic or Latino
Place of birth - Foreign born (%) - American Indian and Alaska Native
Place of birth - Foreign born (%) - Multirace
Place of birth - Foreign born (%) - Other Race
Residents speaking English at home (%)
Residents speaking English at home - Born in the United States (%)
Residents speaking English at home - Native, born elsewhere (%)
Residents speaking English at home - Foreign born (%)
Residents speaking Spanish at home (%)
Residents speaking Spanish at home - Born in the United States (%)
Residents speaking Spanish at home - Native, born elsewhere (%)
Residents speaking Spanish at home - Foreign born (%)
Residents speaking other language at home (%)
Residents speaking other language at home - Born in the United States (%)
Residents speaking other language at home - Native, born elsewhere (%)
Residents speaking other language at home - Foreign born (%)
Marital status - Never married (%)
Marital status - Now married (%)
Marital status - Separated (%)
Marital status - Widowed (%)
Marital status - Divorced (%)
Ancestries Reported - Arab (%)
Ancestries Reported - Czech (%)
Ancestries Reported - Danish (%)
Ancestries Reported - Dutch (%)
Ancestries Reported - English (%)
Ancestries Reported - French (%)
Ancestries Reported - French Canadian (%)
Ancestries Reported - German (%)
Ancestries Reported - Greek (%)
Ancestries Reported - Hungarian (%)
Ancestries Reported - Irish (%)
Ancestries Reported - Italian (%)
Ancestries Reported - Lithuanian (%)
Ancestries Reported - Norwegian (%)
Ancestries Reported - Polish (%)
Ancestries Reported - Portuguese (%)
Ancestries Reported - Russian (%)
Ancestries Reported - Scotch-Irish (%)
Ancestries Reported - Scottish (%)
Ancestries Reported - Slovak (%)
Ancestries Reported - Subsaharan African (%)
Ancestries Reported - Swedish (%)
Ancestries Reported - Swiss (%)
Ancestries Reported - Ukrainian (%)
Ancestries Reported - United States (%)
Ancestries Reported - Welsh (%)
Ancestries Reported - West Indian (%)
Ancestries Reported - Other (%)
Geographical mobility - Same house 1 year ago (%)
Geographical mobility - Same house 1 year ago (%) - White
Geographical mobility - Same house 1 year ago (%) - Black or African American
Geographical mobility - Same house 1 year ago (%) - Asian
Geographical mobility - Same house 1 year ago (%) - Hispanic or Latino
Geographical mobility - Same house 1 year ago (%) - American Indian and Alaska Native
Geographical mobility - Same house 1 year ago (%) - Multirace
Geographical mobility - Same house 1 year ago (%) - Other Race
Geographical mobility - Moved within same county (%)
Geographical mobility - Moved within same county (%) - White
Geographical mobility - Moved within same county (%) - Black or African American
Geographical mobility - Moved within same county (%) - Asian
Geographical mobility - Moved within same county (%) - Hispanic or Latino
Geographical mobility - Moved within same county (%) - American Indian and Alaska Native
Geographical mobility - Moved within same county (%) - Multirace
Geographical mobility - Moved within same county (%) - Other Race
Geographical mobility - Moved from different county within same state (%)
Geographical mobility - Moved from different county within same state (%) - White
Geographical mobility - Moved from different county within same state (%) - Black or African American
Geographical mobility - Moved from different county within same state (%) - Asian
Geographical mobility - Moved from different county within same state (%) - Hispanic or Latino
Geographical mobility - Moved from different county within same state (%) - American Indian and Alaska Native
Geographical mobility - Moved from different county within same state (%) - Multirace
Geographical mobility - Moved from different county within same state (%) - Other Race
Geographical mobility - Moved from different state (%)
Geographical mobility - Moved from different state (%) - White
Geographical mobility - Moved from different state (%) - Black or African American
Geographical mobility - Moved from different state (%) - Asian
Geographical mobility - Moved from different state (%) - Hispanic or Latino
Geographical mobility - Moved from different state (%) - American Indian and Alaska Native
Geographical mobility - Moved from different state (%) - Multirace
Geographical mobility - Moved from different state (%) - Other Race
Geographical mobility - Moved from abroad (%)
Geographical mobility - Moved from abroad (%) - White
Geographical mobility - Moved from abroad (%) - Black or African American
Geographical mobility - Moved from abroad (%) - Asian
Geographical mobility - Moved from abroad (%) - Hispanic or Latino
Geographical mobility - Moved from abroad (%) - American Indian and Alaska Native
Geographical mobility - Moved from abroad (%) - Multirace
Geographical mobility - Moved from abroad (%) - Other Race
Place of birth for the foreign-born population - Ireland (%)
Place of birth for the foreign-born population - Denmark (%)
Place of birth for the foreign-born population - Norway (%)
Place of birth for the foreign-born population - Sweden (%)
Place of birth for the foreign-born population - United Kingdom (%)
Place of birth for the foreign-born population - England (%)
Place of birth for the foreign-born population - Scotland (%)
Place of birth for the foreign-born population - Other Northern Europe (%)
Place of birth for the foreign-born population - Austria (%)
Place of birth for the foreign-born population - Belgium (%)
Place of birth for the foreign-born population - France (%)
Place of birth for the foreign-born population - Germany (%)
Place of birth for the foreign-born population - Netherlands (%)
Place of birth for the foreign-born population - Switzerland (%)
Place of birth for the foreign-born population - Other Western Europe (%)
Place of birth for the foreign-born population - Greece (%)
Place of birth for the foreign-born population - Italy (%)
Place of birth for the foreign-born population - Portugal (%)
Place of birth for the foreign-born population - Spain (%)
Place of birth for the foreign-born population - Other Southern Europe (%)
Place of birth for the foreign-born population - Albania (%)
Place of birth for the foreign-born population - Belarus (%)
Place of birth for the foreign-born population - Bosnia and Herzegovina (%)
Place of birth for the foreign-born population - Bulgaria (%)
Place of birth for the foreign-born population - Croatia (%)
Place of birth for the foreign-born population - Czechoslovakia (%)
Place of birth for the foreign-born population - Hungary (%)
Place of birth for the foreign-born population - Latvia (%)
Place of birth for the foreign-born population - Lithuania (%)
Place of birth for the foreign-born population - North Macedonia (Macedonia) (%)
Place of birth for the foreign-born population - Moldova (%)
Place of birth for the foreign-born population - Poland (%)
Place of birth for the foreign-born population - Romania (%)
Place of birth for the foreign-born population - Russia (%)
Place of birth for the foreign-born population - Serbia (%)
Place of birth for the foreign-born population - Ukraine (%)
Place of birth for the foreign-born population - Other Eastern Europe (%)
Place of birth for the foreign-born population - China (%)
Place of birth for the foreign-born population - Hong Kong (%)
Place of birth for the foreign-born population - Taiwan (%)
Place of birth for the foreign-born population - Japan (%)
Place of birth for the foreign-born population - Korea (%)
Place of birth for the foreign-born population - Other Eastern Asia (%)
Place of birth for the foreign-born population - Afghanistan (%)
Place of birth for the foreign-born population - Bangladesh (%)
Place of birth for the foreign-born population - India (%)
Place of birth for the foreign-born population - Iran (%)
Place of birth for the foreign-born population - Kazakhstan (%)
Place of birth for the foreign-born population - Nepal (%)
Place of birth for the foreign-born population - Pakistan (%)
Place of birth for the foreign-born population - Sri Lanka (%)
Place of birth for the foreign-born population - Uzbekistan (%)
Place of birth for the foreign-born population - Other South Central Asia (%)
Place of birth for the foreign-born population - Burma (%)
Place of birth for the foreign-born population - Cambodia (%)
Place of birth for the foreign-born population - Indonesia (%)
Place of birth for the foreign-born population - Laos (%)
Place of birth for the foreign-born population - Malaysia (%)
Place of birth for the foreign-born population - Philippines (%)
Place of birth for the foreign-born population - Singapore (%)
Place of birth for the foreign-born population - Thailand (%)
Place of birth for the foreign-born population - Vietnam (%)
Place of birth for the foreign-born population - Other South Eastern Asia (%)
Place of birth for the foreign-born population - Armenia (%)
Place of birth for the foreign-born population - Iraq (%)
Place of birth for the foreign-born population - Israel (%)
Place of birth for the foreign-born population - Jordan (%)
Place of birth for the foreign-born population - Kuwait (%)
Place of birth for the foreign-born population - Lebanon (%)
Place of birth for the foreign-born population - Saudi Arabia (%)
Place of birth for the foreign-born population - Syria (%)
Place of birth for the foreign-born population - Turkey (%)
Place of birth for the foreign-born population - Yemen (%)
Place of birth for the foreign-born population - Other Western Asia (%)
Place of birth for the foreign-born population - Eritrea (%)
Place of birth for the foreign-born population - Ethiopia (%)
Place of birth for the foreign-born population - Kenya (%)
Place of birth for the foreign-born population - Somalia (%)
Place of birth for the foreign-born population - Uganda (%)
Place of birth for the foreign-born population - Zimbabwe (%)
Place of birth for the foreign-born population - Other Eastern Africa (%)
Place of birth for the foreign-born population - Cameroon (%)
Place of birth for the foreign-born population - Congo (%)
Place of birth for the foreign-born population - Democratic Republic of Congo (Zaire) (%)
Place of birth for the foreign-born population - Other Middle Africa (%)
Place of birth for the foreign-born population - Egypt (%)
Place of birth for the foreign-born population - Morocco (%)
Place of birth for the foreign-born population - Sudan (%)
Place of birth for the foreign-born population - Other Northern Africa (%)
Place of birth for the foreign-born population - South Africa (%)
Place of birth for the foreign-born population - Other Southern Africa (%)
Place of birth for the foreign-born population - Cabo Verde (%)
Place of birth for the foreign-born population - Ghana (%)
Place of birth for the foreign-born population - Liberia (%)
Place of birth for the foreign-born population - Nigeria (%)
Place of birth for the foreign-born population - Senegal (%)
Place of birth for the foreign-born population - Sierra Leone (%)
Place of birth for the foreign-born population - Other Western Africa (%)
Place of birth for the foreign-born population - Australia (%)
Place of birth for the foreign-born population - New Zealand (%)
Place of birth for the foreign-born population - Fiji (%)
Place of birth for the foreign-born population - Micronesia (%)
Place of birth for the foreign-born population - Bahamas (%)
Place of birth for the foreign-born population - Barbados (%)
Place of birth for the foreign-born population - Cuba (%)
Place of birth for the foreign-born population - Dominica (%)
Place of birth for the foreign-born population - Dominican Republic (%)
Place of birth for the foreign-born population - Grenada (%)
Place of birth for the foreign-born population - Haiti (%)
Place of birth for the foreign-born population - Jamaica (%)
Place of birth for the foreign-born population - St. Vincent and the Grenadines (%)
Place of birth for the foreign-born population - Trinidad and Tobago (%)
Place of birth for the foreign-born population - West Indies (%)
Place of birth for the foreign-born population - Other Caribbean (%)
Place of birth for the foreign-born population - Belize (%)
Place of birth for the foreign-born population - Costa Rica (%)
Place of birth for the foreign-born population - El Salvador (%)
Place of birth for the foreign-born population - Guatemala (%)
Place of birth for the foreign-born population - Honduras (%)
Place of birth for the foreign-born population - Mexico (%)
Place of birth for the foreign-born population - Nicaragua (%)
Place of birth for the foreign-born population - Panama (%)
Place of birth for the foreign-born population - Other Central America (%)
Place of birth for the foreign-born population - Argentina (%)
Place of birth for the foreign-born population - Bolivia (%)
Place of birth for the foreign-born population - Brazil (%)
Place of birth for the foreign-born population - Chile (%)
Place of birth for the foreign-born population - Colombia (%)
Place of birth for the foreign-born population - Ecuador (%)
Place of birth for the foreign-born population - Guyana (%)
Place of birth for the foreign-born population - Peru (%)
Place of birth for the foreign-born population - Uruguay (%)
Place of birth for the foreign-born population - Venezuela (%)
Place of birth for the foreign-born population - Other South America (%)
Place of birth for the foreign-born population - Canada (%)
Place of birth for the foreign-born population - Other Northern America (%)
Place of birth for the foreign-born population - Other (%)
Latest news about races in Plainfield, NJ collected exclusively by city-data.com from local newspapers, TV, and radio stations
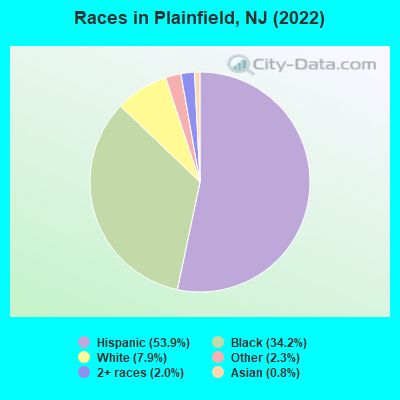
According to 2022 data, the most numerous races in Plainfield, NJ are White alone (4,262 residents), Hispanic (29,166 residents), and Black alone (18,512 residents). 43.7% of Plainfield residents speak English at home. 40.1% of Plainfield, NJ residents are foreign-born (36.6% born in Latin America), which is 42.6% greater than the foreign-born rate of 23.0% across the entire state of New Jersey.
Race distribution in Plainfield
2000 2022
5,557,209 66.0% White alone 1,117,191 13.3% Hispanic 1,096,171 13.0% Black alone 477,012 5.7% Asian alone 133,689 1.6% Two or more races 19,565 0.2% Other race alone 11,338 0.1% American Indian alone 2,175 0.03% Native Hawaiian and Other
4,766,476 51.5% White alone 2,028,470 21.9% Hispanic 1,111,632 12.0% Black alone 923,546 10.0% Asian alone 332,237 3.6% Two or more races 89,847 1.0% Other race alone 8,557 0.09% American Indian alone 934 0.01% Native Hawaiian and Other
Income and house value in Plainfield Median household income in 2022 $115,682 White non-Hispanic householders$81,315 Black householders$159,295 Asian householders$58,020 Some other race householders$81,544 Two or more races householders$62,185 Hispanic or Latino race householdersMedian 2022 house value $427,571 White Non-Hispanic householders$373,462 Black or African American householders$413,068 American Indian or Alaska Native householders $482,238 Asian householders$345,571 Some other race householders$416,693 Two or more races householders$362,585 Hispanic or Latino householders
Median age by race in Plainfield
46.0 Median age for White residents42.4 48.6 43.5 Median age for Black or African American residents39.1 47.6 32.1 Median age for American Indian / Alaska Native residents37.7 14.2 31.8 Median age for Asian residents29.2 42.2 -1,010,045,661.1 Median age for Native Hawaiian / Pacific Islander residents-860,335,194.7 -713,070,378.3 27.5 Median age for Other race residents25.7 28.7 34.0 Median age for Two or more races residents33.6 35.2 52.0 Median age for White alone residents50.4 55.8 28.7 Median age for Hispanic or Latino residents28.3 29.3
Owner/renter occupied households by race in Plainfield
House owners and renters - White residents 1,403 68.5% Owner occupied644 31.5% Renter occupiedHouse owners and renters - Black or African American residents 4,275 57.6% Owner occupied3,146 42.4% Renter occupiedHouse owners and renters - American Indian / Alaska Native residents 78 52.8% Owner occupied70 47.2% Renter occupiedHouse owners and renters - Asian residents 149 91.7% Owner occupied13 8.3% Renter occupiedHouse owners and renters - Other race residents 1,182 19.4% Owner occupied4,926 80.6% Renter occupiedHouse owners and renters - Two or more races residents 591 33.4% Owner occupied1,177 66.6% Renter occupiedHouse owners and renters - White alone residents 1,314 84.4% Owner occupied242 15.6% Renter occupiedHouse owners and renters - Hispanic or Latino residents 1,478 20.6% Owner occupied5,712 79.4% Renter occupied
Language usage in Plainfield
English speakers - Total 43.7% of residents of Plainfield speak English at home.
51.1% of residents speak Spanish at home 9,370 36.6% Speak English very well16,219 63.4% Speak English less than very well5.7% of residents speak other language at home 1,467 51.5% Speak English very well1,384 48.5% Speak English less than very well
English speakers - Born in the United States 86.1% of residents of Plainfield speak English at home.
11.7% of residents speak Spanish at home 771 88.2% Speak English very well103 11.8% Speak English less than very well1.4% of residents speak other language at home 97 89.8% Speak English very well11 10.2% Speak English less than very well
English speakers - Native, born elsewhere 27.8% of residents of Plainfield speak English at home.
69.5% of residents speak Spanish at home 395 57.5% Speak English very well292 42.5% Speak English less than very well2.5% of residents speak other language at home 25 100.0% Speak English very well
English speakers - Foreign-born 12.3% of residents of Plainfield speak English at home.
79.9% of residents speak Spanish at home 2,354 13.4% Speak English very well15,151 86.6% Speak English less than very well8.7% of residents speak other language at home 1,096 57.4% Speak English very well814 42.6% Speak English less than very well
White (Caucasian) - Speak only English Native:
71.6% (2,900)Foreign-born:
12.6% (168)
White (Caucasian) - Speak another language Native:
23.9% (966)Foreign-born:
87.4% (1,167)
Black or African American - Speak only English Native:
93.0% (14,035)Foreign-born:
52.3% (1,450)
Black or African American - Speak another language Native:
6.6% (999)Foreign-born:
41.8% (1,161)
American Indian / Alaska Native - Speak another language Native:
100.0% (154)Foreign-born:
97.6% (302)
Asian - Speak only English Native:
81.8% (158)Foreign-born:
12.5% (44)
Asian - Speak another language Native:
23.9% (46)Foreign-born:
87.3% (305)
Other race - Speak only English Native:
16.2% (1,080)Foreign-born:
4.5% (726)
Other race - Speak another language Native:
83.4% (5,550)Foreign-born:
95.5% (15,578)
Two or more races - Speak only English Native:
27.8% (834)Foreign-born:
17.2% (536)
Two or more races - Speak another language Native:
77.3% (2,321)Foreign-born:
83.5% (2,601)
White alone - Speak only English Native:
79.1% (2,814)Foreign-born:
21.0% (82)
White alone - Speak another language Native:
20.5% (728)Foreign-born:
78.3% (307)
Hispanic or Latino - Speak only English Native:
17.3% (1,487)Foreign-born:
3.7% (679)
Hispanic or Latino - Speak another language Native:
82.6% (7,113)Foreign-born:
96.3% (17,454)
Foreign-born residents in Plainfield 21,697 residents are foreign born (36.6% Latin America ).
This city:
40.1%New Jersey:
23.2%
Marital status for residents in Plainfield Marital status - White (Caucasian) population 15 years and over
Males 40.0% Never married41.2% Now married7.6% Separated3.7% Widowed7.5% DivorcedFemales 33.9% Never married43.0% Now married0.6% Separated7.1% Widowed15.5% DivorcedWomen who gave birth in the past 12 months Now married:
57.1% (36)Unmarried:
42.9% (27)
Women who did not give birth in the past 12 months Now married:
39.5% (344)Unmarried:
60.5% (528)
Marital status - Black or African American population 15 years and over
Males 49.1% Never married39.4% Now married2.0% Separated2.2% Widowed7.4% DivorcedFemales 46.2% Never married32.8% Now married2.1% Separated9.3% Widowed9.6% DivorcedWomen who gave birth in the past 12 months Now married:
43.9% (85)Unmarried:
56.1% (108)
Women who did not give birth in the past 12 months Now married:
25.2% (1,002)Unmarried:
74.8% (2,976)
Marital status - American Indian / Alaska Native population 15 years and over
Males 32.2% Never married13.8% Now married9.8% Separated0.0% Widowed44.3% DivorcedFemales 54.0% Never married18.0% Now married0.0% Separated0.0% Widowed28.0% DivorcedWomen who did not give birth in the past 12 months Now married:
18.0% (14)Unmarried:
82.0% (63)
Marital status - Asian population 15 years and over
Males 57.7% Never married37.9% Now married0.0% Separated0.0% Widowed4.4% DivorcedFemales 29.1% Never married65.0% Now married0.0% Separated5.9% Widowed0.0% DivorcedWomen who did not give birth in the past 12 months Now married:
61.7% (65)Unmarried:
38.3% (40)
Marital status - Other race population 15 years and over
Males 56.1% Never married39.3% Now married1.7% Separated0.4% Widowed2.4% DivorcedFemales 55.9% Never married33.6% Now married1.6% Separated2.0% Widowed6.9% DivorcedWomen who gave birth in the past 12 months Now married:
37.6% (266)Unmarried:
62.4% (441)
Women who did not give birth in the past 12 months Now married:
30.8% (1,768)Unmarried:
69.2% (3,973)
Marital status - Two or more races population 15 years and over
Males 41.3% Never married47.8% Now married2.5% Separated0.7% Widowed7.7% DivorcedFemales 44.8% Never married38.9% Now married1.2% Separated2.0% Widowed13.1% DivorcedWomen who gave birth in the past 12 months Now married:
50.0% (39)Unmarried:
50.0% (39)
Women who did not give birth in the past 12 months Now married:
39.8% (559)Unmarried:
60.2% (844)
Marital status - White alone, not Hispanic / Latino population 15 years and over
Males 42.4% Never married42.2% Now married3.2% Separated5.6% Widowed6.6% DivorcedFemales 32.8% Never married42.4% Now married0.9% Separated10.6% Widowed13.3% DivorcedWomen who gave birth in the past 12 months Now married:
82.1% (31)Unmarried:
17.9% (7)
Women who did not give birth in the past 12 months Now married:
30.7% (172)Unmarried:
69.3% (389)
Marital status - Hispanic or Latino population 15 years and over
Males 51.6% Never married40.6% Now married3.2% Separated0.3% Widowed4.4% DivorcedFemales 52.5% Never married35.1% Now married1.8% Separated2.1% Widowed8.5% DivorcedWomen who gave birth in the past 12 months Now married:
38.8% (303)Unmarried:
61.2% (477)
Women who did not give birth in the past 12 months Now married:
34.1% (2,352)Unmarried:
65.9% (4,539)
Ancestries in Plainfield
789 2.1% Jamaican678 1.8% American567 1.5% Haitian566 1.5% Trinidadian and Tobagonian399 1.1% West Indian329 0.9% African271 0.7% Guyanese265 0.7% Barbadian249 0.7% Italian209 0.6% British West Indian178 0.5% Nigerian162 0.4% Irish137 0.4% Brazilian135 0.4% Polish119 0.3% English118 0.3% Ghanaian113 0.3% Portuguese94 0.3% Hungarian78 0.2% Greek58 0.2% Syrian54 0.1% German47 0.1% Kenyan36 0.10% Iranian34 0.09% Romanian25 0.07% Eastern European15 0.04% European14 0.04% Czechoslovakian14 0.04% Norwegian14 0.04% Ukrainian14 0.04% Lithuanian13 0.04% Russian12 0.03% Arab12 0.03% Slovak9 0.02% French Canadian8 0.02% British
Geographical mobility in Plainfield Same house 1 year ago 5,415 93.6% White (Caucasian)17,328 92.3% Black or African American447 96.6% American Indian / Alaska Native499 93.1% Asian18,913 76.8% Other race5,320 83.2% Two or more races3,861 93.7% White alone, not Hispanic / Latino22,571 78.9% Hispanic or LatinoMoved within same county 93 1.6% White / Caucasian859 4.6% Black or African American3,505 14.2% Other race379 5.9% Two or more races35 0.9% White alone, not Hispanic / Latino3,585 12.5% Hispanic or LatinoMoved within same state 229 4.0% White / Caucasian385 2.1% Black or African American6 1.1% Asian1,259 5.1% Other race437 6.8% Two or more races170 4.1% White alone, not Hispanic / Latino1,591 5.6% Hispanic or LatinoMoved from different state 51 0.9% White / Caucasian221 1.2% Black or African American83 0.3% Other race41 0.6% Two or more races59 1.4% White alone, not Hispanic / Latino110 0.4% Hispanic or LatinoMoved from abroad 15 0.3% White130 0.7% Black or African American13 2.4% Asian1,232 5.0% Other race49 0.8% Two or more races947 3.3% Hispanic or Latino
Children Nativity (place of birth) in Plainfield
Children under 6 years - Living with two parents Both parents native 246 100.0% NativeBoth parents foreign-born 1,309 91.7% Native119 8.3% Foreign-bornOne native, one foreign-born parent 282 100.0% NativeChildren under 6 years - Living with one parent Native parent 547 89.4% Native65 10.6% Foreign-bornForeign-born parent 1,896 84.0% Native362 16.0% Foreign-bornChildren 6 to 17 years - Living with two parents Both parents native 665 100.0% NativeBoth parents foreign-born 2,488 75.8% Native793 24.2% Foreign-bornOne native, one foreign-born parent 206 100.0% NativeChildren 6 to 17 years - Living with one parent Native parent 1,057 100.0% NativeForeign-born parent 3,327 57.1% Native2,498 42.9% Foreign-born
Place of birth for residents in Plainfield 20,234 Americas20,208 Latin America13,033 Central America3,869 South America3,306 Caribbean556 Africa482 Asia423 Europe386 Western Africa266 South Central Asia248 Southern Europe129 South Eastern Asia118 Eastern Africa86 Eastern Europe71 Northern Europe68 Western Asia25 Northern America18 Western Europe14 Northern Africa11 Middle Africa11 Southern Africa8 Eastern Asia1 China5,314 Guatemala4,541 El Salvador1,956 Honduras1,684 Ecuador1,203 Dominican Republic897 Mexico853 Jamaica786 Colombia429 Peru409 Guyana356 Trinidad and Tobago279 Barbados244 Haiti212 Venezuela190 Brazil183 Nigeria178 Ghana165 Panama164 Pakistan150 St. Lucia127 Philippines112 Spain97 Nicaragua76 India68 Syria68 Cuba67 Zimbabwe63 West Indies62 Argentina59 Costa Rica56 Portugal46 Chile45 Greece42 Grenada40 England30 United Kingdom28 Poland26 Kenya26 Dominica25 Tanzania25 Uzbekistan25 Canada24 Russia18 Germany14 Egypt14 Liberia11 South Africa8 Senegal7 Korea2 Togo2 Indonesia1 China1 Ukraine1 Italy
Grandparents responsible for own grandchildren in Plainfield
Grandparents (30 to 59 years) White / Caucasian 68 55.3% Responsible for grandchildren55 44.7% Not responsible for grandchildrenBlack or African American 31 5.8% Responsible for grandchildren502 94.2% Not responsible for grandchildrenOther race 209 100.0% Not responsible for grandchildrenTwo or more races 58 60.8% Responsible for grandchildren38 39.2% Not responsible for grandchildrenWhite alone, not Hispanic / Latino 16 100.0% Not responsible for grandchildrenHispanic or Latino 66 15.2% Responsible for grandchildren366 84.8% Not responsible for grandchildrenGrandparents (60 years and over) White / Caucasian 99 71.8% Responsible for grandchildren39 28.2% Not responsible for grandchildrenBlack or African American 127 31.0% Responsible for grandchildren282 69.0% Not responsible for grandchildrenOther race 219 100.0% Not responsible for grandchildrenTwo or more races 30 14.2% Responsible for grandchildren180 85.8% Not responsible for grandchildrenWhite alone, not Hispanic / Latino 18 77.4% Responsible for grandchildren5 22.6% Not responsible for grandchildrenHispanic or Latino 40 11.7% Responsible for grandchildren300 88.3% Not responsible for grandchildren