Races in Plainfield, Connecticut (CT) Detailed Stats
Ancestries, Foreign-born residents, place of birth

Recent posts about races in Plainfield, Connecticut on our local forum with over 2,400,000 registered users:
 | 2024 Connecticut Town Tournament VI (Celebrating the 10-Year Anniversary & Dazzleman's Memorial) (1055 replies) |
| Lakefront home near Plainfield (17 replies) |
| Economic Climate in CT (18750 replies) |
| Current Real estate markets (3987 replies) |
| Connecticut TOWN TOURNAMENT IV (2020) (849 replies) |
| moving to connecticut (25 replies) |
Latest news about races in Plainfield, CT collected exclusively by city-data.com from local newspapers, TV, and radio stations
3.1% of Plainfield, CT residents are foreign-born (1.5% born in Europe, 0.8% born in North America, 0.5% born in Latin America), which is 377.7% less than the foreign-born rate of 15.0% across the entire state of Connecticut.
Race distribution in Plainfield

- 13,79294.3%White alone
- 3842.6%Hispanic
- 1691.2%Two or more races
- 1130.8%Black alone
- 870.6%Asian alone
- 640.4%American Indian alone
- 60.04%Other race alone
- 40.03%Native Hawaiian and Other
Pacific Islander alone

2000
2022
-
- 2,638,84577.5%White alone
- 320,3239.4%Hispanic
- 295,5718.7%Black alone
- 81,5642.4%Asian alone
- 52,8961.6%Two or more races
- 8,1410.2%Other race alone
- 7,2670.2%American Indian alone
- 9580.03%Native Hawaiian and Other
Pacific Islander alone

-
- 2,246,91362.0%White alone
- 658,97818.2%Hispanic
- 353,9739.8%Black alone
- 172,9294.8%Asian alone
- 159,6314.4%Two or more races
- 29,7610.8%Other race alone
- 3,4280.09%American Indian alone
- 5920.02%Native Hawaiian and Other
Pacific Islander alone

Income and house value in Plainfield
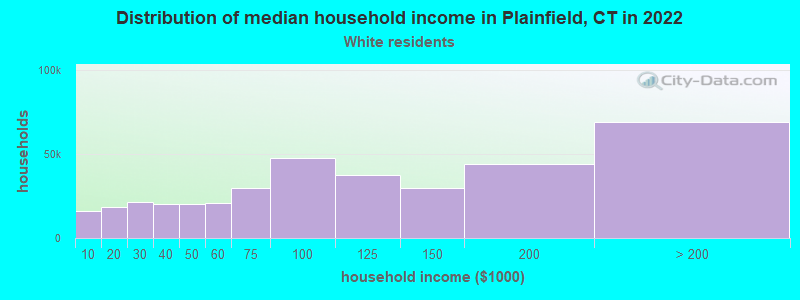
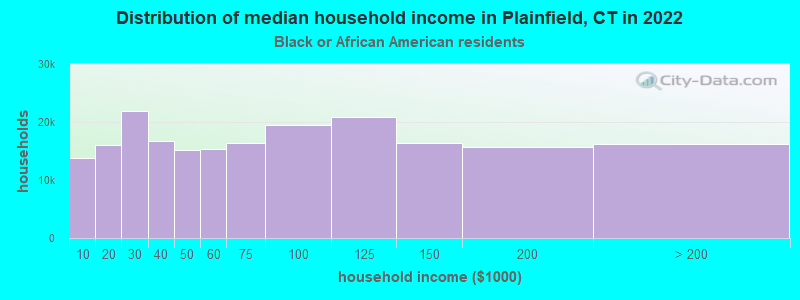
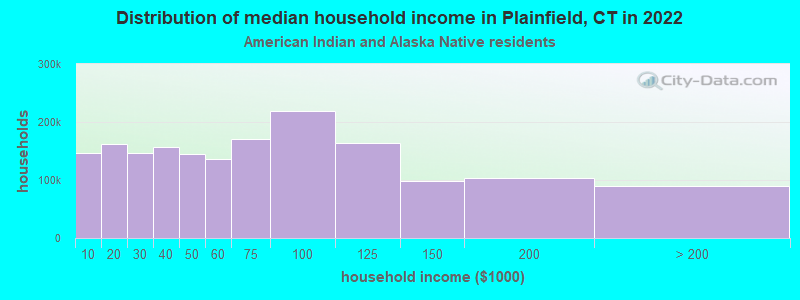
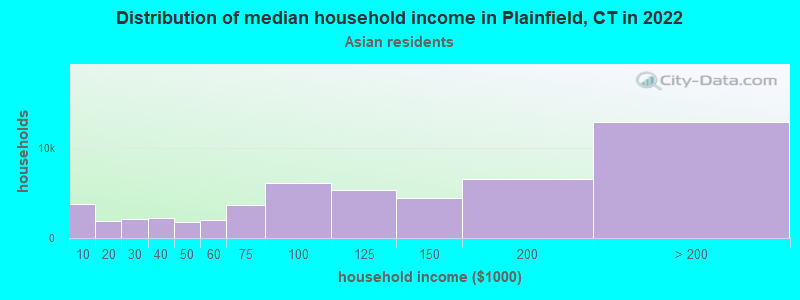
- Median household income in 2022
- $71,594White non-Hispanic householders
- $84,858Black householders
- $57,843American Indian and Alaska Native householders
- $107,855Asian householders
- $71,338Some other race householders
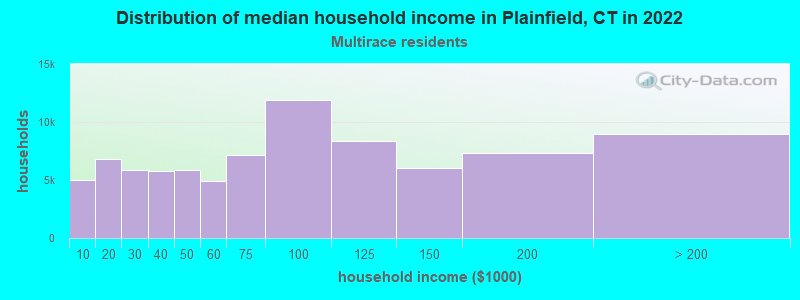
- $52,561Two or more races householders
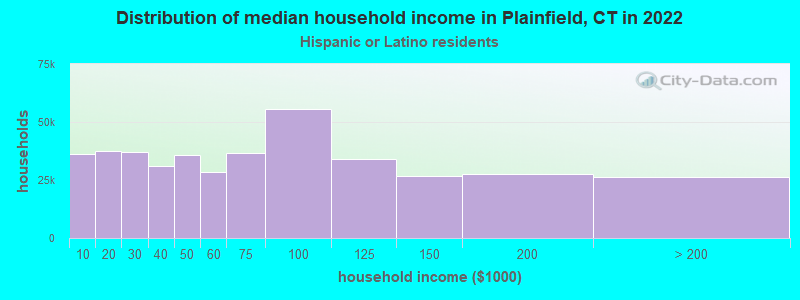
- $107,339Hispanic or Latino race householders
- Median 2022 house value
- $230,890White Non-Hispanic householders
- $293,801Black or African American householders
- $297,260Some other race householders
- $190,895Two or more races householders
- $272,614Hispanic or Latino householders
Household income for White non-Hispanic householders
Household income for Black householders
Household income for American Indian and Alaska Native householders
Household income for Asian householders
Household income for Two or more races householders
Household income for Hispanic or Latino race householders
Foreign-born residents in Plainfield
459 residents are foreign born (1.5% Europe, 0.8% North America, 0.5% Latin America).
| This city: | 3.1% |
| Connecticut: | 10.9% |
Ancestries in Plainfield

- 3,47318.3%French
- 2,39712.6%Irish
- 2,39512.6%Other
- 1,8409.7%English
- 1,7479.2%French Canadian
- 1,5898.4%German
- 1,3197.0%Italian
- 1,3136.9%Polish
- 7403.9%United States
- 3401.8%Scottish
- 2791.5%Scotch-Irish
- 2421.3%Swedish
- 1961.0%Portuguese
- 1921.0%Dutch
- 1620.9%Russian
- 1390.7%Lithuanian
- 1340.7%Norwegian
- 1030.5%Arab
- 870.5%Czech
- 690.4%Slovak
- 540.3%Welsh
- 510.3%Swiss
- 300.2%Danish
- 260.1%Greek
- 260.1%Ukrainian
- 240.1%Hungarian
- 70.04%Subsaharan African

Zip codes: 06374.